

NCBI Bookshelf. A service of the National Library of Medicine, National Institutes of Health.
Probe Reports from the NIH Molecular Libraries Program [Internet]. Bethesda (MD): National Center for Biotechnology Information (US); 2010-.
In this report, we describe a high throughput flow cytometry based multiplexed screen for molecules that either functionally mimic rapamycin (e.g. those that are transducer of regulated CREB 1 [TORC1] pathway selective, but non-discriminating of TORC1 branchpoints) or compounds that selectively target individual branches of the yeast TORC1 pathway. The high throughput screening (HTS) and the subsequent follow-up structure activity relationship (SAR) studies identified a chemotype that contains analogs of both functional types. Obtaining structurally related analogs with differential selectivity assisted in the characterization of the probe and the pathway in which it operates. Here we report ML231 as a TORC1 Retrograde signaling (RTG) branch selective probe (CIT2 EC50 = 3.8 μM). ML231 is selective on the RTG branch and only affects expression of a small subset of rapamycin-responsive genes. This selectivity appears unrelated to solubility as we showed that a more soluble analog was also selective on the RTG branch. ML231 and its analogs inhibited Sch9 phosphorylation, the major substrate and downstream effector of the TORC1 pathway. This result indicates that this chemotype affects TORC1 activity. ML231 inhibited TORC1 activity incompletely, as compared to a related analog, SID 96099781, which mimicked rapamycin and demonstrated complete TORC1 inhibition. This feature may be partially attributable to the branch selectivity of ML231. ML231 behaved very differently from SID 96099781 in the TORC1 bypass cell growth assay, showing that selective compounds may function downstream of TORC1 while SID 96099781 functions upstream or at the level of TORC1. This result suggests that the ML231 targets components downstream of TORC1, thus executing a partial function of TORC1. Collectively, this suggests that ML231 targets the RTG branch selectively. We further showed that ML231 induced the nuclear translocation of Rtg1p/Rtg3p transcription factors and the activity of ML231 on the CIT2 gene expression was dependent on the Rtg2 protein. These results further confirmed the activity of ML231 on the RTG branch. Although ML231 possesses structural and solubility challenges, this probe represents an achievement in target of rapamycin (TOR) selectivity that to our knowledge has not been previously described. ML231 will be used by investigators focusing on TORC1 signaling, RTG pathways and regulatory signaling between mitochondria and the nucleus.
Assigned Assay Grant #: 1 R03 MH086450-01
Screening Center Name & PI: University of New Mexico Center for Molecular Discovery (UNMCMD) formerly NM Molecular Libraries Screening Center (NMMLSC), Larry Sklar
Chemistry Center Name & PI: University of Kansas Specialized Chemistry Center (KU SCC), Jeffrey Aubé
Assay Submitter & Institution: Margaret Werner-Washburne, University of New Mexico
PubChem Summary Bioassay Identifier (AID): 1908
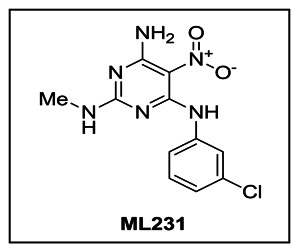
Probe Structure & Characteristics
| CID/ML#** | Target Name‡ | EC50 (nM) [SID,AID]† | Anti-target Name(s) | EC50 (μM) [SID, AID]† | Fold Selective* | Secondary Assay(s) Name: IC50 (nM) [SID, AID]§ |
|---|---|---|---|---|---|---|
| CID 3392161 ML231 | TOR/CIT2 | 3800 nM [SID 99300522, AID 488827] | TOR/AGP1 | >100 μM [SID 99300522, AID 488792] | >100 | Sch9 Phosphorylation: 2300
nM [SID 99300522, AID 504478] |
| CID 3392161 ML231 | TOR/CIT2 | 3800nM [SID 99300522, AID 488827] | TOR/MEP2 | >100 μM [SID 99300522, AID 488801] | >100 | Sch9 Phosphorylation: 2300
nM [SID 99300522, AID 504478] |
| CID 3392161/ML231 | TOR/CIT2 | 3800 nM [SID 99300522, AID 488827] | TOR/LAP4 | >100 μM [SID 99300522, AID 488795] | >100 | Sch9 Phosphorylation: 2300
nM [SID 99300522, AID 504478] |
| CID 3392161/ML231 | TOR/CIT2 | 3800 nM [SID 99300522, AID 488827] | TOR/RPL19A | >100 μM [SID 99300522, AID 488808] | >100 | Sch9 Phosphorylation: 2300
nM [SID 99300522, AID 504478] |
- ‡
Short descriptive name of target or pathway (similar for antitarget, if applicable).
- †
IC50/EC50 value in nM along with the PubChem SID and AID where this value can be found.
- §
For secondary assay provide the following information: Name, IC50/EC50 [SID, AID].
- *
Selectivity = anti-target IC50/target IC50.
- **
Provide the PubChem CID for the probe and the ML# obtained from NIH for the probe.
Recommendations for Scientific Use of the Probe
Limitations in current state of the art addressed by this probe: The goal of this project was to identify a branch selective probe for the yeast TORC1 pathway. There are only two types of TOR inhibitors available: one is the TORC1 selective inhibitor rapamycin and its analogs which do not discriminate between TORC1 branches; the others are ATP-competitive TOR inhibitors which inhibit both TORC1 and TORC2. Since we are searching for branch selective probes for the yeast TORC1 pathway, we utilized rapamycin (TORC1 selective, but not branch selective) as our comparator. Rapamycin, known as the first-generation TOR inhibitor, is a valuable tool that has been used to characterize the TORC1 pathway in both mammals and budding yeast [1]. However, as an allosteric TOR inhibitor, rapamycin does not completely inhibit the functions of mTORC1, nor does it block the activity of mTORC2 [2]. The outcome of clinical trials on rapamycin-based cancer therapies has been unpredictable, leading to combinational trials to encompass resistance mechanisms or pathway redundancies. Moreover, as a natural compound, rapamycin has limited pharmaceutical properties and has been hard to improve by traditional structure-activity-relationship analysis. Since TOR affects many aspects of cell function by regulating numerous, interdependent signaling pathways, it would be advantageous to both basic and translational research to singly interrogate a specific signaling branch. Due to rapamycin’s pleiotropic effects, it is not suitable for this purpose; however, a compound that targets a specific branch of TOR signaling would be a very useful chemical tool for dissecting the TOR pathways and may well serve as a potential drug lead for diseases caused by the aberrant activity within specific TOR branches.
Relevant Biology and Use of the Probe: Retrograde signaling (RTG) is a pathway of cellular communication from mitochondria to the nucleus that influences many cellular and organismal activities under both normal and pathophysiological conditions [3]. In both yeast and mammalian cells, RTG signaling is linked to TOR signaling but the precise connections have been unclear. In this project, we identified a scaffold in which the majority of the active constituents exhibit selectivity for the RTG branch of the TOR pathway. The focus of this report, SID 99300522 (CID 3392161/ML231), was identified as an RTG selective probe and represents an unprecedented opportunity for deconvoluting TORC1 pathways and identifying novel therapeutic targets. Compounds such as ML231 that demonstrate an improved selectivity profile as compared to rapamycin may possess increased therapeutic potential and fewer toxicological side effects. RTG selective probes such as ML231 will be used by investigators focusing on TORC1 signaling, RTG pathways and regulatory signaling between mitochondria and the nucleus.
1. Introduction
TOR proteins (Target of Rapamycin) are Ser/Thr protein kinases phylogenetically conserved from yeast to man [1, 4, 5]. Yeast possesses two TOR proteins that function in two distinct protein complexes, TOR complex 1 (TORC1) and TOR complex 2 (TORC2). The rapamycin-sensitive TORC1 signaling pathway affects many aspects of cell function by regulating numerous signaling pathway branches [5]. There are at least four signaling pathway branches regulated by TORC1 complex: 1) the RTG signaling pathway mediated by Rtg1p/Rtg3p that activates genes required for biosynthesis and homeostasis of glutamate and glutamine [6–9]; 2) the nitrogen-discrimination pathway (NDP) mediated by Gln3p that activates genes enabling the cells to import and catabolize poor nitrogen sources under nitrogen limitations [10, 11]; 3) the stress-response pathway mediated by Msn2p and Msn4p that regulates the transcription response to a wide range of stressors [12], and 4) signaling that controls translation, such as ribosomal protein synthesis, translation initiation and mRNA turnover [13, 14]. These four signaling branches are not independent of each other, but rather engage in substantial chemical cross-talk while also interacting with other signaling pathways, thus constituting a very complicated regulatory network. Therefore, the distinct advantage in identifying branch-selective compounds that can specifically target an individual downstream signaling channel is that these are chemical tools that can be used as in the dissection of the TOR pathway as well as potential drug leads for diseases caused by the abnormal activity of specific branches. Rapamycin is not suitable for this purpose due to its pleiotropic effects. As a central controller of cell growth, the mammalian TOR cognate mTOR has emerged as an attractive cancer target for drug discovery [15–19]. Although the natural compound rapamycin has been used as the first-generation mTOR inhibitor, the pharmacological studies on rapamycin and its rapalogs reveal that many cancers are insensitive to rapamycin and the clinical outcome is unpredictable, which leads to combinational trials with other pathway inhibitors [2]. Therefore, rationally designed, small molecule TOR inhibitors that possess suitable physiochemical properties as compared to rapamycin are highly desirable. A new generation of small molecule, ATP-competitive TOR inhibitors targeting both TORC1 and TORC2 complexes have been developed, such as Torin1, PP242 and PP30, which may be more effective than rapamycin alone [20–22]. However, there is great interest in developing small molecules that selectively inhibit either TORC1 or TORC2, as these are likely to unveil therapeutically relevant mechanisms. Prior to this work, functional compounds of this type were unknown or undisclosed in the literature. This report describes such a compound, ML231, which has been shown to selectively inhibit the CIT2 branch of the TORC1 pathway.
Using yeast as a model system, we identified ~100 GFP-tagged clones responsive to rapamycin by screening the whole yeast GFP clone collection (unpublished data). We subsequently conducted a multiplex high throughput flow cytometry screen of the MLSMR using five GFP-tagged yeast clones that represent the readouts of four branches of the TORC1 signaling pathway: 1) CIT2-GFP controlled by RTG signaling; 2) AGP1-GFP and MEP2-GFP controlled by NDP signaling; 3) LAP4-GFP controlled by MSN2/4 stress response signaling and 4) RPL19A-GFP controlled by translational signaling. Our goals were to identify molecules that mimic the function of rapamycin with distinct structure as well as molecules selective for individual branches that could target effectors of the TOR pathway or interfere with other non-TOR, cross-talk signaling mechanisms. Both types of molecules are useful; in particular, the branch-selective hits would represent an unprecedented finding. Such compounds that demonstrated cellular potency of less than 10 μM, lacking reactive functionality and possessing suitable physiochemical properties would be considered a probe. It was anticipated that such probes could be utilized for delineation of the complicated TOR network and as potential leads for therapeutic agents.
The HTS and subsequent follow-up experiments revealed a compound that behaves like rapamycin in terms of altering GFP expression in all five GFP clones. Surprisingly, the compounds selected for SAR exploration which also belong to the same structural family as the hit did not demonstrate the same rapamycin-like profile. Instead, many compounds in the series exhibited pathway selectivity for induction of CIT2-GFP expression, which is primarily regulated by the RTG pathway. RTG, linked to TOR signaling, is a pathway of communication from mitochondria to the nucleus by which cells respond to changes in the functional state of mitochondria via changes in nuclear gene expression. The RTG pathway influences many cellular and organismal activities under both normal and pathophysiological conditions, such as maintenance of glutamate homeostasis, regulation of mitochondrial DNA maintenance, and aging [3, 23].
In yeast, RTG signal induced CIT2 expression is controlled by two basic helix-loop-helix-leucine zipper (bHLH-Zip) transcription factors: Rtg1p and Rtg3p [24–26]. When the RTG pathway is inactive, Rtg3p is hyperphosphorylated at multiple sites and localized in the cytoplasm together with Rtg1p. Upon activation of the RTG pathway (such as after treatment with rapamycin), Rtg3p becomes partially dephosphorylated and enters the nucleus, as does Rtg1p, where these proteins assemble at R box sites to activate transcription of target genes [24–26]. In addition, numerous elegant genetic studies have also described other positive regulators, Rtg2p and Grr1p as well as four negative regulators, Mks1p, Bmh1p, Bmh2p and Lst8p that control RTG-induced CIT2 expression. Rtg2p is a novel cytoplasmic protein with an N-terminal ATP binding domain that is required for the relocalization of Rtg1p/rtg3p from the cytoplasm to the nucleus [27, 28]. Grr1p mediates the ubiquitination of the negative regulator Mks1p. Mks1p negatively regulates the RTG pathway by binding to 14-3-3 proteins Bmh1p and BMH2p [28]. Lst8p, a component of TORC1 complex with WD-40 repeats, regulates the RTG pathway negatively by acting at two distinct sites, one upstream of RTG2 by affecting the ability of cells to sense external glutamate, and the other downstream of RTG2 by an unknown mechanism [9]. In addition to the protein regulators, glutamate/glutamine and ammonia were also demonstrated to regulate the RTG pathway [29, 30]. However, the precise connections between the RTG pathway and the TOR pathway are presently unknown. Moreover, a number of aspects of the RTG pathway also remain unknown, such as the relevant kinase(s) or phosphatase(s) that modify Rtg3p, the unique function of the novel protein Rtg2p and the dual functions of Lst8p in both RTG and TOR pathways. The RTG branch selective probe identified from this project will aid in addressing the above questions and provide, for the first time, a useful chemical tool for dissecting the connections between RTG and TORC1 signaling.
2. Materials and Methods
General information
Yeast GFP clones, CIT2-GFP, AGP1-GFP, MEP2-GFP, LAP4-GFP and RPL19A-GFP were identified from an HTS campaign against the yeast GFP clone collection (Invitrogen) as the clones that respond to rapamycin. GFP clones were maintained on synthetic complete media (SCD) agar plates and grown in SCD media (Clontech, CA). S288C and BY4741 parental strains were obtained from stock cultures in our lab and are maintained and grown on SCD or YPD media (Fisher Scientific). The TORC1 bypass strain [31] was provided by Dr. Virgilio and was maintained in synthetic media lacking uracil (SD-Ura). The strain containing the CIT2-GFP reporter in rtg3 knockout background (BY4741, CIT2-GFP; rtg3::KmMX) was provided by Dr. Virgilio and was maintained on SCD or YPD plates. The CIT2-LacZ reporter strains in rtg2 or lst8 knockout background [9] were kindly provided by Dr. Liu and were maintained on YPD plates. Rtg3-GFP and Gln3-GFP strains were revived from yeast GFP clone collection and grown on YPD plate.
The fluorescent dyes Alexa Fluor® 405 and Alexa Fluor® 633 were purchased from Invitrogen™ (Eugene, OR). Rapamycin was purchased from TOCRIS Biosciences (Missouri, USA). Hyclone PBS buffer was purchased from ThermoFisher Scientific (Logan, Utah). BSA powder was purchased from Sigma-Aldrich (St. Louis, MO). Pluornic F-68 was purchased from Invitrogen.
Compounds ordered by UNM for SAR by commerce prior to involvement of the KU SCC were purchased from ChemDiv (San Diego, CA) and Ryan Scientific (Mt. Pleasant, SC). Unless otherwise indicated, all compound solutions were maintained and diluted in DMSO prior to addition to assay wells. Final DMSO concentrations were no more than 1% v/v. A Biomek® NX Multichannel (Beckman-Coulter, Fullerton, CA) was used for all cell and compound solution transfers for volumes greater than 1 μL. Low volume transfers (100 nL) were done via pintool (V&P Scientific, Inc., San Diego, CA). Compound dose response plates were generated with the Biomek® NX Span-8 (Beckman-Coulter, Fullerton, CA). The HyperCyt® high throughput flow cytometry platform (IntelliCyt™, Albuquerque, NM) was used to sequentially sample cells from 384-well microplates (2 μL/sample) for flow cytometer presentation at a rate of 40 samples per minute. Flow cytometric analysis was performed on a CyAn™ flow cytometer (Beckman-Coulter, Fullerton, CA). The resulting time-gated data files were analyzed with HyperView® software to determine compound activity in each well [32, 33]. Inhibition response curves were fitted by Prism® software (GraphPad Software, Inc., San Diego, CA) using nonlinear least-squares regression in a sigmoidal dose response model with variable slope, also known as the four-parameter logistic equation.
2.1. Assays
A. Primary Assay 1 (single point, 5-plex): multiplex HTS screen of TOR pathway GFP-fusion proteins in S. cerevisiae. AIDs: 1870, 1887, 1867,1873, 1862, 2066, 2029, 2025, 2023, 2016
This multiplex assay was conducted in a total volume of 10.1 μL in 384-well microtiter plates. The strains were grown separately overnight in SCD media in a shaking incubator at 30 ºC, and then stained for multiplexing with the Alexa Fluor 405 and Alexa Fluor 633 (see Figure 10 for staining scheme). Following staining, the yeast were combined and diluted into fresh SCD media at 0.5 OD600. 5 μL SCD media supplemented with 0.03% pluronic were loaded into 384-well microtiter plates and 100 nL compounds were pintool-transferred. DMSO control and rapamycin (220 nM) controls were added to the first column and the second column respectively. A volume of 5 μL mixed cells were transferred into 384-well microtiter plates and incubated for 3 hours at 30 ºC with end-over-end rotation. The cells in the multiplex were interrogated for GFP expression levels using established high-throughput flow cytometric methodologies at the UNMCMD. Approximately 2 μL volumes from each well were collected at a rate of approximately 40 samples per minute. This results in analysis of approximately 1,000 cells of each cell type from each well. Flow cytometric data of light scatter and fluorescence emission at 530±20 nm (488 nm excitation, FL1), 665±10 nm (633 nm excitation, FL8) and 450±25 nm (405 nm excitation, FL6) were collected.
Figure 10
TORC1 bypass cell growth analysis on the probe ML231 and SID 96099781. 1:10 serial dilutions of BY4741 and TORC1 bypass cells were spotted onto the YPD plates supplemented with 7.5–60 μM compounds respectively
B. Primary Assay 2 (single point, dose response, single-plex): Dose response of TOR pathway GFP-fusion proteins in S. cerevisiae. AIDs: 2643, 2624, 2623, 2622, 2621, 2274, 2273, 2272, 2271, 2270, 504321, 504334, 504336, 504338, 504340, 504458, 504461, 504468, 504469, 504470, 504463, 2744, 2743, 2742, 2740, 2745, 488812, 488790, 488814, 488823, 488825, 488792, 488795, 488801, 488808, 488827
This dose response assay was conducted in a single-plex format. Six yeast GFP clones including 5 clones used for the primary screen and a non-GFP parental strain S288C or BY4741 were used for dose response analysis. This assay was conducted in a total volume of 10.1 μL in 384-well microtiter plates. The strains were grown overnight in SCD media in a shaking incubator at 30 ºC, and then diluted into fresh SCD media at 0.5 OD600. 5 μL SCD media supplemented with 0.03% pluronic F-68 were loaded into 384-well microtiter plates and 100 nL compounds were pintool-transferred. DMSO control and rapamycin (220nM) controls were added to the first column and the second column respectively. A volume of 5 μL cells were transferred into 384-well microtiter plates and incubated for 3 hours at 30 ºC with end-over-end rotation. The yeast cells were interrogated for GFP expression levels using established high-throughput flow cytometric methodologies at the UNMCMD. Approximately 2 μL volumes from each well were collected at a rate of approximately 40 samples per minute. This resulted in analysis of approximately 5,000 cells of each cell type from each well. Flow cytometric data of light scatter and fluorescence emission at 530±20 nm (388 nm excitation, FL1) were collected.
C. Secondary Assay 1: Yeast TORC1 bypass cell growth assay. AID: 504456
This assay was conducted in 8-well square plates to test the cytotoxicity of compounds and to test if the compounds behaved like rapamycin. YPD agar with 3–30 μM compounds, DMSO and rapamycin were made in 8-well square plates respectively. The TORC1 bypass and BY4741 cells were grown overnight in SD-Ura and SCD media, respectively. The cells were diluted to OD 0.25 followed by 1:10 serial dilution. 2.5 μl cells were spotted onto the YPD/compound plates with multichannel pipettes. The plates were incubated for 48–72hrs and cell growth was photographed.
D. Secondary Assay 2: Sch9p phosphorylation assay. AID: 504478
This assay measures the in vivo phosphorylation of Sch9p by chemical fragmentation analysis followed by western blot [31, 34]. Briefly, yeast cells expressing C-terminal HA-tagged Sch9p were treated with compounds in a dose-dependent manner for 30 minutes. Cells were mixed with TCA (final concentration 6%) and put on ice for at least 5 minutes before cells were pelleted, washed twice with cold acetone, and dried in a speed-vac. Cell lysis was done in 100 mL of urea buffer (50 mM Tris [pH 7.5], 5 mM EDTA, 6 M urea, 1% SDS, 1 mM PMSF, and 0.53 mL protease inhibitor) with glass beads in a bead beater with subsequent heating for 10 min to 65 ºC. For NTCB cleavage, 30 mL of 0.5 M CHES (pH 10.5) and 20 mL of NTCB (7.5 mM in water) were added and samples incubated over night at RT before 1 volume sample buffer (+20 mM TCEP and 0.53 mL protease inhibitor) was added. Further analysis was done by SDS-PAGE and immunoblotting using anti-HA antibody 12CA5 or anti-T570-P antiserum. The band intensity was measured in arbitrary units.
E. Secondary assay 3: YPK1 phosphorylation assay
This assay measures the in vivo phosphorylation of YPK1 by western blot as described previously [35].
F. Secondary Assay 4: RapaGFP clones screening. AID: 504473
This assay is conducted in 384-well plates. First, the whole yeast GFP collections were screened against rapamycin and DMSO and ~106 GFP clones were identified to respond to rapamycin (unpublished data). Second, 96 rapamycin-responsive GFP clones (called RapaGFP clones) were arrayed in a 96-well plate and used to screen against the active compounds in dose response analysis. 1 μL yeast cells from the source 96-well plate were transferred into a 96-well plate containing 150 μL SCD in each well and grown overnight. The cultures were diluted 2 fold, and continued to incubate for an additional 1 hr. A volume of 10 μL culture was added to a 384-well assay plate by the Biomek Span-8 (Beckman Coulter, USA) in triplicate. 10 μL SCD media supplemented with 0.03% pluronic F-68 containing the appropriate concentration of compounds were added using the Nanoquot (BioTek, USA) dispenser. The assay plates were incubated at 30 ºC for 3hrs and read by HT flow cytometry.
G. Secondary Assay 5: CIT2-GFP expression in RTG3 mutant background
This assay was conducted as described for the primary dose response assay. The CIT2-GFP strain and the CIT2-GFP strain in Rtg3p knockout background were used in this assay to test against active compounds and rapamycin.
H. Secondary Assay 6: CIT2-LacZ expression in RTG2 mutant background
This assay was conducted in 1.5 mL tubes by testing only active compounds. The CIT2-LacZ strain and CIT2-LacZ in the rtg2p knockout background were used in this assay. The cells were grown over night in SCD media and diluted into 0.25 OD600 in 1 mL fresh SCD media. The cells were treated with DMSO, 220 nM rapamycin and 5 active compounds at a concentration of 5*EC50 for 3 hrs, respectively. Then LacZ enzyme activity was measured as described previously [36].
I. Secondary assay 7: RTG3-GFP localization assay. AID: 504471
The RTG3-GFP clone was grown in SCD media overnight and diluted into 0.25 OD600. 1 mL cells were treated for 3 hrs with 30 μM compounds as well as 0.2 μM rapamycin and DMSO as controls, respectively. The localization of GFP was observed using a fluorescent microscope.
2.2. Probe Chemical Characterization
A. Probe Chemical Structure, Physical Parameters and Probe Properties
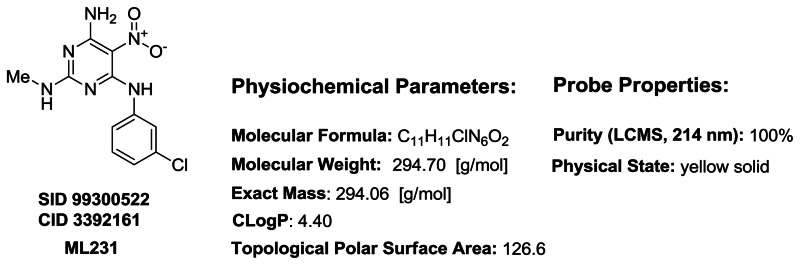
Figure 1Property summary of probe compound ML231 (SID 99300522, CID 3392161)
B. Structure Verification and Purity: 1H NMR, 13C NMR, LCMS and HRMS
Proton and carbon NMR data for ML231 (SID 99300522 CID 3392161): Detailed analytical methods and instrumentation are described in section 2.3, entitled “Probe Preparation” under general experimental and analytical details. The numerical experimental proton and carbon data are represented below. Associated spectra are also included for reference (Appendix A, see Figure A1 and A2 for 1H NMR and 13C NMR respectively).
ML231 (SID 99300522 CID 3392161): PROTON NMR DATA:1H NMR (400 MHz, DMSO-d6, mixture of 2 tautomers in 1:1 ratio), δ 1H-NMR (400 MHz, δ 11.39 (s, 1H), 11.24 (s, 1H), 8.69 (s, 1H), 8.49 (s, 1H), 8.32 (s, 1H), 8.18 (t, J = 2.0 Hz, 1H), 8.01–7.99 (m, 2H), 7.76–7.72 (m, 1H), 7.65–7.57 (m, 3H), 7.39 (t, J = 8.1 Hz, 1H), 7.36 (t, J = 8.1 Hz, 1H), 7.22–7.16 (m, 2H), 2.84–2.82 (m, 6H).
ML231 (SID 99300522 CID 3392161): CARBON NMR DATA:13C NMR (125 MHz, DMSO-d6, mixture of 2 tautomers in 1:1 ratio) δ 159.9, 159.7, 159.38, 159.33, 155.8, 155.3, 139.7, 139.4, 133.0, 132.8, 130.1, 123.78, 123.75, 122.1, 121.8, 120.80, 120.78, 108.01, 107.98, 79.1, 27.9, 27.7
LCMS and HRMS data for ML231 (SID 99300522 CID 3392161): Detailed analytical methods and instrumentation are described in section 2.3, entitled “Probe Preparation” under general experimental and analytical details. Purity assessment by LCMS at 214 nm for ML231 (SID 99300522 CID 3392161) revealed a retention time of 3.09 min and purity at 214 nm of 100%. HRMS m/z was calculated for C11H11ClN6O2 [M+ + H]: 295.0705, found 295.0716. The experimental LCMS and HRMS spectra are included for reference (Appendix A, Figures A3 and A4 respectively).
C. Solubility
Aqueous solubility of ML231 was measured in phosphate buffered saline (PBS) at room temperature (23 °C). PBS by definition is 137 mM NaCl, 2.7 mM KCl, 10 mM sodium phosphate dibasic, 2 mM potassium phosphate monobasic and a pH of 7.4. The solubility of probe ML231 (SID 99300522 CID 3392161) in this system was determined to be 0.05 μg/mL. [37]
The concentration of the probe (0.24 μM) is somewhat lower than the determined CIT2 EC50 (3.8 μM) (Table 1). To test if ML231 and selected analogs were more soluble under the assay conditions, solubility was evaluated in yeast synthetic media containing 0.015% pluronic F-68 and 1% DMSO by counting solution particle formation by flow cytometry at the UNMCMD [38, 39] and independent results were obtained using the same media employing methods comparable to those used for the PBS buffer solubility determination. [37]
Table 1
Solubility experiments in various media with ML231 and analogs.
These experiments revealed that the aqueous solubility of this series, represented by 3–4 examples shown in Table 1 which included the probe ML231, is limited. Improved solubility in assay media as compared to PBS buffer was observed; however, the limitations persisted. Accumulation of ML231 in cells to higher levels than suggested by the solubility assays and solubility enhancement by reversible binding to biomolecules in the intracellular environment may account for the discrepancy between the EC50 and apparent soluble concentration in media alone. Additional work is necessary to substantiate this hypothesis.
D. Stability
Aqueous stability was measured at room temperature (23 ºC) in PBS (no antioxidants or other protectants and DMSO concentration below 0.1%). The stability of probe compound ML231 (SID 99300522 CID 3392161), determined as the percent of compound remaining after 48 hours, was 89% [37]. Stability data are depicted as a graph showing the loss of compound with time over a 48 hour period with a minimum of 6 time points and provide the percent remaining compound at end of the 48 hours (Figure 2).
Figure 2
Aqueous stability of compound ML231 (SID 99300522, CID 3392161).
Notably, the duration of the assays used in characterizing ML231 and its analogs did not exceed 3 hours. As such it is not anticipated that the observed activity associated with ML231 is due to a reactive species. To further address if the scaffold was susceptible to nucleophiles and forming a reactive intermediate, ML231 was treated with glutathione. In each of four separate vials was added ML231 (5.0 mg, 0.017 mmol). L-Glutathione was added to each vial in the ratio of (ML231:glutathione) 1:1, 1:2, 1:3 and 1:4, respectively. DMSO (1 mL) was added to each vial and the reaction mixtures were stirred at room temperature for 48 h. Each reaction was monitored by LCMS over the 48 h period, and no change from starting material was observed in either the UV or the MS spectroscopy. After the 48 h experiment, the reaction containing the 1:1 ratio of ML231 to L-glutathione was doped with an additional 3 eq. of L-glutathione and heated at 80 °C for 2h. No change in UV was observed. An additional minor peak was noted (< 1%) in the MS spectrum besides starting material; however, the mass did not correlate to an identifiable displacement or addition product. The ML231 scaffold appears to be stable at room temperature when exposed to an excess (4 eq.) of glutathione and even under heating at high temperature.
E. Synthetic Route
The probe compound ML231 (SID 99300522 CID 3392161) was prepared in a one-pot procedure by taking advantage of the differential reactivity of the three chlorine atoms and sequential amination reactions (Figure 3).
Figure 3
General synthetic route for probe and associated analogues.

2.3. Probe Preparation
General experimental and analytical details:1H and 13C NMR spectra were recorded on a Bruker AM 400 spectrometer (operating at 400 and 101 MHz respectively) or Bruker AM 500 spectrometer (operating at 500 and 125 MHz respectively) in CDCl3 with 0.03% TMS as an internal standard or DMSO-d6. The chemical shifts (δ) reported are given in parts per million (ppm) and the coupling constants (J) are in Hertz (Hz). The spin multiplicities are reported as s = singlet, br. s = broad singlet, d = doublet, t = triplet, q = quartet, dd = doublet of doublet and m = multiplet. The LCMS analysis was performed on an Agilent 1200 RRL chromatograph with photodiode array UV detection and an Agilent 6224 TOF mass spectrometer. The chromatographic method utilized the following parameters: a Waters Acquity BEH C-18 2.1 × 50mm, 1.7 μM column; UV detection wavelength = 214nm; flow rate = 0.4 mL/min; gradient = 5 – 100% acetonitrile over 3 minutes with a hold of 0.8 minutes at 100% acetonitrile; the aqueous mobile phase contained 0.15% ammonium hydroxide (v/v). The mass spectrometer utilized the following parameters: an Agilent multimode source which simultaneously acquires ESI+/APCI+; a reference mass solution consisting of purine and hexakis (1H, 1H, 3H-tetrafluoropropoxy) phosphazine; and a make-up solvent of 90:10:0.1 MeOH:Water: Formic Acid which was introduced to the LC flow prior to the source to assist ionization. Melting points were determined on a Stanford Research Systems OptiMelt apparatus.
The probe was synthesized by the route shown in Figure 3 (section 2.2E) and the following protocol: Probe ML231 (SID 99300522, CID 3392161): N4-(3-chlorophenyl)-N2-methyl-5-nitropyrimidine-2,4,6-triamine: To a solution of 2,4,6-trichloro-5-nitropyrimidine (1.0 eq, 0.657 mmol, 0.150 g) in EtOH (3.0 mL) at −40 °C, was added dropwise a solution of 3-chloroaniline (1.0 eq, 0.657 mmol, 0.084 g) and DIPEA (3.0 eq, 1.97 mmol, 0.255 g) in EtOH (1.5 mL). After stirring for 0.5 h at −40 °C, ammonia (2.0 M in MeOH, 4.0 eq, 1.3 mL) was added and the mixture was slowly warmed up to rt and stirred for 4h. Methylamine (33% wt. in absolute ethanol, 4.0 eq, 0.36 mL) was added and the mixture was kept on stirring for 16 h. The reaction was diluted with CHCl3 (20 mL) and washed with brine (10 mL). The separated organic extracts were dried (MgSO4) and concentrated. The residue was purified by chromatography (Biotage 50 g silica gel column, EtOAc/Hexane) to afford N4-(3-chlorophenyl)-N2-methyl-5-nitropyrimidine-2,4,6-triamine (0.077 g, 40%) as a yellow solid.
Submitted Probe Analogs
Experimental details and supporting information for the five submitted analogues can be found in Appendix B.
3. Results
This project has revealed both rapamycin-like compound and branch selective modulators. In this report, we focus on a chemotype whose analogs exhibit both rapamycin-like and RTG branch selective activity. The subject of this report, probe ML231 (SID 99300522 CID 3392161), is reported as a potent RTG branch selective probe.
3.1. Summary of Screening Results
The primary screening results are summarized here with the flow chart (Figure 5) showing the overall workflow for the project and the AIDs uploaded to date. The primary screening was carried out in a 5-plex assay format in which CIT2, AGP1, MEP2, LAP4 and RPL19A GFP fusion clones were color-coded with Alexa Fluor dyes and evaluated simultaneously with respect to the alteration of GFP expression (Figure 6). Rapamycin was used as positive control to ensure the GFP clones have the appropriate response. With the treatment of rapamycin for 3 hrs, the GFP signal in CIT2, AGP1, MEP2 and LAP4 clones were increased to 1.5-fold or greater whereas that in RPL19A clone was decreased to 0.5 fold compared to the DMSO negative control. Compounds were scored active if the median channel fluorescence (MCF) of GFP in each clone were altered to the extent greater than 50% compared to the DMSO. The cut-off values for each clone were as follows: CIT2, AGP1 and LAP4 (increased to 1.5 fold), MEP2 (increased to 1.75 fold) and RPL19A (decreased to 0.66 fold). The primary screening results were uploaded as 10 AIDs: 1870, 2029-multiplex HTS screen of TOR pathway GFP-fusion protein in S. cerevisiae_specifically_CIT2; 1887, 2066- multiplex HTS screen of TOR pathway GFP-fusion protein in S. cerevisiae_specifically_AGP1; 1867, 2016- multiplex HTS screen of TOR pathway GFP-fusion protein in S. cerevisiae_specifically_MEP2; 1873, 2023- multiplex HTS screen of TOR pathway GFP-fusion protein in S. cerevisiae_specifically_LAP4, and 1862, 2025- multiplex HTS screen of TOR pathway GFP-fusion protein in S. cerevisiae_specifically_RPL19A. A total of 320,000 compounds were tested with 73, 225, 1059, 443 and 64 actives in CIT2, AGP1, MEP2, LAP4 and RPL19A clones respectively.
Figure 5
TOR compound triage and flow chart.
Figure 6
Schematic of screen strategy. A) Simplified yeast TORC1 signaling pathway showing the four signaling branches probed in this project. B) Dot plot showing the multiplex staining of 5 yeast GFP report clones using Alexa Flours 405 and 633.
Two subsequent SMR cherry picks resulted in single point confirmation of ~2400 compounds (AIDs: 2643, 2624, 2623, 2622, 2621, 2274, 2273, 2272, 2271 and 2270). The cherry pick single point confirmation screens resulted in 613 compounds for further dose response confirmation. The dose response confirmation dataset was uploaded as AIDs 2744, 2743, 2742, 2740, 2745 and resulted in 31, 28, 26, 228, 123 actives for CIT2, AGP1, MEP2, LAP4 and RPL19A branches respectively. A set of counter screens for 488/530 nm fluorescent compounds using S288c parental none-GFP yeast strain was also associated with the SMR cherry pick sets. These data were uploaded as AID 2757 where the 613 compounds were tested with a total of 21 compounds noted as green fluorescence. Autofluorescence was calculated on the basis of MCF detected in the green fluorescence channel (530 +/−20 nM) and the subtraction of the autofluorescence of the cells, as shown in the following equation: Fluorescence = MCF_CMPD - MCF_CELL where MCF_CMPD is the MCF of cells in the presence of test compound and MCF_CELL is the MCF of cells in the presence of the DMSO control. The compound was noted to be active if the fluorescence was greater than the average plus three standard deviations of the control wells on the plate. The activity score was calculated based on normalizing the fluorescence to the maximum measured.
A total of 255 compounds were confirmed. While one compound altered GFP expression in all five GFP clones as rapamycin does, some of the compounds were found to be selective on individual branches. The data was analyzed as follows: RawMCF values were converted to RawkMESF with the aid of calibration beads. SubkMESF were calculated by subtracting the baseline fluorescence measured from the S288c parental strain. Percent response was calculated by using the span of rapamycin response collected on the same plate. %Response= (SubkMESF@Conc–SubkMESF@DMSO)/( SubkMESF@Rap0.4μM– SubkMESF@DMSO). Note that for RPL19A, the absolute value of ( SubkMESF@Rap0.4μM– SubkMESF@DMSO) was used for calculation of the GFP decrease in RPL19A clone.
A total of 82 powder compounds of the 255 dose response confirmed hits were ordered by KU SCC on the basis of chemistry tractability and availability. These compounds were tested in the dose response confirmation (AIDs: 488792, 488795, 488801, 488808 and 488827). The 488/530 nm fluorescence profiling using the S288c parental non-GFP yeast strain was also performed in a dose response assay (AID 488829). The dose response confirmed the activity of 79 compounds. As one of the original goals of the project was to identify compounds with rapamycin-like activity with improved physiochemical behavior, the team was pleased to identify and confirm compound CID 3528206 (SIDs 96099781 and 26664184) that altered GFP expression in all five yeast clones, as seen with rapamycin (Figure 7A). This compound was further characterized in secondary assays, the outcomes of which are described in Figure 7.
The first secondary assay was aimed at determining cytotoxicity of the compound in the TORC1 bypass cell growth assay (Figure 7C, AID: 504456). Compound CID 3528206 (SID 96099781) inhibited wild-type cell growth but not TORC1 bypass cell growth at 15–30 μM, suggesting that it may be not toxic to yeast. Otherwise, it would have inhibited both wild-type and TORC1 bypass cell growth.
The second assay was used to determine the impact on the TORC1 complex in the TORC1 bypass cell growth assay (Figure 7C, AID: 504456). Compound CID 3528206 (SID 96099781), behaved like rapamycin and inhibited wild-type cell growth but not TORC1 bypass cell growth at 15–30 μM, suggesting that it is functional at the level of TORC1 or upstream, as is rapamycin. This is in agreement with the dose response analysis by which only CID 3528206 (SID 96099781) was shown to be active in all 5 GFP clones in an analogous way as rapamycin.
The third assay of interest was used to determine the impact on inhibition of TORC1 activity by measuring Sch9p (a direct TORC1 substrate) phosphorylation (Figure 7D, AID: 504478). CID 3528206 (SID 96099781) inhibited Sch9p phosphorylation with an IC50 of ~ 4 μM indicating that it inhibits TORC1 activity on the phosphorylation of Sch9p.
The fourth assay was used to determine the impact on inhibition of TORC2 activity by measuring phosphorylation of YPK1 (a direct TORC2 substrate (Figure 7E). CID 3528206 (SID 96099781) did not appear to inhibit YPK1 phosphorylation associated with TORC2.
Taken together, compound CID 3528206 (SIDs 96099781 and 26664184) may function as a specific small molecule inhibitor of TORC1 like rapamycin.
To gain preliminary SAR data for the scaffold on which CID 3528206 (SIDs 96099781 and 26664184) is based, a series of 30 structurally related compounds were picked from the DPI chemical library and included in the final round of cherry pick which contained 112 compounds. This final cherry pick compound set was tested in single-point conformation and dose response confirmation assay. Eleven AIDs were uploaded: 5 AIDs for single point confirmation (AIDs: 504321, 504334, 504336, 504338, 504340), 5 AIDs for dose response confirmation (AIDs: 488812, 488790, 488814, 488823 and 488825) and an AID for the fluorescent counter screen (AID 488818).
Of those compounds tested, one (SID 26671376, CID 3528206 – an early batch of the probe compound) stood out in its activity profile as an exclusive inhibitor of the CIT2 GFP clone even though the selective compound differed structurally from the rapamycin-like hit CID 3528206 by only the exchange of a 3-fluorophenyl group for a 3-chlorophenyl group at the same position (Figure 8). This result indicated that the nascent SAR on this single chemotype contained analogs exhibiting both rapamycin-like activity and branch selective activity. This interesting finding permitted the development of a branch selective probe and the determination of the structural and biological basis for the selectivity as compared to the rapamycin-like hit, CID 3528206.
Figure 8
Dose response analysis of probe compound ML231.
To date, 57 SAR compounds have been resupplied and assessed in dose response confirmation. The raw MCF data and % response data were plotted. Compounds were claimed as actives if two thresholds were met: 1) observation of the same fold-change of GFP expression cut-off value in the primary screen; for CIT2, AGP1 and LAP4 (increased to 1.5 fold or greater), for MEP2 (increased to 1.75 fold or greater) and for RPL19A (decreased to 0.66 fold or less), and 2) percent response (relative to rapamycin) at 100 μM was greater than 20%. A total of 9 compounds in this series were active in dose response (AIDs: 488792, 488795, 488801, 488808 and 488827) (Figure 9 and section 3.4 SAR tables). Compound (CID 3528206 SID 96099781) was the only compound that alters GFP expression in all five GFP clones.
Figure 9
Dose response curves for the active compounds. Dose response analysis was performed at least 3 times for all these compounds except SID 99300546 (CID 3739601). The data from one experiment are used as examples.
Compound (CID 50904403 SID 110923093) alters GFP expression in CIT2, AGP1, MEP2 and RPL19A clones, but not in the LAP4 clone. A total of seven compounds (SID 99300522, 99300541, 99300546, 99300549, 99300550, 110923089 and 110923090) are exclusively active on CIT2 expression. Among the 7 CIT2 branch selective compounds, CID 3392161 (SID 99300522) induces the second strongest response (91.7%) with the second best EC50 (3.8 μM). CID 50904400 (SID 110923089) is the most potent compound (EC50= 0.6 μM), but induces the weakest response (% response: 24.0%). CID 3449329 (SID 99300541) induces the strongest response (97.7%) with a lower EC50 (8.8 μM). All 57 SAR compounds were assessed in the TORC1 cell growth secondary assays for evaluation of cytotoxicity and activity on TORC1 complex (AIDs: 504456). One compound (CID 46864179 SID 99300521) among these 57 compounds inhibits both wild-type and TORC1 bypass cell growth at 30 μM, suggesting it is toxic to yeast cells at this concentration, and only compound (CID 3528206 SID 96099781) was confirmed to inhibit wild-type cell growth but not the TORC1 bypass cell growth. The compound (CID 50904403 SID 110923093) targeting 4 GFP clones did not inhibit wild-type yeast cell. None of CIT2 selective compounds inhibited wild-type cell growth up to 60 μM (Figure 10 and data not shown). These data suggest that the CIT2 selective analogs may have a common mechanism of action but distinct from that of compound CID 3528206 (SID 96099781).
To investigate if the CIT2 selective compounds inhibit the phosphorylation of Sch9p as SID 96099781 (CID 3528206) does (Figure 7D), we evaluated the activity of SID 99300522 (CID 3392161), SID 99300541 (CID 3449329) and SID 99300549 (CID 4359574) in the Sch9p phosphorylation assay (Figure 11). All three compounds inhibited Sch9p phosphorylation. Compound SID 99300522 (CID 3392161) is shown to be the most potent inhibitor in this assay with IC50 2.3 μM. The IC50s of SID 99300541 (CID 3449329) and SID 99300549 (CID 4359574) were 14.7 μM and 5.9 μM, respectively. However, compared to SID 96099781 (CID 3528206), which completely inhibited Sch9p phosphorylation, none of the CIT2 selective compounds fully inhibited Sch9p phosphorylation. SID 99300522 (CID 3392161) inhibited the Sch9p phosphorylation up to 89% while SID 99300541 (CID 3449329) and SID 99300549 (CID 4359574) only inhibited 70%–75% (Figure 11, and section 3.4 SAR tables). With respect to its selectivity, amplitude and potency, SID 99300522 (CID 3392161) was chosen as the probe in this probe report.

One key regulatory step in RTG pathway is the nuclear localization of Rtg1/3p [6, 8]. To investigate if the probe induces nuclear translocation of Rtg1/3p, we tested the probe SID 99300522 (CID 3392161), SID 96099781 (CID 3528206), SID 99300541 (CID 3449329) and rapamycin in the Rtg3p-GFP localization assay (Figure 12). Compared to the treatment with DMSO, Rtg3p-GFP was translocated into the nucleus after treatment with the probe SID 99300522 (CID 3392161), SID 96099781 (CID 3528206) and SID 99300541 (CID 3449329). Rapamycin also induced the nuclear translocation of Rtg3p-GFP. This result shows that the probe and its analogs can induce nuclear translocation of Rtg3p by which the CIT2 expression is induced.
Figure 12
Rtg3p-GFP translocation assay. Rtg3p-GFP cells were grown in SCD media and treated with 30μM compounds for 3hrs. The GFP localization was observed under the fluorescent microscope.
To further confirm the activity of the probe SID 99300522 (CID 3392161) on the RTG pathway and investigate its point of action, we carried out genetic analysis to measure CIT2 expression in the knockout background of RTG proteins and the Lst8p mutants, which are the key components of the RTG pathway (Figure 13A). First, we measured CIT2-GFP expression in the Rtg3p knock out mutant with the treatment of the probe SID 99300522 (CID 3392161), SID 96099781 (CID 3528206) and SID 99300541 (CID 3449329) as well as rapamycin and DMSO as controls (Figure 13B). In contrast to the CIT2-GFP expression in the wild-type background, the activity of the probe SID 99300522 (CID 3392161) and its analogs on CIT2-GFP expression is completely lost in Rtg3p mutant, as it is with rapamycin, suggesting that the activity of the chemotype is dependent on the Rtg3p protein and may function upstream of Rtg3p. Second, we measured CIT2-LacZ expression in both the wild-type background and the Rtg2p knockout background after treatment with the same set of compounds. The probe SID 99300522 (CID 3392161) and its analogs did not increase LacZ activity significantly in the Rtg2p mutant as rapamycin does (Figure 13C). These data suggest that the activity of the chemotype is dependent on the Rtg2p protein and may function upstream of Rtg2p. We also measured CIT2-LacZ expression in lst8-5 and lst8-1 mutants after treatment with the same set of compounds. None of these compounds could further increase LacZ expression in either lst8 mutants (data not shown), suggesting that the probe SID 99300522 (CID 3392161) and its analogs may function upstream of Lst8p. Taken together, this activity of the probe and its analogs on induction of CIT2 expression is dependent on RTG3 and RTG2 proteins, suggesting that the probe functions at the level of Rtg2p or upstream in the RTG pathway.

We have attempted to uncover the cellular targets of this chemotype by profiling their gene expression through the screening of yeast GFP clones. The probe SID 99300522 (CID 3392161), analog SID 96099781 (CID 3528206), rapamycin and DMSO were used to screen a set of 96 GFP clones (called RapaGFP clones) that were identified initially to be responsive to rapamycin from the yeast GFP collection (unpublished data). After the treatment of the GFP clones with the compounds for 3 hrs, the GFP signal of each clone was measured by flow cytometry. Compared to the GFP signal with the treatment of DMSO, the GFP clones treated with the compounds in which the GFP signal was increased to greater than 1.5-fold or decreased to 0.66-fold or less were claimed to be responsive. 53 GFP clones were confirmed to be responsive to rapamycin among which 41 clones were up-regulated and 12 were down-regulated (Figure 14). Note that 11 of the down-regulated clones encode ribosomal proteins, which is in agreement with the fact that rapamycin inhibits protein synthesis. The other 43 GFP clones did not respond to rapamycin or to any other compounds tested. In the presence of SID 96099781 (CID 3528206), 31 out of 41 rapamycin-up-regulated clones were up-regulated. Four of the rapamycin-down-regulated clones were down-regulated. Note that the rest of the 8 clones encoding ribosomal proteins also decreased ~20% by SID 96099781 (CID 3528206) (data not shown). This piece of data suggests that SID 96099781 (CID 3528206) exhibits a very similar pattern as rapamycin. This is consistent with the results from dose response confirmation and the secondary assays (Figure 7). Interestingly, the probe SID 99300522 (CID 3392161) just increased GFP expression in 6 clones and decreased GFP expression in ADE17 clone only (Figure 15). None of the clones encoding the ribosomal proteins were responsive to the probe SID 99300522 (CID 3392161) treatment, suggesting that the probe may not regulate the protein translation branch of TOR pathway. Among the 6 up-regulated clones, CIT2, DLD3 [40] and PYC1 [41, 42] are known to be regulated by the RTG pathway as well as nitrogen sources. PTR2 (Peptide Transport), BAT2 (Branched-chain Amino acid Transaminase) and DIP5 (DIcarboxylic amino acid Permease) play roles in maintaining amino acid homeostasis, suggesting that the probe SID 99300522 (CID 3392161) may regulate amino acid metabolism and/or affect the extracellular sensing of amino acid, which is controlled by the yeast plasma membrane SPS nutrient sensor. The SPS nutrient sensor has been reported to affect the RTG pathway upstream of Rtg2p [23, 43] via an unknown mechanism. Taken together with the observation that the probe SID 99300522 (CID 3392161) also acts upstream of Rtg2p, it will be very interesting to test if the probe targets the SPS pathway in the future.
3.2. Dose Response Curves for Probe ML231
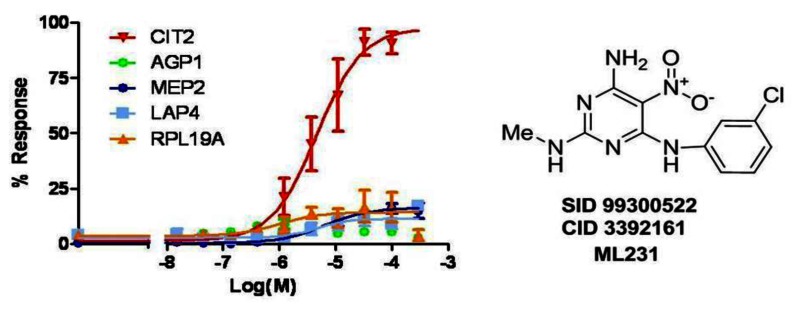
Figure 15Overlay of dose response curves for probe ML231 (SID 99300522, CID 3392161)
The mean percent of response of each GFP clone to the probe treatment in 6 independent experiments was used to fit by Prism 5.
3.3. Scaffold/Moiety Chemical Liabilities
The 2,4,6-triamino-5-nitropyrimidine scaffold and its derivatives have been easily handled in terms of stability to reaction conditions, exposure to acid or base, heating, and general manipulation. We have not observed decomposition nor have we experienced any chemical liability with these compounds. The structure does not contain moieties that are known generally to be reactive. Stability assessment was performed in 1× PBS buffer at pH 7.4 and room temperature. After 48 hours, it was determined that 89 percent of the parent probe compound remained, thus indicating reasonable stability under these conditions.
3.4. SAR Tables
Of the hits that were evaluated and validated, only one compound (SID 96099781, CID 3528206) resulted in an activity profile that altered GFP expression in all five GFP clones as seen with rapamycin. A chemistry effort was then undertaken to expand the underlying structure activity relationships associated with this scaffold (Figure 16). The preliminary SAR plan focused on four regions of the scaffold, predominately on the substitutions of the pyrimidine core. Those compounds that could be obtained commercially were purchased while unavailable analogs were synthesized in parallel. We synthesized 27 compounds and purchased 37 additional analogs that were purified and analyzed prior to assay. Interestingly, these compounds, all predicated on the validated hit, did not demonstrate an analogous effect on GFP expression as that seen with rapamycin and the hit itself. Instead, nearly all active analogs in this series exhibited pathway selectivity for induction of the CIT2-GFP expression. This finding, while unexpected for compounds so closely related to the hit structure, was rigorously validated and then supported with the identification of additional analogs in the series with analogous selectivity profiles.
Figure 16
Validated hit and SAR strategy.
The largest group of analogs that was studied resulted from systematic changes of the 3-fluorophenyl moiety of SID 96099781 (Table 2). Consistently, 4-halo or 4-alkoxy substituted phenyl rings in the R1 position resulted in loss of activity on all 5 clones (entries 2, 7, and 10–11). A similar story emerged for 2-substituted phenyl rings (entries 3 and 5). Some CIT2 inhibition registered for the 2-MeO-phenyl substituent (~4 μM, entry 8); however, the compound was not very effective, as a low response was associated with this result (33%).
Table 2
Summary of modifications to R1.
Installation of 3-substituted phenyl rings revealed CIT2 selective potency for 3-chloro-, 3-bromo- and 3-MeO-phenyl substituents, although low responses plagued the latter two examples (entries 1, 4 and 9, respectively). The 3-chlorophenyl moiety (entry 1) imparted a reasonable CIT2 potency of 3.8 μM, response (92%), and lack of activity on the other four clones. The 3-fluorophenyl analog (entry 6, SID 96099781) was the original validated hit with effects observed on all 5 GFP clones. As the data in section 3.1 indicated, SID 96099781 was the only analog in the pyrimidine series that inhibited wild-type cell growth but not the TORC1 bypass cell growth, suggesting it acts at the level of TORC1 or upstream as rapamycin does. This is in contrast to the remaining analogs which appear to act downstream of TORC1. This differential site of action can account for the observation that SID 96099781 does not fit within the SAR profile surrounding this set of compounds. Compounds in this series were also evaluated for their effect on cell growth. All compounds in the series but the validated hit (entry 6) resulted in good wild-type cell growth, indicating lack of cytotoxicity.
The effect of slightly increasing the steric bulk or replacing the hydrogen of the methylamine appendage was investigated (Table 3). Introduction of an ethyl substituent in place of the methyl group at R2 (entry 2) resulted in enhanced potency on CIT2, AGP1, MEP2 and RPL19A as compared to the probe (entry 1). No activity on LAP4 was observed, but the potency across the remaining clones amounted to pan inhibition, though the response levels on AGP1 and MEP2 were low. Installation of an additional methyl group on the amine (entry 3) resulted in complete loss of activity across all clones, indicating the possible importance of the hydrogen in this position or as a participant in an active tautomeric structure.
Table 3
SAR summary for modification at R2.
Attempts were made to modify the nitro group of the hit scaffold, as this particular functionality can contribute to poor solubility. One of the first structural amendments involved removal of the nitro group (entry 2, Table 4). In this case, the presence of the hydrogen was not a beneficial change, resulting in loss of activity on CIT2 as compared to the probe (entry 1) and suggesting that the electron withdrawing effects imparted by the nitro group might be important to activity. With this in mind, an electron-withdrawing nitrile group was introduced at the R3 position (entry 3) and an aryl ketone (entry 4) that was commercially available was also assessed. Unfortunately, these changes did not restore CIT2 activity, leading to an inactive profile across all five clones. These alterations represent a modest survey of changing the nitro group, and initial assessments indicate that the nitro group, a very polarizing functionality as compared to most complimentary replacements, is important to retaining CIT2 activity.
Table 4
SAR summary for modification of the nitro group at R3.
The importance of the aniline portion of the scaffold was studied by introducing small alkyl substituents in place of the (N-H) hydrogen atoms (Table 5). Replacement of one hydrogen with a methyl group or both hydrogen atoms with methyl groups (entries 2 and 3, Table 5, respectively) resulted in no activity on any of the 5 clones, thus stressing the importance of the hydrogen atoms in any of several scenarios of an active analog: (a) participants in hydrogen bonding and/or (b) participants in an active tautomeric structure and/or (c) intolerance of steric bulk in this binding region.
Table 5
SAR summary for modification of the R4 substituent.
3.5. Cellular Activity
The primary screen assay, TORC1 bypass cell growth assay and the chemical genetic assays in RTG mutants are all direct indication of cellular activity. The results of the primary screen assay and the chemical genetic assays indicate that the probe acts at the level of Rtg2p or upstream in the RTG pathway. The result from TORC1 bypass cell growth assay indicates that the probe is not toxic to the wild-type yeast cell growth at 60 μM. Note that the synthetic media used in the primary screen and the dose response analysis contains 0.015% pluronic F-68 that is required for the activity of rapamycin. But the probe showed the similar activity in the synthetic media without the addition of pluronic F-68, suggesting it is permeable to yeast cells.
3.6. Profiling Assays
The probe has been profiled against 50 kinases at a single concentration of 10 μM to assess promiscuity of the chemotype (Table 6). [44] Probe ML231 was dissolved in DMSO and tested at a final concentration of 10 μM. Prior to initiating a profiling campaign, the compound was evaluated for false positive against split-luciferase. Profiling was done in duplicate for ML231 against each kinase. The Percent Inhibition and Percent Activity Remaining were calculated using the following equation:
Table 6
Percent of activity remaining for various kinases when inhibited by ML231.
ALUControl
% Activity Remaining = 100 − % Inhibition
It is noteworthy that a PubChem search revealed that the probe ML231 (and analog SID 96099781) both are reported to inhibit mammalian GSK3β activity (AID 434954). This particular kinase was not offered as part of the profiling panel; however, the most potently inhibited kinase in this panel was GSK3a at 35.3%. Other kinases that were inhibited by the probe included CLK1 (28.3%), CLK2 (20.6%), AURKA (17.9%), RPS6KA1 (14.5%), STE (9.9%), SNARK (9.4%), and others less than 5%.
The team has also submitted the probe ML231 (SID 99300522 CID 3392161) to the NIH National Cancer Institute to elucidate the effect of the probe on the cancer cell line panel.
4. Discussion
There are five pieces of evidence showing that probe compound ML231 (SID 99300522, CID 3392161) is a RTG branch selective probe: 1) dose response data showed that it is a potent, selective and strong inducer of CIT2-GFP expression in this scaffold series. This indicates that the probe affects a subset of functions of TORC1 signaling, which is in agreement with the result from the TORC1 bypass cell growth assay where the probe candidate did not affect the cell growth of either wild-type or TORC1 bypass cell growth at 60 μM. 2) The screening of RapaGFP clones showed that probe ML231 (SID 99300522, CID 3392161) only changed GFP expression in 7 out of 53 rapamycin-responsive GFP clones, 3 of which are known to be regulated by the RTG pathway and nitrogen sources. This data further supports the notion that probe ML231 (SID 99300522, CID 3392161) executes a partial function of rapamycin and is more selective on the RTG pathway than its analog SID 96099781 (CID 3528206). 3) ML231 and its analogs inhibited Sch9 phosphorylation, the major substrate and downstream effector of the TORC1 pathway (Figure 11). This result indicates that this chemotype affects TORC1 activity. However, the RTG selective compounds (ML231, SID 99300541 and SID 99300549) could not completely inhibit TORC1 activity while the rapamycin mimic compound SID 96099781 could. This may be partially attributable to the selectivity. 4) The RTG3-GFP localization assay shows that probe compound ML231 (SID 99300522, CID 3392161) induces the nuclear localization of RTG3-GFP, indicating that it regulates CIT2 expression through activation of the RTG pathway. 5) Chemical genetic analysis further shows that the induction of CIT2-GFP expression by probe ML231 (SID 99300522, CID 3392161) is dependent on Rtg3p and Rtg2p proteins, suggesting it acts at the level of RTG2 or upstream in the RTG pathway.
SID 96099781 (CID 3528206) behaves more like rapamycin than other analogs in the dose response analysis, TORC1 bypass cell growth assay and RapaGFP clone screening assay. The analogs of this scaffold, with very minor modification, such as changing from a 3-fluorophenyl moiety (SID 96099781, CID 3528206) to a 3-chlorophenyl group (SID 99300522, CID 3392161) completely abolished the activity on the AGP1, MEP2, LAP4 and RPL19A clones. The TORC1 bypass cell growth assay suggests that SID 96099781 (CID 3528206) may act at the level of TOR or upstream whereas structurally similar compounds, including the probe compound ML231 (SID 99300522, CID 3392161) may act downstream of TOR (Figure 10). If we assume that these analogs have the same cellular target(s) on the basis of their similar molecular structure, how could they act both downstream and upstream of TOR? There could be some possibilities: 1) They act at the level of TOR or upstream, but some compounds have stronger effect on the activity of TOR, as does rapamycin whereas other compounds just affect the function of TORC1 complex partially, such that the probe affects the RTG pathway selectively. This hypothesis is supported by the observation that the probe compound ML231 (SID 99300522, CID 3392161) partially inhibits the Sch9p phosphorylation whereas SID 96099781 (CID 3528206) completely inhibits Sch9p phosphorylation. 2) The compounds indeed act both upstream and downstream of TORC1 by targeting the same cellular proteins, which functions both downstream and upstream of TORC1. Lst8p is such a candidate protein [9, 45–47]. Lst8p has multiple acting sites which can lead to bidirectional action in the RTG and TOR pathways. Lst8p regulates TOR activity as a component of both TORC1 and TORC2 complex, but also it regulates the activity and assembly of SPS system sensing external glutamate that acts upstream of Rtg2p in the RTG pathway (see Figure 13A). Lst8p can also act downstream of Rtg2p by an unknown mechanism. The chemical genetic assay showed that all the compounds act upstream of Rtg2p, suggesting that the compounds may target Lst8p that acts upstream of Rtg2p or acts as a component of the TOR complexes. If this is the case, these compounds may also affect TORC2 activity because Lst8 is also a component of TORC2 complex. However, the Ypk1/2 phosphorylation assay [35] for evaluation of TORC2 activity in yeast showed that SID 96099781 (CID 3528206) does not inhibit TORC2 activity. 3) The growth media may affect the response of these GFP clones to the probe and its analogs because TOR signaling senses the nutrient and adapts the cell metabolism to the growth condition. It will be worthwhile to test the compounds in rich YPD media as well as in the synthetic media with different sole nitrogen sources, such as proline, urea and histidine. In these media, the probe and the SAR series may have a similar pattern in altering GFP expression in the GFP clones. The future planned studies aimed at the mechanism of action will aid in elucidating these possibilities and provide new clues on the integration of RTG and TOR signaling.
Lastly, the nitropyrimidine series features structural elements that impact solubility, as several compounds described here have been shown to possess diminished solubility in aqueous media (see section 2.2 C). Replacement of the nitro group was investigated to address the physiochemical properties and any long-term, post-project interest in using the probe as an in vivo tool. Initial attempts down this road led to inactive compounds; however, the team is following up on analogs containing amide or sulfonamide salt moieties in place of the nitro group. The probe is reported here, however, a first-in-class tool and represents a significant milestone for the selective exploration of the TORC1 pathway.
4.1. Comparison to Existing Art and How the New Probe is an Improvement
To our best knowledge, this is the first report of the RTG pathway selective probe. It will allow probing of the RTG branch without affecting other branches regulated by TORC1 signaling.
4.2. Mechanism of Action Studies
We have attempted to reveal its mechanism of action by searching for genes whose expression are changed upon the treatment of probe compound by screening 96 RapaGFP clones and microarray analysis.
We have performed two experiments to search for genes whose mRNA/protein expression is altered with the treatment of the probe. First, we screened 96 RapaGFP clones (see Figure 14) and identified not only the GFP clones regulated by the RTG pathway, as well as GFP clones encoding the genes involved in amino acid homeostasis, such as DIP5, BAT2 and PTR2 clones. These genes are up-regulated by the yeast membrane SPS (Ssy1-Ptr3-Ssy5) nutrient sensor for extracellular amino acids [48]. This suggests that the probe ML231 (SID 99300522, CID 3392161) may affect the SPS nutrient sensing pathway. Note that RTG pathway is regulated by glutamine, an amino acid that is also sensed by the SPS pathway (Figure 13A). The three RTG- regulated GFP clones (CIT2, DLD3 and PYC1) responsive to the probe may also be indirectly regulated by the SPS pathway. A key effector of the SPS pathway, Stp1p, is demonstrated to be regulated by the Tap42-Sit4p phosphatases complex, which is a well-known target of the TORC1 complex [49]. This finding suggests the connection between the TORC1 and the SPS signaling pathways [49]. Taken together, the potential cellular targets of the probe ML231 (SID 99300522, CID 3392161) may play roles in all the RTG, SPS and TORC1 pathways. It will be interesting to test whether the probe affects the Tap42-Sit4p phosphatases and regulates Stp1p. The screening assays for RapaGFP clones (Figure 14) allows us to evaluate several compounds with a limited amount (less than 1mg) at current stage, but it is a biased screen where the clones not responsive to rapamycin are missing. We plan to screen the whole GFP collection with the probe ML231 (SID 99300522, CID 3392161) in the future. This would generate more comprehensive information for the probe. Second, we have performed microarray analysis on the probe ML231 (SID 99300522, CID 3392161), rapamycin, SID 96099781 (CID 3528206) and 2 other CIT2 selective compounds. The data is being analyzed. The microarray data may provide very useful information on the possible cellular targets of the probe with the comprehensive comparison of the gene list of the probe and its analogs as well as rapamycin. We are going to do cluster/gene function analysis and promoter/transcription factor binding analysis to determine the possible biological pathway(s) that the probe candidate acts on. The data from the GFP collection screen and the microarray analysis would shed light on the cellular targets.
We also plan to test the probe in extended secondary assays to determine its mechanism of action (see details in section 4.3).
4.3. Planned Future Studies
In addition to the large-scale analysis of gene expression experiments, the probe ML231 will be further tested in extended secondary assays for revealing the mechanism of action and chemistry will be working to improve solubility.
- Screen the whole yeast GFP collection with probe ML231, SID 96099781 (CID 3528206), rapamycin and DMSO. This screen will be done in 96-well plates at UNMCMD. The data will be analyzed as previously [50].
- Analyze microarray data and confirm gene expression by RT-PCR. The microarray data will be analyzed by principle component analysis and two-dimensional hierarchical clustering. This two unsupervised data analysis will suggest relationship among the probe, SID 96099781 (CID 3528206), rapamycin and the active SAR analogs. The genes shared by these compounds will be used for pathway analysis with Genego systems to reveal the signaling pathways that may be regulated by the probe. The subsequent genetic and biochemical assays will be performed accordingly.
- Test probe ML231 and active SAR compounds in the rich YPD media as well as in the synthetic media with different sole nitrogen sources, such as glutamate, glutamine, proline, urea and histidine. This experiment will suggest whether the probe candidate affects the regulation of glutamine and ammonia in the RTG pathway, which would aid in understanding the integration of the RTG, NCR and TORC1 pathways.
- Extend research into mammalian cells. The active compounds, including the probe ML 231 and compounds SID 96099781, SID 99300541 and SID 99300549 as well as two inactive compounds SID 99300529 and SID 99300530 are being profiled in human gene expression chips in collaboration with the Broad Institute. Extended secondary assays in mammalian cells may be employed accordingly.
- Chemistry will be done to improve the solubility and drug-likeness properties of the probe. Selective priorities include the identification of an isostere for the nitro group, the introduction of solubilizing groups on the R1 arene, more extensive revision of this component of the scaffold (aliphatic solubilizing groups) and modification of the central pyrimidine core.
5. References
- 1.
- De Virgilio C, Loewith R. The TOR signalling network from yeast to man. Int J Biochem Cell Biol. 2006;38(9):1476–81. [PubMed: 16647875]
- 2.
- Guertin DA, Sabatini DM. The pharmacology of mTOR inhibition. Sci Signal. 2009;2(67):pe24. [PubMed: 19383975]
- 3.
- Butow RA, Avadhani NG. Mitochondrial signaling: the retrograde response. Mol Cell. 2004;14(1):1–15. [PubMed: 15068799]
- 4.
- Oldham S. Obesity and nutrient sensing TOR pathway in flies and vertebrates: Functional conservation of genetic mechanisms. Trends Endocrinol Metab. 2011;22(2):45–52. [PMC free article: PMC3035994] [PubMed: 21216618]
- 5.
- De Virgilio C, Loewith R. Cell growth control: little eukaryotes make big contributions. Oncogene. 2006;25(48):6392–415. [PubMed: 17041625]
- 6.
- Sekito T, Thornton J, Butow RA. Mitochondria-to-nuclear signaling is regulated by the subcellular localization of the transcription factors Rtg1p and Rtg3p. Mol Biol Cell. 2000;11(6):2103–15. [PMC free article: PMC14906] [PubMed: 10848632]
- 7.
- Giannattasio S, et al. Retrograde response to mitochondrial dysfunction is separable from TOR1/2 regulation of retrograde gene expression. J Biol Chem. 2005;280(52):42528–35. [PubMed: 16253991]
- 8.
- Sekito T, et al. RTG-dependent mitochondria-to-nucleus signaling is regulated by MKS1 and is linked to formation of yeast prion [URE3] Mol Biol Cell. 2002;13(3):795–804. [PMC free article: PMC99599] [PubMed: 11907262]
- 9.
- Liu Z, et al. RTG-dependent mitochondria to nucleus signaling is negatively regulated by the seven WD-repeat protein Lst8p. EMBO J. 2001;20(24):7209–19. [PMC free article: PMC125777] [PubMed: 11742997]
- 10.
- Crespo JL, et al. The GATA transcription factors GLN3 and GAT1 link TOR to salt stress in Saccharomyces cerevisiae. J Biol Chem. 2001;276(37):34441–4. [PubMed: 11457832]
- 11.
- Bertram PG, et al. Tripartite regulation of Gln3p by TOR, Ure2p, and phosphatases. J Biol Chem. 2000;275(46):35727–33. [PubMed: 10940301]
- 12.
- Beck T, Hall MN. The TOR signalling pathway controls nuclear localization of nutrient-regulated transcription factors. Nature. 1999;402(6762):689–92. [PubMed: 10604478]
- 13.
- Xiao L, Grove A. Coordination of Ribosomal Protein and Ribosomal RNA Gene Expression in Response to TOR Signaling. Curr Genomics. 2009;10(3):198–205. [PMC free article: PMC2705853] [PubMed: 19881913]
- 14.
- Powers T, Walter P. Regulation of ribosome biogenesis by the rapamycin-sensitive TOR-signaling pathway in Saccharomyces cerevisiae. Mol Biol Cell. 1999;10(4):987–1000. [PMC free article: PMC25225] [PubMed: 10198052]
- 15.
- Zoncu R, Efeyan A, Sabatini DM. mTOR: from growth signal integration to cancer, diabetes and ageing. Nat Rev Mol Cell Biol. 2011;12(1):21–35. [PMC free article: PMC3390257] [PubMed: 21157483]
- 16.
- Ciuffreda L, et al. The mTOR pathway: a new target in cancer therapy. Curr Cancer Drug Targets. 2010;10(5):484–95. [PubMed: 20384580]
- 17.
- Hall MN. mTOR-what does it do? Transplant Proc. 2008;40(10 Suppl):S5–8. [PubMed: 19100909]
- 18.
- Guertin DA, Sabatini DM. Defining the role of mTOR in cancer. Cancer Cell. 2007;12(1):9–22. [PubMed: 17613433]
- 19.
- Guertin DA, Sabatini DM. An expanding role for mTOR in cancer. Trends Mol Med. 2005;11(8):353–61. [PubMed: 16002336]
- 20.
- Liu Q, et al. mTOR Mediated Anti-Cancer Drug Discovery. Drug Discov Today Ther Strateg. 2009;6(2):47–55. [PMC free article: PMC2901551] [PubMed: 20622997]
- 21.
- Thoreen CC, et al. An ATP-competitive mammalian target of rapamycin inhibitor reveals rapamycin-resistant functions of mTORC1. J Biol Chem. 2009;284(12):8023–32. [PMC free article: PMC2658096] [PubMed: 19150980]
- 22.
- Feldman ME, et al. Active-site inhibitors of mTOR target rapamycin-resistant outputs of mTORC1 and mTORC2. PLoS Biol. 2009;7(2):e38. [PMC free article: PMC2637922] [PubMed: 19209957]
- 23.
- Liu Z, Butow RA. Mitochondrial retrograde signaling. Annu Rev Genet. 2006;40:159–85. [PubMed: 16771627]
- 24.
- Rothermel BA, Thornton JL, Butow RA. Rtg3p, a basic helix-loop-helix/leucine zipper protein that functions in mitochondrial-induced changes in gene expression, contains independent activation domains. J Biol Chem. 1997;272(32):19801–7. [PubMed: 9242640]
- 25.
- Jia Y, et al. A basic helix-loop-helix-leucine zipper transcription complex in yeast functions in a signaling pathway from mitochondria to the nucleus. Mol Cell Biol. 1997;17(3):1110–7. [PMC free article: PMC231836] [PubMed: 9032238]
- 26.
- Rothermel BA, et al. Transactivation by Rtg1p, a basic helix-loop-helix protein that functions in communication between mitochondria and the nucleus in yeast. J Biol Chem. 1995;270(49):29476–82. [PubMed: 7493987]
- 27.
- Ferreira JR Junior. Interaction between Rtg2p and Mks1p in the regulation of the RTG pathway of Saccharomyces cerevisiae. Gene. 2005;354:2–8. [PubMed: 15967597]
- 28.
- Liu Z, et al. Retrograde signaling is regulated by the dynamic interaction between Rtg2p and Mks1p. Mol Cell. 2003;12(2):401–11. [PubMed: 14536080]
- 29.
- Crespo JL, et al. The TOR-controlled transcription activators GLN3, RTG1, and RTG3 are regulated in response to intracellular levels of glutamine. Proc Natl Acad Sci U S A. 2002;99(10):6784–9. [PMC free article: PMC124480] [PubMed: 11997479]
- 30.
- Tate JJ, Cooper TG. Tor1/2 regulation of retrograde gene expression in Saccharomyces cerevisiae derives indirectly as a consequence of alterations in ammonia metabolism. J Biol Chem. 2003;278(38):36924–33. [PMC free article: PMC4384470] [PubMed: 12851403]
- 31.
- Urban J, et al. Sch9 is a major target of TORC1 in Saccharomyces cerevisiae. Mol Cell. 2007;26(5):663–74. [PubMed: 17560372]
- 32.
- Edwards BS, et al. High-content screening: flow cytometry analysis. Methods Mol Biol. 2009;486:151–65. [PMC free article: PMC4476789] [PubMed: 19347622]
- 33.
- Young SM, et al. High-throughput screening with HyperCyt flow cytometry to detect small molecule formylpeptide receptor ligands. J Biomol Screen. 2005;10(4):374–82. [PubMed: 15964939]
- 34.
- Binda M, et al. The Vam6 GEF controls TORC1 by activating the EGO complex. Mol Cell. 2009;35(5):563–73. [PubMed: 19748353]
- 35.
- Kamada Y, et al. Tor2 directly phosphorylates the AGC kinase Ypk2 to regulate actin polarization. Mol Cell Biol. 2005;25(16):7239–48. [PMC free article: PMC1190227] [PubMed: 16055732]
- 36.
- Burke D, Dawson DS, Steams T. Methods in Yeast Genetics. 2000 Edition. 2000. pp. 123–127. (A Cold Spring Harbor Laboratory Course Manual).
- 37.
- Solubility and stability data assessment was outsourced to and data was collected by the Sanford-Burnham Center, under the direction of Dr Layton Smith.
- 38.
- Goodwin, J. Poor Aqueous Solubility and Compound Aggregation: Detection, Differences, and Impact on In-Vitro Screens. BD Gentest Solubility Scanner, BD Biosciences Company, Woburn, MA 01801.
- 39.
- Crespi, et al. Aqueous Solubility by Flow Cytometry II: New Prototypes Optimized for Drug Solubility Testing. Poster Presentation. BD Gentest, A BD Biosciences Company, Woburn, MA 01801.
- 40.
- Tate JJ, et al. Mks1p is required for negative regulation of retrograde gene expression in Saccharomyces cerevisiae but does not affect nitrogen catabolite repression-sensitive gene expression. J Biol Chem. 2002;277(23):20477–82. [PMC free article: PMC4384460] [PubMed: 11923302]
- 41.
- Huet C, et al. Regulation of pyc1 encoding pyruvate carboxylase isozyme I by nitrogen sources in Saccharomyces cerevisiae. Eur J Biochem. 2000;267(23):6817–23. [PubMed: 11082192]
- 42.
- Menendez J, Gancedo C. Regulatory regions in the promoters of the Saccharomyces cerevisiae PYC1 and PYC2 genes encoding isoenzymes of pyruvate carboxylase. FEMS Microbiol Lett. 1998;164(2):345–52. [PubMed: 9682484]
- 43.
- Liu Z, et al. Activation of the SPS amino acid-sensing pathway in Saccharomyces cerevisiae correlates with the phosphorylation state of a sensor component, Ptr3. Mol Cell Biol. 2008;28(2):551–63. [PMC free article: PMC2223413] [PubMed: 17984223]
- 44.
- Jester BW, et al. A coiled-coil enabled split-luciferase three-hybrid system: applied toward profiling inhibitors of protein kinases. J Am Chem Soc. 2010;132(33):11727–35. [PMC free article: PMC2966823] [PubMed: 20669947]
- 45.
- Diaz-Troya S, Florencio FJ, Crespo JL. Target of rapamycin and LST8 proteins associate with membranes from the endoplasmic reticulum in the unicellular green alga Chlamydomonas reinhardtii. Eukaryot Cell. 2008;7(2):212–22. [PMC free article: PMC2238169] [PubMed: 18039939]
- 46.
- Chen EJ, Kaiser CA. LST8 negatively regulates amino acid biosynthesis as a component of the TOR pathway. J Cell Biol. 2003;161(2):333–47. [PMC free article: PMC2172900] [PubMed: 12719473]
- 47.
- Loewith R, et al. Two TOR complexes, only one of which is rapamycin sensitive, have distinct roles in cell growth control. Mol Cell. 2002;10(3):457–68. [PubMed: 12408816]
- 48.
- Forsberg H, et al. The role of the yeast plasma membrane SPS nutrient sensor in the metabolic response to extracellular amino acids. Mol Microbiol. 2001;42(1):215–28. [PubMed: 11679080]
- 49.
- Shin CS, Kim SY, Huh WK. TORC1 controls degradation of the transcription factor Stp1, a key effector of the SPS amino-acid-sensing pathway in Saccharomyces cerevisiae. J Cell Sci. 2009;122(Pt 12):2089–99. [PubMed: 19494127]
- 50.
- Davidson GS, et al. The proteomics of quiescent and non-quiescent cell differentiation in yeast stationary-phase cultures. Mol Biol Cell. 2011 [PMC free article: PMC3069023] [PubMed: 21289090]
APPENDIX A. NMR Data and LCMS Data for Probe SID 99300522 (CID 3392161)
Figure A1. Proton data for SID 99300522 (CID 3392161)
Figure A2. Carbon data for SID 99300522 (CID 3392161)
Figure A3. LCMS purity data at 214 nm for SID 99300522 (CID 3392161)
APPENDIX B. Supporting Information for Analogs of Probe SID 99300522 (CID 3392161)

N4-(3-chlorophenyl)-N2-ethyl-5-nitropyrimidine-2,4,6-triamine: Prepared in a similar manner as described for the probe. Yellow solid, 36% yield. 1H-NMR (400 MHz, DMSO-d6, mixture of 2 tautomers in 1:1 ratio) δ 11.35 (s, 1H), 11.25 (s, 1H), 8.65 (s, 1H), 8.48 (s, 1H), 8.27 (s, 1H), 8.17 (d, J = 2.0 Hz, 1H), 7.98-7.96 (m, 2H), 7.81 (t, J = 6.0 Hz, 1H), 7.71 (t, J = 6.0 Hz, 1H), 7.66 (d, J = 8.4 Hz, 1H), 7.50 (d, J = 8.0 Hz, 1H), 7.40-7.32 (m, 2H), 7.21-7.14 (m, 2H), 3.36-3.25 (m, 4H), 1.13 (t, J = 7.2 Hz, 3H), 1.12 (t, J = 7.2 Hz, 3H). 13C NMR (125 MHz, DMSO-d6, mixture of 2 tautomers in 1:1 ratio) δ 159.9, 159.5, 159.0, 158.8, 155.4, 139.7, 139.4, 133.0, 132.8, 130.11, 130.08, 129.90, 123.8, 123.7, 122.0, 121.8, 120.80, 120.7, 108.02, 107.97, 35.7, 35.4, 14.9, 14.8. LCMS retention time 3.22 min, LCMS purity = 95%. HRMS m/z calculated for C12H13ClN6O2 ([M+H]+): 309.0861, found 309.0882.
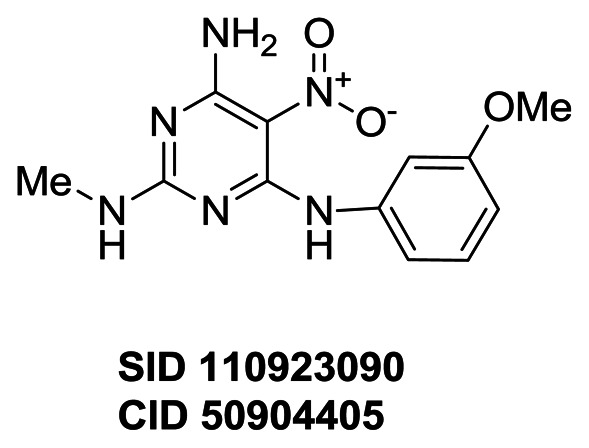
N4-(3-methoxyphenyl)-N2-methyl-5-nitropyrimidine-2,4,6-triamine: Prepared in a similar manner as described for the probe. Yellow solid, 30% yield. 1H-NMR (400 MHz, DMSO-d6, mixture of 2 tautomers in 1:1 ratio) δ 11.44 (s, 1H), 11.22 (s, 1H), 8.69 (s, 1H), 8.49 (s, 1H), 8.26 (s, 1H), 7.94 (s, 1H), 7.64-7.60 (m, 2H), 7.53 (d, J = 4.8 Hz, 1H), 7.44 (m, 1H), 7.28-7.18 (m, 4H), 6.73-6.68 (m, 2H), 3.77 (s, 3H), 3.76 (s, 3H), 2.83 (d, J = 4.8 Hz, 3H), 2.81 (d, J = 4.8 Hz, 3H). 13C NMR (125 MHz, DMSO-d6, mixture of 2 tautomers in 1:1 ratio) δ 160.1, 159.9, 159.60, 159.56, 159.52, 155.8, 155.4, 139.4, 139.3, 129.5, 114.6, 114.4, 110.3, 109.9, 108.11, 108.09, 108.03, 107.66, 55.23, 28.2, 27.9. LCMS retention time 2.83 min. LCMS purity = 89% purity. HRMS m/z calculated for C12H15N6O3 ([M+H]+): 291.1200, found 291.1207.

N4-(3-bromophenyl)-N2-methyl-5-nitropyrimidine-2,4,6-triamine: Prepared in a similar manner as described for the probe. Yellow solid, 54% yield. 1H-NMR (400 MHz, DMSO-d6, mixture of 2 tautomers in 1:1 ratio) δ 11.3 (s, 1H), 11.1 (s, 1H), 8.67 (s, 1H), 8.48 (s, 1H), 8.33 (s, 1H), 8.28 (s, 1H), 8.05 (m, 1H), 7.97 (s, 1H), 7.71-7.67 (m, 2H), 7.61-7.56 (m, 2H), 7.33-7.27 (m, 4H), 2.83-2.81 (m, 6H). 13C NMR (125 MHz, DMSO-d6, mixture of 2 tautomers in 1:1 ratio) δ 165.6, 165.0, 162.0, 161.9, 161.6, 161.2, 141.4, 141.3, 132.6, 132.5, 129.76, 129.72, 122.0, 121.9, 120.9, 120.8, 119.8, 119.6, 117.2, 117.1, 27.7. LCMS retention time 3.119 min. LCMS purity = 90%. HRMS m/z calculated for C11H11BrN6O2 ([M+H]+): 339.0200, found 339.0211.
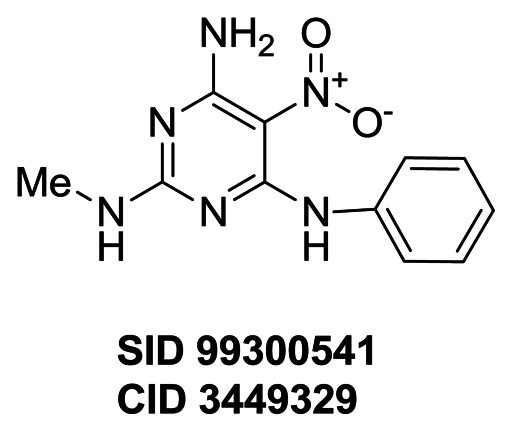
N4-(phenyl)-N2-methyl-5-nitropyrimidine-2,4,6-triamine: Prepared in a similar manner as described for the probe. Yellow solid, 47% yield. 1H-NMR (400 MHz, DMSO-d6, mixture of 2 tautomers in 1:1 ratio) δ 11.39 (s, 1H), 11.23 (s, 1H), 8.71 (s, 1H), 8.50 (s, 1H), 8.29 (s, 1H), 7.96 (s, 1H), 7.80-7.75 (m, 4H), 7.65 (m, 1H), 7.52 (m, 1H), 7.41-7.33 (m, 4H), 7.17-7.11 (m, 2H), 2.82 (d, J = 1.5 Hz, 3H), 2.81 (d, J = 1.4 Hz, 3H). 13C NMR (125 MHz, DMSO-d6, mixture of 2 tautomers in 1:1 ratio) δ 160.1, 160.0, 159.5, 159.5, 155.8, 155.3, 138.3, 138.0, 128.74, 128.70, 124.4, 124.2, 122.42, 122.36, 108.0, 28.0, 27.8. LCMS retention time 2.835 min. LCMS purity = 100%. HRMS m/z calculated for C11H13N6O2 ([M+H]+): 261.1095, found 261.1110.
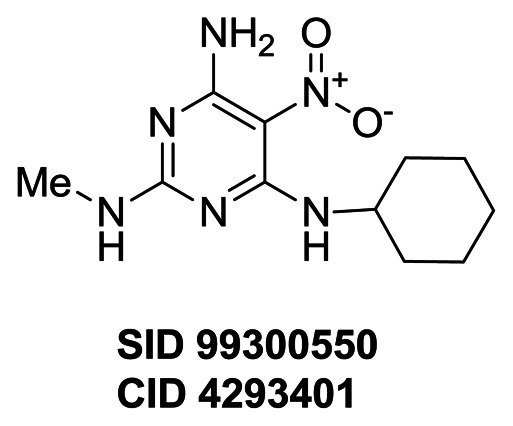
N4-cyclohexyl-N2-methyl-5-nitropyrimidine-2,4,6-triamine: Prepared in a similar manner as described for the probe. Yellow solid, 53% yield. 1H-NMR (400 MHz, DMSO-d6, mixture of 2 tautomers in 1:1 ratio) δ 9.31 (d, J = 7.2 Hz, 1H), 9.20 (d, J = 7.9 Hz, 1H), 8.63 (s, 1H), 8.43 (s, 1H), 8.10 (s, 1H), 7.78 (s, 1H), 7.34 (m, 1H), 7.27 (m, 1H), 4.08-4.02 (m, 2H), 2.80 (d, J = 4.8 Hz, 3H), 2.78 (d, J = 4.8 Hz, 3H), 1.96-1.87 (m, 4H), 1.70-1.65 (m, 4H), 1.61-1.54 (m, 2H), 1.39-1.20 (m, 10H). 13C NMR (125 MHz, DMSO-d6, mixture of 2 tautomers in 1:1 ratio) δ160.10, 160.05, 159.9, 159.5, 156.7, 156.2, 107.77, 107.74, 49.2, 48.4, 32.0, 31.7, 27.8, 27.6, 25.2, 25.1, 24.34, 24.26. LCMS retention time 3.11 min. LCMS purity = 99%. HRMS m/z calculated for C11H19N6O2 ([M+H]+): 267.1564, found 267.1584.
- PMCPubMed Central citations
- PubChem BioAssay for Chemical ProbePubChem BioAssay records reporting screening data for the development of the chemical probe(s) described in this book chapter
- PubChem SubstanceRelated PubChem Substances
- PubMedLinks to PubMed
- Divergent branches of mitochondrial signaling regulate specific genes and the viability of specialized cell types of differentiated yeast colonies.[Oncotarget. 2016]Divergent branches of mitochondrial signaling regulate specific genes and the viability of specialized cell types of differentiated yeast colonies.Podholová K, Plocek V, Rešetárová S, Kučerová H, Hlaváček O, Váchová L, Palková Z. Oncotarget. 2016 Mar 29; 7(13):15299-314.
- Accounting for strain-specific differences during RTG target gene regulation in Saccharomyces cerevisiae.[FEMS Yeast Res. 2006]Accounting for strain-specific differences during RTG target gene regulation in Saccharomyces cerevisiae.Dilova I, Powers T. FEMS Yeast Res. 2006 Jan; 6(1):112-9.
- Interaction between Rtg2p and Mks1p in the regulation of the RTG pathway of Saccharomyces cerevisiae.[Gene. 2005]Interaction between Rtg2p and Mks1p in the regulation of the RTG pathway of Saccharomyces cerevisiae.Ferreira Júnior JR, Spírek M, Liu Z, Butow RA. Gene. 2005 Jul 18; 354:2-8.
- Review Molecular mechanisms linking the evolutionary conserved TORC1-Sch9 nutrient signalling branch to lifespan regulation in Saccharomyces cerevisiae.[FEMS Yeast Res. 2014]Review Molecular mechanisms linking the evolutionary conserved TORC1-Sch9 nutrient signalling branch to lifespan regulation in Saccharomyces cerevisiae.Swinnen E, Ghillebert R, Wilms T, Winderickx J. FEMS Yeast Res. 2014 Feb; 14(1):17-32. Epub 2013 Oct 11.
- Review Insulin and amino-acid regulation of mTOR signaling and kinase activity through the Rheb GTPase.[Oncogene. 2006]Review Insulin and amino-acid regulation of mTOR signaling and kinase activity through the Rheb GTPase.Avruch J, Hara K, Lin Y, Liu M, Long X, Ortiz-Vega S, Yonezawa K. Oncogene. 2006 Oct 16; 25(48):6361-72.
- Profiling a Selective Probe for RTG Branch of Yeast TORC1 Signaling Pathway - Pr...Profiling a Selective Probe for RTG Branch of Yeast TORC1 Signaling Pathway - Probe Reports from the NIH Molecular Libraries Program
- Small Molecules Targeting the Mitochondrial Permeability Transition - Probe Repo...Small Molecules Targeting the Mitochondrial Permeability Transition - Probe Reports from the NIH Molecular Libraries Program
- Year 6 Reports - Probe Reports from the NIH Molecular Libraries ProgramYear 6 Reports - Probe Reports from the NIH Molecular Libraries Program
- Mrgprs as Itch Receptors - ItchMrgprs as Itch Receptors - Itch
- Sensitization of Itch Signaling - ItchSensitization of Itch Signaling - Itch
Your browsing activity is empty.
Activity recording is turned off.
See more...