Introduction
Deoxyribonucleic acid testing
Over the years there has been growing epidemiological evidence that women with a family history of breast cancer are at an increased risk of developing the disease. One of the early large studies investigating familial breast cancer risk (the Cancer and Steroid Hormone case–control study) showed that the RR of breast cancer was 2.1 in females with a first-degree relative affected by breast cancer.90 In addition, the study predicted that the underlying genetic susceptibility was due to one or more, rare, highly penetrant autosomal dominant genes. The Cancer and Steroid Hormone study provided epidemiological evidence that familial breast cancers develop at a relatively younger age, in comparison with non-familial breast cancers, there are more cases of bilateral breast cancer in familial clusters, and, in familial clusters, cases of ovarian cancer are often seen in relatives of women with breast cancer.90 In addition, there was evidence that there was an association between male breast cancer and familial risk of breast cancer, with female relatives of affected males at a two- to threefold increased risk compared with the general population risk.91 The increased risk of breast cancer in relatives of probands affected by breast cancer potentially could be attributed to shared environmental and/or genetic factors. However, evidence from twin studies indicates that the majority of the excess familial risk is due to an inherited predisposition. One study estimated that individuals who have a monozygotic twin who has had a diagnosis of breast cancer have a lifetime breast cancer risk of 33%. Another twin study showed that 27% of breast cancer was attributable to inherited factors,44 demonstrating that single high-risk dominant genes which were estimated to cause around 4–5% of breast cancer could account for only a fraction of the familial component.
Genes increasing breast cancer susceptibility
The epidemiological evidence for familial predisposition to breast cancer led to extensive searches for genes which underlie this susceptibility. Three classes of breast cancer susceptibility genes have been identified so far from these studies: high-, moderate- and low-penetrance genes, according to the level of breast cancer risk they confer and the prevalence of disease-causing variants in the population. The level of penetrance describes the likelihood that an individual who carries a mutation in a gene or a particular genetic variant will develop breast cancer as a result of the presence of that mutation/variant. Mutations in high-penetrance genes such as BRCA1 and BRCA2 confer around a 10- to 20-fold increased risk of breast cancer over that of non-mutation carriers (approximating to a 40–80% lifetime risk). The group of genes described as moderate penetrance confer an approximately two- to three fold increased risk (equating to a 20–36% lifetime risk). The loci described here of low penetrance confer a RR of less than 1.3-fold. It is possible that other breast cancer susceptibility genes exist which may confer RR of breast cancer which do not comply with these descriptions. The proportion of familial component of breast cancer identified in 2008, when we applied for funding for the National Institute for Health Research (NIHR) programme grant, and that currently identified (2014) are shown in Figures 7 and 8.92 BRCA1 and BRCA2 account for a large proportion of high-risk predisposition.

High-penetrance breast cancer susceptibility genes
The identification of pathogenic mutations in BRCA1 and BRCA2 in the last decade of the twentieth century was a major advance in the understanding of breast cancer susceptibility. Mutations in BRCA1 and BRCA2 are relatively rare, with a combined frequency of around 0.2% in outbred populations.92 The associated phenotype is inherited in an autosomal dominant manner. At the cellular level, however, they act as recessive genes. Breast and ovarian cancer cells are homozygous for mutations in these genes owing to somatic loss of the wild-type allele.93,94 Mutation carriers have a 10- to 20-fold increased risk of breast cancer and are at an increased risk of ovarian and other cancers.95,96 Pathogenic mutations in BRCA1 and BRCA2 account for approximately 16% of familial breast cancer.27,92–95
BRCA1
In 1990, genetic linkage analysis of families with multiple cases of early-onset breast cancer led to the localisation of this, the first breast cancer susceptibility gene, to chromosome 17q12–q21.97 Following this, an international collaborative study coordinated by the BCLC confirmed linkage to chromosome 17q, and BRCA1 was cloned in 1994.47
BRCA2
Following evidence from a study which showed that only 45% of families with multiple cases of breast cancer were linked to the BRCA1 locus, it became clear that BRCA1 was not the only breast cancer susceptibility gene.98 As a result of this, the presence of at least one further breast cancer susceptibility gene was confirmed by the absence of linkage to BRCA1 of families with early-onset female breast cancers and at least one case of male breast cancer.21 A genome-wide linkage search was performed using families which included male breast cancer cases and multiple-case families which were not linked to BRCA1. This led to the localisation of BRCA2 to chromosome 13q12–q13 in 199499 and the cloning of the BRCA2 gene the following year.48,100
TP53 and other high-penetrance genes
TP53 is a high-penetrance gene, mutations in which cause Li–Fraumeni syndrome.49,101 Patients with germline mutations in TP53 may have a family history of a number of cancer types including leukaemia, soft tissue sarcomas, brain tumours and osteosarcomas. Female TP53 mutation carriers have an 18-fold RR of being diagnosed with breast cancer before the age of 45 years, compared with the general population, and > 50% of TP53 mutation carriers are diagnosed with cancer before the age of 30 years.102 TP53 germline mutations are, however, considerably rarer than BRCA1 and BRCA2103 mutations.
There are three other genes also thought to confer high risks of breast cancer: mutations in PTEN (phosphatase and tensin homolog) cause Cowden disease,46 mutations in LKB1/STK11 (serine/threonine kinase 11) cause Peutz–Jeghers syndrome104 and mutations in CDH1 (cadherin 1, type 1) cause hereditary diffuse gastric cancer.105 The precise risks associated with these gene mutations are not known.
The hunt for other high-penetrance breast cancer genes
It is likely that all of these high-penetrance genes together account for no more than about 20% of the familial risk of breast cancer (see Figure 7); therefore, genome-wide linkage analyses have been performed on large numbers of families affected by breast cancer without a BRCA1 or BRCA2 mutation, with the aim of identifying further high-penetrance breast cancer susceptibility genes. Although no such genes have yet been identified through these studies, their existence cannot be excluded.106 If other high-penetrance genes do exist, only a small number of breast cancer families are likely to be due to mutations in these genes. In 2001, Antoniou et al.107 performed a large population-based study which suggested that a number of common, moderate- to low-penetrance genes with additive effects could account for familial cases not caused by BRCA1 or BRCA2. Subsequently, rare moderate penetrance and common low-penetrance breast cancer susceptibility alleles were identified.
Breast cancer susceptibility genes with moderate penetrance
Text in this section has been reused with permission from Evans DG. Genetic Predisposition and Breast Screening. In Benson JR, Gui G, Tuttle TM, editors. Early BreastCancer: From Screening to Multidisciplinary Management. 3rd edn. CRC Press; 2013. pp. 17–27.108
In order to explain the 80% of familial breast cancer risk which is not attributable to the high-risk breast cancer genes discussed previously, candidate genes have been investigated through large case–control studies. These genes were selected for mutational analysis because the proteins they encode have been shown to be involved in the same biological pathways as BRCA1 and BRCA2. Such studies have yielded at least four genes which each confer an approximately twofold risk of breast cancer in mutation carriers.
CHEK2
The first rare moderate-penetrance breast cancer susceptibility gene to be identified was CHEK2 (checkpoint kinase 2). This gene encodes a cell cycle checkpoint protein kinase that phosphorylates p53 and BRCA1 and is involved in DNA repair.109,110 It was demonstrated that CHEK2*1100delC, a frameshift mutation leading to truncated protein which affects its kinase activity, was present in 1.1% (18/1620) of healthy individuals but was present in 5.5% (55/1071) of familial breast cancer cases (p = 0.00000003). The RR of breast cancer in carriers of the CHEK2*1100delC allele was estimated to be 2.2-fold.110
ATM
This was the second moderate-penetrance breast cancer gene for which there was strong molecular evidence. The possibility that ATM (ATM serine/threonine kinase) could be a breast cancer susceptibility gene was first proposed over 20 years ago when epidemiologists suggested that relatives of patients with an autosomal recessive condition called ataxia-telangiectasia which predisposes to cancer in childhood, particularly lymphoid cancers, had an increased risk of breast cancer.111 The ATM gene was then mapped and identified by positional cloning.112,113 ATM is a protein kinase with multiple complex functions, including a central role in DNA double-strand break repair in concert with BRCA1/BRCA2. The ATM protein has been demonstrated to phosphorylate the BRCA1, p53 and CHEK2 proteins.114
The role of ATM in breast cancer susceptibility has been investigated in multiple studies. The largest of these, which identified 12 mutations in 443 familial breast cancer cases and two in healthy controls (p = 0.0047), has shown that the RR of breast cancer in monoallelic ATM mutation carriers is 2.37;115 however, certain mutations may cause high-risk susceptibility.
BRIP1
In 2006, BRIP1 (BRCA1-interacting protien C-terminal helicase 1), a BRCA1-interacting helicase (also known as BACH1), was also shown to be a rare moderate-penetrance breast cancer susceptibility allele. This gene was investigated as a candidate gene because it is a binding partner of BRCA1 and, thus, is implicated in some of the activities of BRCA1 in DNA repair.116,117 Truncating mutations in this gene are rarer than in CHEK2 or ATM. In a case–control study, nine mutations were identified in 1212 familial breast cancer cases, compared with two in 2081 healthy controls (p = 0.003); the RR of breast cancer in monoallelic carriers of BRIP1 mutations is 2.0.117 Interestingly, almost simultaneously, BRIP1 was identified as the gene responsible for Fanconi anaemia (complementation group J) in biallelic mutation carriers of the gene.117 BRIP1 was the second gene found to predispose to breast cancer in monoallelic mutation carriers and to cause Fanconi anaemia in biallelic mutation carriers; BRCA2 was the first such breast cancer susceptibility gene.118
PALB2
The fourth rare moderate-penetrance breast cancer susceptibility gene to be identified, PALB2 (partner and localizer of BRCA2), has also been demonstrated to predispose to breast cancer in monoallelic mutation carriers and to cause Fanconi anaemia (complementation group N) in biallelic mutation carriers.119,120 PALB2 encodes a protein which interacts with BRCA2. In a familial breast cancer case–control study, 10 truncating mutations were identified in 923 individuals with breast cancer, but no mutations were identified in 1084 healthy controls (p = 0.0004). The RR of breast cancer associated with a mutation in PALB2 was estimated at 2.3-fold.121
Each of these moderate-penetrance genes makes up a relatively small proportion of the overall familial risk of breast cancer (see Figure 7). Compared with the 16–20% of familial risk accounted for by mutations in BRCA1 and BRCA2, in 2008, it was estimated that the currently identified moderate-penetrance breast cancer susceptibility genes accounted for only 2.3% of the familial component of risk.122 In keeping with findings in BRCA1 and BRCA2, most of the pathogenic mutations in these genes lead to premature protein truncation through nonsense codons or translational frameshifts. A very small number are possibly due to missense sequence variants. The moderate-penetrance breast cancer susceptibility genes each harbour multiple different rare pathogenic mutations.
The features of moderate-penetrance breast cancer susceptibility genes differ from those of high-penetrance genes in several ways. There are differences in the extent of segregation of disease-causing mutations with breast cancer. In breast cancer families which are due to mutations in BRCA1 or BRCA2, the mutation and disease status usually occur together in individuals, that is, family members who carry the mutation will usually be the individuals who are affected by breast and/or ovarian cancer. However, it has been suggested that phenocopies (women with breast cancer but without the familial mutation) can constitute around 24% of breast cancer cases in a family; this is based on data from families known to carry a BRCA1 or BRCA2 mutation.86 In breast cancer families due to moderate-penetrance breast cancer genes where the risks are two- to threefold, disease-causing mutations often do not segregate with the disease. This is due to the lower penetrance of the mutations in these genes, which means that most mutation carriers do not actually develop breast cancer. Other relevant factors are the high rate of sporadic breast cancer, and the likelihood that familial breast cancer clusters without mutations in BRCA1 or BRCA2 are probably due to a random aggregation of susceptibility alleles in many different genes.
In contrast to BRCA1 and BRCA2, there is no strong evidence for the occurrence of other cancers, or an early age at onset of breast cancer, in heterozygous carriers of mutations in CHEK2, ATM, BRIP1 and PALB2. A possible reason for this could be the lack of sufficient identified cases to provide evidence of these features.
Neurofibromatosis type 1
Women with the inherited tumour-prone condition neurofibromatosis type 1 are now thought to be at moderately increased risk of developing breast cancer.123
The currently identified high- and moderate-risk genes are shown in Table 17.
TABLE 17
Genes associated with a moderate or high lifetime risk of breast cancer and effects on life expectancy
Breast cancer susceptibility genes and loci with low penetrance
The identification of genes and loci leading to low-penetrance breast cancer susceptibility required an alternative strategy from the linkage studies employed in the discovery of genes like BRCA1 and BRCA2 because, by their nature, they do not give rise to the large multiple-case families required for this. Therefore, other methodologies have been utilised in the discovery of these loci. In the past, this has usually been through association studies which have investigated candidate genes related to the biology of normal breast tissue or breast cancer. More recently, the availability of high-resolution linkage disequilibrium maps and comprehensive sets of tagging SNPs that cover most common sequence variants has led to the successful completion of multiple GWASs. The benefits of this study design are that the approach is not biased and does not rely on knowledge of prior function. It also minimises the likelihood of failing to identify important variants in genes which have not previously been studied. Although it has been speculated for some time that a proportion of familial breast cancer risk is due to common low-penetrance loci, these have only recently been identified. In the past, only small numbers of cases and controls were utilised in targeted association studies, but, when these studies were expanded, preliminary associations were usually not confirmed. The recent results in this field are due to large-scale, multinational collaborations which have given rise to thousands of cases and controls, resulting in the statistical power to detect small effects, thereby overcoming the limitations of earlier small studies.124
By 2008, when we applied for funding, 10 susceptibility loci had been reported for which there was statistically robust evidence.8–10,28,30,125–129 Five of these loci were in regions that include known protein-encoding genes. The genes are CASP8,30 FGFR2,8,9 TNRC9 (trinucleotide repeat-containing 9),8,10 MAP3K1 and LSP1.8 Some of these loci also include other protein-encoding genes, and it is possible that the association with breast cancer could be due to these, or even to regions which currently are not known to include biologically relevant sequences.
The SNP at 6q22 was identified through cases and controls from the relatively genetically isolated Ashkenazi Jewish population;125 the RR of breast cancer conferred by this SNP in other populations may differ. The group that has recently identified the breast cancer susceptibility locus at 6q25 has provided evidence that common loci can confer varying risks of breast cancer dependent on the population studied. The group found that the RR of breast cancer in the population of Chinese women studied was 1.36 or 1.59, respectively, for the G>A heterozygous and homozygous variants at this locus. However, in the European population studied the association was weaker and the RRs conferred were 1.11 and 1.35, respectively.28
Investigations studying the subtypes of breast tumour associated with these susceptibility loci have revealed that certain loci, particularly in FGFR2, TNRC9, 8q24, 2q35 and 5p12, are more commonly associated with oestrogen receptor-positive disease than oestrogen receptor-negative disease.128 These findings suggest that breast tumours of these two subtypes might have differing aetiologies relating to genetic background, as has already been indicated by findings in breast tumours of BRCA1 and BRCA2 mutation carriers. In 2009, two further susceptibility loci were identified.130
In 2010, a larger GWAS was published of 582,886 SNPs in 3659 breast cancer cases with a family history of breast cancer and 4897 controls.131 This validated the existing SNPs and identified five further SNPs, bringing the total to 18 validated SNPs. Turnbull published new ORs and allele frequencies allowing application of these SNPs in clinical practice.131 The SNPs and the allele frequencies are shown in Table 18.
TABLE 18
Breast cancer susceptibility SNPs, published RAFs and associated ORs, and observed genotype frequencies in the 478 participants who have provided a DNA sample
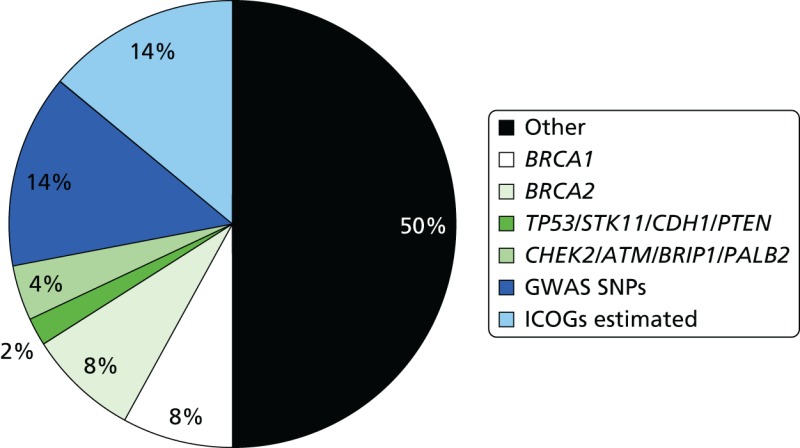
Since the Turnbull report,131 a major international initiative, the International Collaborative Oncological Gene-Environment Study (ICOGS),132 was initiated, culminating in multiple reports in Nature Genetics in March 2013. These brought the number of identified validated SNPs to only 77132–134 but boosted the ‘known’ familial component of breast cancer attributed to SNPs to only 14% (see Figure 7).27 Evidence from the GWAS data nonetheless suggests that other, rarer SNPs may contribute as much as 41% of heritability, leaving only 24% as ‘missing heritability’.27
The RR of breast cancer conferred by the common low-penetrance loci ranges from 1.04 to 1.43 in European populations (some SNPs are protective, giving ORs of 0.85–0.88, equivalent to an increase in risk for the common allele of 1.13–1.18; see Table 18). The risks are small, but, as the population prevalence of each allele is high, their contribution to the familial risk of breast cancer, in European populations, is relatively large. It has been estimated that if the attributable risks of the loci characterised by Turnbull et al., and the breast cancer susceptibility variant in CASP8, were combined, they would account for 10% of the familial risk of breast cancer in European populations. It is postulated that there may be up to hundreds of further common low-penetrance breast cancer susceptibility alleles yet to be identified which confer small risks of breast cancer, which are most likely less than those conferred by the variants so far identified. An important and interesting area of ongoing research is in identifying the role of the loci described above in the development of breast cancer. Some work has already been performed in this field to investigate possible pathways by which SNPs in FGFR2 could be causative for breast cancer, but much remains to be learnt regarding the mechanism by which common low-penetrance SNPs lead to cancer formation.
Methods
In our application to NIHR in 2008, we were aware of 10 SNPs that could be assessed. Our plan at that time was to:
- assess BARD1 (Cys557Ser) variant
- assess common ATM variants
- assess five genes from the GWAS
- assess variant in the type I TGF-ss receptor, TGFBR1*6 A, which may account for ≈5% of all breast cancer
- add other validated SNPs as they are found.
Frequencies of the variants will be compared with a regional control sample set of 500 women matched for ethnicity and age.
The necessity of identifying a control population was negated by the publication of allele frequencies in the Turnbull data,131 many of which derived from Manchester. Pragmatically, the research plan changed in 2010 to include all of the SNPs identified in the Turnbull et al. study.
We initially proposed analyses in four studies assessing impact of SNPs in different situations, the fourth assessing the predictive value from the other three.
- We had already validated seven gene variants previously associated with increased breast cancer risk (BARD1, TOX3, FGFR2, MAP3K1, LSP1, CASP8 and 8q) in ≈200 female BRCA1 and ≈200 BRCA2 carriers, confirming increased risk of breast cancer conferred by variants in FGFR2 and TOX3 and the protective effect of the minority allele in CASP8 in BRCA1/BRCA2-positive individuals.135 We proposed to extend our analysis to include all female carriers (n = 850 at that time) and assess the variants for interactions and modifier effects. New variants were proposed to be added as they were identified. As above, the proposed research was extended to test 925 proven BRCA1 or BRCA2 female carriers for the 18 SNPs identified by Turnbull et al.131
- The second proposed analysis was to test the SNPs in 1400 high-risk BRCA1/BRCA2-negative breast cancer cases and compare this with 500 matched control samples. The variants were to be weighted for their individual effects in heterozygous and homozygous states and assessed for interactions with other variants. This analysis was deemed unnecessary as we obtained funding (from the Genesis breast cancer prevention appeal) for obtaining saliva DNA in 10,000 women from our population-based PROCAS study. We were, thus, able to assess the predictive value of SNPs for non-BRCA-related breast cancer.
- Testing of DNA from 58 breast cancer phenocopies (women who are negative for the family BRCA1/BRCA2 mutation) was, likewise, proposed to be assessed for the variants in a weighted analysis to identify whether or not significantly more of the high-risk alleles are carried by those women to account for their increased risk of breast cancer. DNA from phenocopies was tested for the 18 SNPs identified by Turnbull et al.131
- We proposed using data from the first three analyses to develop a weighted score to assess the predictive value of the combined group of validated variants in predicting which women developed breast cancer in our familial screening programme. We proposed using the incident cancers and matching with controls on a 1 : 3 basis randomly selected from our FHC for presence or absence of familial BRCA1/BRCA2 mutation, plus all other currently used risk factors (menarche, parity, age, family history and breast disease). Women were recruited from our FHCs to provide blood samples for DNA analysis or to give permission to use stored DNA. Matching of controls was changed (with statistical advice) to matching for just age and type of mammogram. It was felt that overmatching would not allow for the examination of differences in the other risk factors being assessed. Matching was still kept at a 1 : 3 cases-to-controls basis and tested for the 18 SNPs identified by Turnbull et al.131
Deoxyribonucleic acid testing
The DNA was extracted from blood or saliva samples provided by women attending the genetic clinics at St Mary’s Hospital or the FHC at Wythenshawe hospital.
BRCA1/BRCA2 testing
Using DNA Sanger sequencing and MLPA analysis, BRCA1 and BRCA2 mutations were identified in women referred with breast or ovarian cancer; relatives of these identified BRCA1/BRCA2 mutation carriers were then also offered targeted screening for the family-specific genetic mutation.
Single nucleotide polymorphism testing
Women were typed for 18 SNPs that have been shown to be associated with breast cancer risk in the general population [FGFR2, CASP8, TOX3, MAP3K, 2q, CDKN2A (cyclin-dependent kinase inhibitor 2A), 10q22, COX11 (COX11 cytochrome c oxidase copper chaperone), NOTCH, 11q13, 10q21, SLC4A7 (solute carrier family 4, sodium bicarbonate cotransporter, member 7), 6q25.1, 8q24, RAD51L1, LSP1, 5p12 and 10q], as risks were identical for two SNPs at the same locus; the nineteenth SNP was dropped.131 Using the published per SNP ORs and risk allele frequencies (RAFs) from Turnbull et al.131 (e.g. FGFR2 per-allele OR is 1.43 with RAF of 0.42; see Table 18), we calculated the OR for each of the three SNP genotypes (no risk alleles, one risk allele and two risk alleles), assuming independence. To obtain an overall breast cancer risk score for each woman, we multiplied the ORs for each of her 18 genotypes together. As a subset of three SNPs (TOX3, 2q and 6q25.1) has now been validated to be associated with increased risk of breast cancer in BRCA1 mutation carriers,136 and another subset of nine SNPs (FGFR2, TOX3, MAP3K, 2q, 1p11.2, SLC4A7, 6q25.1, LSP1 and 5p12) in BRCA2 mutation carriers,136,137 we repeated the analysis using only these SNPs. Finally, we calculated an alternative overall breast cancer risk score based on a combination of SNPs validated to increase risk in BRCA1/BRCA2 mutation carriers and SNPs not yet validated in BRCA1/BRCA2 mutation carriers, that is, all of the original 18 breast cancer susceptibility SNPs, except for those that have been shown to have no association with breast cancer risk in BRCA1/BRCA2 mutation carriers.
Statistical analysis
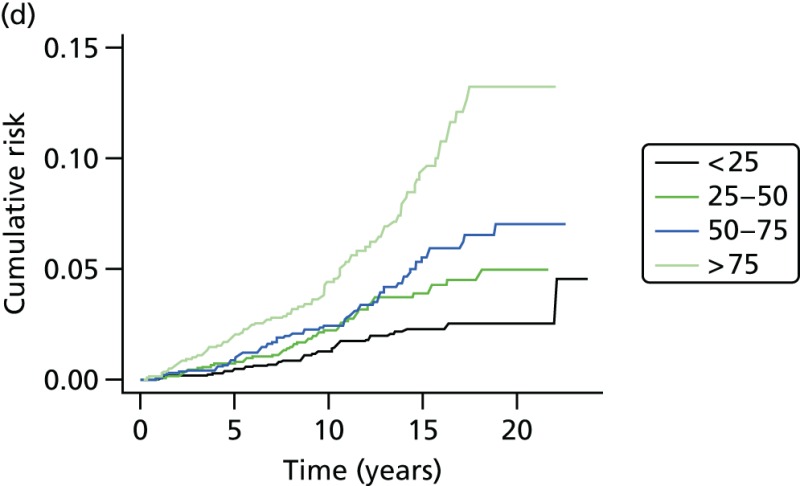
Age at the development of breast cancer (time from date of birth to the date of diagnosis in cases) or from date of birth to the date of last follow-up (if not a case) was analysed using survival analysis with the censor variable set at 1 for breast cancer cases and 0 otherwise. Cumulative hazard curves were calculated using the Nelson–Aalen estimator136 and the Cox proportional hazards137 model was used to assess the relationship between breast cancer risk and overall breast cancer risk score (which was split into quintiles and entered into the model as an ordinal categorical variable) and calculate the HRs. The proportional hazards assumption was assessed graphically by plotting –ln(–ln(survival)) versus ln(time) for each of the five risk groups and checking to see that the curves are parallel.
Methods: study 1 – BRCA1/BRCA2
Families with individuals with breast and/or ovarian cancer have been screened for mutations in BRCA1/BRCA2 since 1996 in the Manchester region in north-west England, encompassing ≈5 million people. Women with a family history of breast/ovarian cancer who attend specialist genetic clinics in these two regions have a detailed three-generation family tree constructed. The date the first family member was referred to the genetic service was considered as the family ascertainment date. If a BRCA1/BRCA2 mutation is identified, further attempts are made to ensure that all individuals relevant to discussions on risk are represented on the family tree. All cases of breast/abdominal cancers are confirmed by means of hospital/pathology records, regional Cancer Registries (from 1960) or death certification. Once a family-specific pathogenic BRCA1/BRCA2 mutation is identified, predictive testing is offered to all blood relatives.
The details of all tested relatives and first-degree untested female relatives were entered onto a FileMaker Pro 7 database. The initial individual in whom a mutation was identified was designated the ‘index’ case, with all other individuals being classified according to their position in the pedigree compared with a proven mutation carrier. All women reaching 20 years were entered on the database even if they were untested for a mutation. The exception was for mothers of a mutation carrier when it was clear that the mutation was paternally inherited (i.e. there was no maternal family history but a very convincing paternal history of breast/ovarian cancer). A total of 807 index cases were studied. Date of birth and date of last follow-up, breast cancer status, ovarian cancer status, dates of diagnoses and date of death (if applicable), gene mutation identified in the family, the individuals relationship to a known mutation carrier and their mutation status were entered.
All identified mutation carriers from whom DNA was available were assessed for breast cancer incidence. Women were censored at risk-reducing mastectomy last follow-up/death or at the event of breast cancer, whichever was the soonest. The predictive ability of the Cox models was assessed using Harrell’s C concordance statistic.138,139 The type I error (α) was set at 5%. Thus, this analysis assessed the impact of the multiplicative SNP genotypes on penetrance of breast cancer. We estimate that about half of our patient samples have been used in analysis of SNPs in CIMBA (Consortium of Investigators of Modifiers of BRCA1/BRCA2). Ethics approval for the study was through the North Manchester Research Ethics Committee (08/H1006/77) and the University of Manchester Ethics Committee (08229).
Methods: study 2 – PROCAS (UKCRN-ID 8080)
A subset of the PROCAS population was invited to attend drop-in days and provide a saliva sample for DNA extraction. Women giving their consent were provided with an Oragene kit (DNA Genotek Inc., Ottawa, ON, Canada) to collect a saliva sample. DNA was extracted in accordance with the manufacturer’s protocols and 18 known validated breast cancer SNPs (only one for each genetic locus) associated with breast cancer were typed (see Table 18). Genotyping was performed as multiplexed assays using the Sequenom® MassARRAY™ iPLEX™ Gold system (Agena Bioscience GmbH, Hamburg, Germany), thereby reducing the costs and time associated with the genetic analysis to sample sets of 384 being analysed and scored in < 5 days. Chips were run on a MALDI-TOF mass spectrometer (Wickham Laboratories Ltd, Gosport, UK) and the mass automatically converted to the allele call. One of the SNPs (rs10931936) was genotyped using a TaqMan® (ThermoFisher Scientific, Waltham, MA, USA) SNP genotyping allelic discrimination assay (C___2960444_10). Reactions were performed at standard conditions and analysed using SDS software (The WERCS, Latham, NY, USA). Quality checks including duplicate samples, water and positive controls were undertaken. Using the published estimates of per-allele ORs for breast cancer from the most recent GWAS131 for the majority of the SNPs (all except rs713588), we calculated the RR of developing breast cancer for each genotype. For example, for FGFR2, the published RAF of the risk allele T is 0.42 and the per-allele OR is 1.43. The frequency of genotypes TT, TC and CC is, therefore, 0.17 (0.422), 0.49 (2 × 0.42 × 0.58) and 0.34 (0.582), respectively, the average population risk relative to genotype CC is 1.39 (0.17 × 1.432 + 0.49 × 1.43 + 0.34 × 1.00) and the risk relative to the general population for each of the three genotypes is 1.47 (1.432/1.39), 1.03 (1.43/1.39) and 0.72 (1/1.39), respectively. We then calculated a combined risk score for each woman, based on her SNPs, by multiplying her individual risk ratios together.
Methods: study 3 – phenocopies in BRCA1/BRCA2
Families including individuals with breast and/or ovarian cancer have been screened for mutations in BRCA1/BRCA2 since 1996 in the overlapping regions of Manchester and Birmingham in mid/north-west England, encompassing ≈10 million people. The methods used were as in study 1 but only women with breast cancer who tested negative for the family mutation were the main point of the analysis. The resultant combined series is referred to as the M6-ICE (Inherited Cancer in England) study.
Women with breast or ovarian cancer who tested negative for the family mutation were defined as phenocopies. In 90% of cases, at least two independent blood draws from every phenocopy have been genotyped to firmly establish negative mutation status. Only first-degree relatives of proven pathogenic mutation carriers were included in the study.
An analysis was undertaken assessing prospective breast cancer risk in individuals testing negative for the family mutation using date of ascertainment of the family by the genetic service as the start date. Standard incidence ratios were derived using age- and year-specific data from the population-based NWCIS, as previously described.44 Follow-up was censored at 1 July 2011 or date of breast cancer, date of death or date of bilateral risk reducing breast surgery, whichever was the earliest. Person-years at risk analyses were performed to assess expected cancers in the general female population using data from the NWCIS. O : E ratios were assessed for statistical significance using the common method from Clayton and Hills based on the Poisson assumption.100 A subset of women testing negative for the family mutation was part of an assessment programme, FH-Risk, for which we had ethics approval to check details against the NWCIS for cancer incidence. This was carried out in September 2011. A final analysis was carried out using date of testing of unaffected first-degree relatives as the start date.
An assessment of the strength of family history of breast cancer was also included by summating the BRCA2 element of the Manchester scoring system for each affected family member.49 This system scores breast cancers in the direct lineage based on age at diagnosis, giving higher scores for earlier age at diagnosis. An assessment was also made of close breast cancer family history (first-degree relative and second-degree relative) using diagnosis < 40 years in a first-degree relative, < 50 years in at least two relatives (including a first-degree relative) or at least three relatives (including a first-degree relative) diagnosed at < 60 years as a surrogate for increased ‘breast cancerness’.
Deoxyribonucleic acid testing for single nucleotide polymorphisms
Methods were as per Methods: study 2 – PROCAS (UKCRN-ID 8080) using the SNP18 score.
Methods: study 4 – FH-Risk case–control
The cases and controls were matched on a 1 : 3 basis with age at assessable mammogram being the matching criterion. The controls did not have cancer at last follow-up and cases had to have been diagnosed after an assessable mammogram or have an assessable mammogram at date of cancer diagnosis and no cancer in the contralateral breast. The controls were also matched for type of mammogram, either digital or analogue. The questionnaire data were updated to include clothes size and alcohol intake as well as ensuring that data were held on age at menarche and age at first full-term pregnancy. The TC model was used to incorporate an adjustment for MD using the VAS and two digital methods (Volpara and Quantra). For breast cancer cases with no assessable mammogram but in whom blood DNA was available, controls were also recruited for the DNA SNP study.
Recruitment was between 1987 and 2012. Follow-up was until 2013, median 8.4 years in the present study. The primary end point was diagnosis of invasive breast cancer or DCIS (ICD-1065 codes C-50 and D-05.1). The cases that accrued were identified by BRCA1-negative controls who attended the clinic but were not diagnosed with breast cancer to last follow-up and were matched approximately 3 : 1 to the non-BRCA1 cases on age at breast cancer diagnosis or last mammogram prior to diagnosis (cases), with age at last follow-up or mammogram (controls). As many BRCA1-confirmed participants were genotyped as was possible. A 18 SNP polygenic score was assessed for predictive performance. This was calculated relative to the population, based on the RAFs in Table 18, so that the mean risk for each SNP in the population was 1.0. The OR estimates were taken from Turnbull et al.131 when not available. The TC breast cancer risk model was used to calculate expected risk from breast cancer on the basis of family histories of the disease and other phenotypic factors, as described in the analysis of the complete family history cohort.57
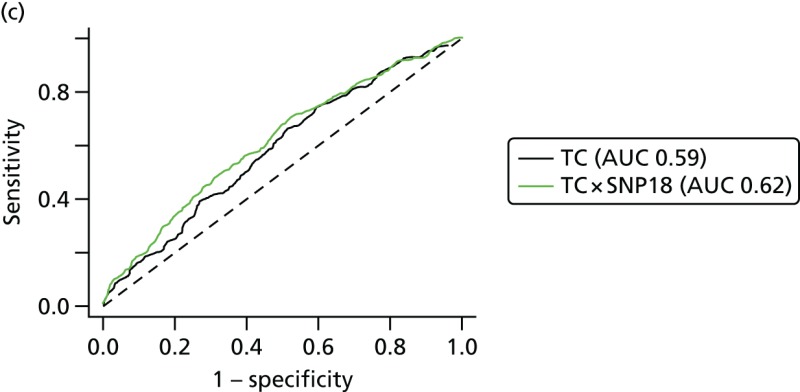
Analysis was carried out separately for BRCA1 and non-BRCA1 carriers, and when combined. Hardy–Weinberg equilibrium for each SNP was tested by assessing the observed number of homozygotes against the expected number using a binomial distribution. Age and SNP score distributions were summarised by percentiles. The numbers of failed assays were reported by SNP, as well as the distribution for individual samples. Assay failures were ignored in the SNP score by imputing a population RR of 1.0 when they occurred. Analysis of baseline risk factors (age) and time to diagnosis was undertaken by assuming that the controls were representative of the complete cohort controls. A plot of observed versus expected RR from the SNP score was obtained using a binary regression (normal) kernel smoother, with bandwidth set by hand. Unconditional logistic regression models were used to assess the performance of the SNP score by fitting a model with a single covariate for the log-RR, 10-year absolute risk from age, and 10-year absolute risk from age and the SNP score. The main measure of prediction power was the likelihood-ratio χ2 (degrees of freedom = 1) statistic from the model. The area under the receiver operating characteristic curve was used as a secondary measure of discrimination. Kaplan–Meier survival estimates of risk groups were obtained, weighting by the sampling fraction of controls in the cohort. The SNP18 and TC RRs were compared using a scatterplot.
Results
Study 1: BRCA1/BRCA2
Text in this section has been reused with permission from Ingham SL, Warwick J, Byers H, Lalloo F, Newman WG, Evans DGR. Is multiple SNP testing in BRCA2 and BRCA1 female carriers ready for use in clinical practice? Results from a large Genetic Centre in the UK. Clinical Genetics 2013, 84:1, 37–42, © 2012 John Wiley & Sons A/S. Published by John Wiley & Sons Ltd.140
A total of 480 and 445 women with a confirmed pathogenic mutation in BRCA1 and BRCA2, respectively, were identified from the records of the Department of Genetic Medicine (Table 19). Of the 480 BRCA1 mutation carriers, 462 were included in the analyses (18 failed DNA samples); 58% (268/462) to date have developed breast cancer. Estimates of the HRs (each quintile relative to the highest risk group, quintile 1) and the corresponding 95% CIs are also shown (Table 20). There was no difference in age at the development of breast cancer between the risk groups (overall breast cancer risk score split into quintiles) based on the 18 SNPs (p = 0.25; see Table 20). There was little separation between the cumulative hazard curves (Figure 9). Basing our risk score on only the three SNPs that have been validated in BRCA1 carriers, or the three validated SNPs, plus six that have not yet been validated in BRCA1 mutation carriers, did not lead to better discrimination; there was no difference in age at the development of breast cancer between the risk groups (p = 0.12 and p = 0.92, respectively; see Table 20) and there was no distinct separation between the corresponding cumulative hazard curves (Figure 10). The Harrell’s C-statistic (the probability that when one of two subjects is observed to develop breast cancer before other one that develops breast cancer second has the lower of the predicted HRs) for the 18, three and nine SNPs based overall breast cancer risk scores was 0.54, 0.51 and 0.48, respectively (i.e. the models have poor predictive ability).
TABLE 19
Descriptive statistics of the population
TABLE 20
Hazard ratios from the Cox model for age at the development of breast cancer in BRCA1 mutation carriers, by overall breast cancer risk score (split into quintiles)
Of the 445 BRCA2 carriers, 280 had developed breast cancer by the cut-off date of 1 December 2010 for follow-up and data extraction. The HRs (each quintile relative to quintile 1, the highest-risk group) and corresponding 95% CIs are given in Table 21. There was a significant difference in age at the development of breast cancer between the risk groups (overall breast cancer risk score split into quintiles) based on the 18 SNPs (p < 0.001; see Table 21) and clear trend for reducing hazard with reducing overall breast cancer risk score (increasing quintile). The cumulative hazard curves (Figure 11) illustrate that there was clear differentiation between the risk groups. It should be noted, however, that breast cancer cases arise across a wide range of ages in each quintile (as indicated by the position of the steps in the cumulative hazard curves) and that the predictive ability of the model was, therefore, only modest (Harrell’s C = 0.59). The alternative breast cancer risk scores (based on 9, 5 and 15 SNPs, respectively) also lead to risk groups with significant differences in age at the development of breast cancer (p < 0.001 for all). The cumulative hazard curves (Figure 12) suggest that the overall breast cancer risk scores based on 15 SNPs might be slightly better than those based on the original 18 SNPs as a measure of breast cancer risk in BRCA2 mutation carriers, but Harrell’s C-statistic for this model was also 0.59, suggesting that in terms of predictive ability it offers no improvement.
TABLE 21
Hazard ratios from the Cox model for age at the development of breast cancer in BRCA2 carriers, by overall breast cancer risk score (split into quintiles)
Study 2: PROCAS population testing
As part of the PROCAS study, women were invited to provide a saliva DNA sample for testing of the 18 SNPs. A total of 9958 saliva samples have now been obtained, including samples from 398 women with breast cancer after recruitment and 454 with prevalent breast cancers. Genotyping has been carried out on 6954 women. Initial analysis was performed on the first 993 cases to assess interaction between SNP score and TC risk. The overall risk score for each woman (her estimated RR of developing breast cancer compared with that of the general population) was obtained by multiplying her individual per-allele RRs together. The interquartile range (IQR) for this SNP-based estimate of breast cancer RR was 0.68–1.29, whereas for the same 993 women the TC estimate of breast cancer risk, relative to the population average of 2.7%, was 0.84–1.45. The IQR of the corresponding TC estimates of absolute breast cancer risk was 2.28–3.93%. If it was assumed that every woman has a 10-year absolute risk of developing breast cancer of 2.7% (i.e. roughly the population average), adding the SNPs information gave modified individual risk estimates with an IQR of 1.78–3.48%. Using the individual risk estimates from the TC model instead of the population mean to represent the underlying risk led to modified individual risk estimates with an IQR of 1.83–4.41. The distribution of these SNP-based risk estimates together with those obtained from the TC model are shown in Figure 13. The addition of SNPs to the TC model broadened the distribution of risk estimates so that fewer individuals are in the average-risk category (Figure 14). Furthermore, greater numbers were assigned to both the highest- and lowest-risk categories, suggesting that the incorporation of SNPs information into the TC model may lead to better discrimination. Overall, in the 993 who provided a DNA sample, there was no correlation between the SNP-based risk estimates and those from the TC model (ρ = 0.02), between the SNP-based risk estimates and MD (ρ = –0.09), or between the risk estimates from the TC model and MD (ρ = 0.07). A scatterplot showing lack of correlation is shown in Figure 15. Overlap of highest 10% risk on 18 SNP, VAS and TC is shown in Figure 16. This shows only a random association, with only 1 out of 993 being high risk on all three, as would be expected by chance.

FIGURE 14
Predicted breast cancer risk from the TC model (based on classic breast cancer risk factors), and predicted breast cancer risk from the TC model (crudely adjusted to take account of individual SNPs) for the 993 women who provided DNA samples.
FIGURE 15
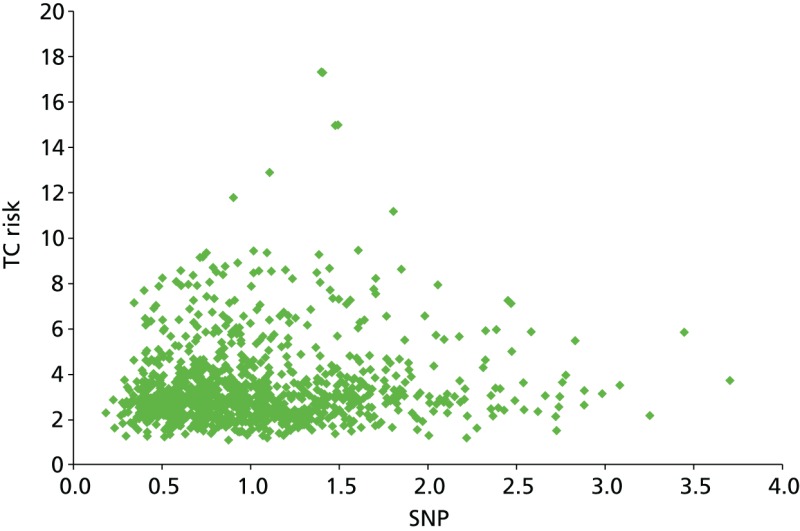
Scatterplot showing correlation between TC and SNP RR.
FIGURE 16
Venn diagram of overlap of highest 10% risk from 993 women with SNP, TC score and VAS density.
We have genotyped 6954 women from PROCAS, including 673 with breast cancer. There was a clear increase in overall predicted RR from the PRS in those with breast cancer. Median (mean) RR was 1.00 (1.15), compared with 0.90 (1.02) for those without. The distribution was also shifted to the right in all categories (Figure 17).
FIGURE 17
Ten-year risk in those with breast cancer compared with those without based on PRS from SNP18. BC, breast cancer.
We next investigated how a polygenic SNP score based on these SNPs would compare with classical risk factors, and how much information it might add to risk assessment.
Our analysis was based on simulated SNP scores from 100,000 women with population allele frequencies for the 67 SNPs identified,27 and treating them as independent so that a combined risk score can be obtained by multiplying their RRs; and the TC risk model risk predictions from the first 10,000 women enrolled to the PROCAS study (predicting risk of breast cancer at screening) in Manchester, UK.141 The outcome measure was the 10-year RR of developing breast cancer.
Histograms are shown in Figure 18 for the TC model, the SNP score using 18 genes previously published141 but with risks updated from Latif et al.,135 the full set of 67 SNPs, and a combined TC + SNP67 distribution assuming independence. Initial evaluations have shown that the TC model and SNP18 scores appear to be independent.141
Of particular interest is the > 8% 10-year risk group, for whom NICE guidelines in the UK advise offering the preventative use of tamoxifen.142 The SNP score was less able than the TC model to identify women at high risk (0.02% for SNP18, 0.37% for SNP67 and 0.77% for the TC model). However, adding SNP67 to TC gave a substantial increment to 2.85%, and similar effects were seen in the 5–8% 10-year risk group (1.72%, 4.28%, 6.64% and 8.17%, respectively), in which the number of women identified is much greater. It is also noticeable that the SNPs identified more low-risk women than the TC model, which mainly uses uncommon high-risk phenotypes.
Study 3: phenocopies
We undertook an analysis first to assess the potential increased risk in those testing negative for BRCA1 or BRCA2. This analysis was not part of the original data analysis plan, but fed into the SNP analysis that was funded. Among 809 families with a proven pathogenic mutation (428 BRCA1 or 381 BRCA2), 290 first-degree female relatives with breast cancer have undergone genetic testing following the identification of the family mutation. Forty-nine (17%) first-degree relatives with breast cancer tested negative for the family mutation. Ninety-five breast cancers occurred in first-degree relatives after the family ascertainment date and 21 (22%) of these tested negative. Of those who underwent predictive testing for the family mutation as unaffected individuals but who have subsequently developed breast cancer, 8 out of 42 (19%) have tested negative.
Prospective analysis
In total 279 female first-degree relatives tested negative for the family BRCA1 mutation and 250 tested negative for BRCA2. Two women (BRCA1) who had undergone bilateral risk-reducing breast surgery prior to ascertainment in the genetics service were excluded from the analysis, as were 27 women who had developed breast cancer prior to family ascertainment and one woman who died prior to family ascertainment (BRCA2). Thus, 17 breast cancers from BRCA1 families and 13 breast cancers from BRCA2 families were excluded from the prospective analysis. Following family ascertainment, seven (2.5%) cases of breast cancer occurred in the remaining 262 women testing negative for the familial BRCA1 mutation and 14 (5.9%) occurred in 237 women testing negative for their familial BRCA2 mutation.
Using a pragmatic recent date of follow-up (30 June 2011), assuming notification of breast cancers, the rates were 2.17 per 1000 (in 3217 years) in BRCA1 non-carriers, with a median age at ascertainment of 36.4 years, and 5.3 per 1000 (in 2634 years) in BRCA2 non-carriers, with a median age at ascertainment of 35.9 years (see Table 2). Using a person-years at risk analysis, 3.95 cancers would have been expected in the cohort of BRCA1 women and 3.06 in BRCA2. The O : E ratio was, therefore, 1.77 (95% CI 0.71 to 3.65) for the BRCA1 group and 4.57 (95% CI 2.50 to 7.67) for the BRCA2 group. The difference between the observed and expected values for BRCA2 was statistically significant: p < 0.0001. This analysis does not allow for any testing bias of those developing breast cancer. We are aware of 15 breast cancers in untested first-degree relatives, of which two or three (using the phenocopy rate of 17%) would be expected to have tested negative. However, we cannot be sure that we were informed of breast cancers in relatives who were not known to the service, perhaps because they were estranged or were living abroad.
Sufficient DNA was available to test 36 first-degree relative phenocopies for the 18 validated SNPs. Testing was also carried out on 445 BRCA2 mutation carriers (280 affected and 165 unaffected with breast cancer) and 462 BRCA1 carriers, 185 family history breast cancers testing negative for BRCA1/BRCA2 from full mutation testing and 421 population female controls from the NHSBSP in the PROCAS trial, as described above. The mean RR for the 18 SNPs was 1.27 for 22 first-degree relative BRCA2 phenocopies (range 0.82–3.17; median 1.18) and 1.31 (range 0.82–3.17) for the 18 first-degree relatives diagnosed aged < 60 years. The BRCA1 phenocopy RR was 1.24 (range 0.41–2.63) for 14 first-degree relatives and 1.13 for 12 aged < 60 years at diagnosis. In the 280 affected BRCA2 mutation carriers, the mean RR was 1.165 (range 0.29–5.09; median 1.01), with a RR of 0.993 (0.33–3.36; median 0.86) for the 165 unaffected carriers. In the 268 affected BRCA1 mutation carriers, the mean RR was 1.07 (range 0.24–4.35; median 0.93), with a RR of 1.11 (0.265–3.79; median 0.956) for the 194 unaffected individuals. Among 185 family history-positive breast cancers without BRCA1/BRCA2 mutations, the RR was 1.24 (range 0.37–4.62; median 1.10). The mean score in a series of 421 control samples from the general female population was 1.04 (range 0.24–4.3; median 0.93).
Study 4: FH-Risk
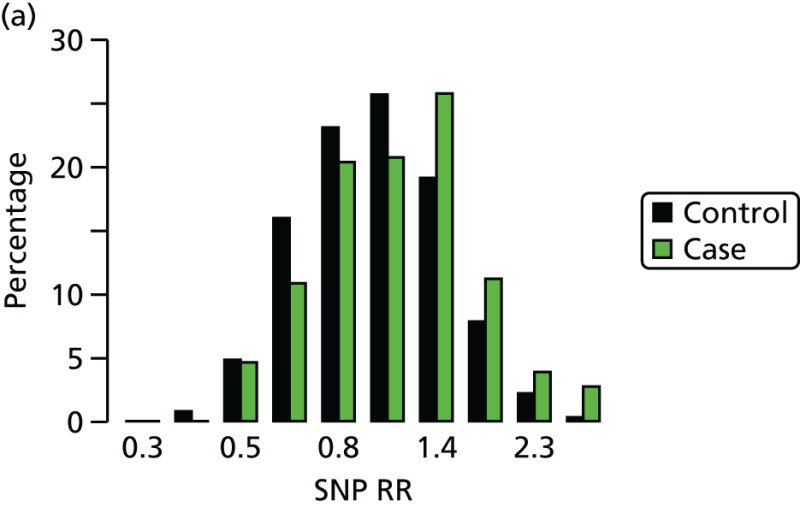
Samples of DNA have been obtained from 426 women affected with breast cancer and 1275 controls. Direct consent for FH-Risk was obtained for 320 cases and 980 controls (Figure 19). A further 38 who had been affected with breast cancer and had subsequently died having previously supplied a blood sample were also included. In addition, a further 68 BRCA1/BRCA2 mutation carriers and 295 who had tested negative for a family mutation as part of study 1 were included, as they were part of the FHC. DNA was tested in 1701 individuals and 18SNP RR scores were generated as previously described. In view of the results from study 1, 67 BRCA1 mutation breast cancer-affected carriers and 189 unaffected BRCA1 carriers were excluded from further evaluation. The distribution of RRs for unaffected and affected controls is shown in Figure 20. Although overall distribution of RR was very similar, a significantly higher proportion of cases, 33 out of 359 (9.2%), had RRs > 2, compared with controls: 56 out of 1079 (5.2%) (p = 0.01).
FIGURE 19
Uptake to the FH-Risk study over a 2-year period. (a) Cumulative uptake to FH-Risk – cases; and (b) cumulative uptake to FH-Risk – controls.

FIGURE 20
Distribution of RRs from 18SNP scores in FH-Risk cases and controls. BC, breast cancer.
Prospective analysis
A second analysis was carried out only using prospective breast cancers and excluding cancers detected on first screen (prevalent).
In this analysis, of 1415 women genotyped who attended the FHC and were breast cancer free at baseline, 199 were BRCA1 carriers. There were 306 cases, including 45 BRCA1 carriers.
The median year of enrolment for cases was 1999 (IQR 1995–2004); it was 2002 (IQR 1996–2007) for controls. The median age at matching was 50 years in cases and controls.
Single nucleotide polymorphism 18 score
- Table 22 shows the SNPs assayed and their failure rates. A total of 1148 (94.4%) of the non-BRCA1 samples were successful for all 18 SNPS; the numbers with 1, 2, 3, 4 and 5+ failures were, respectively, 41 (3.4%), 17 (1.4%), 5 (0.4%), 3 (0.2%) and 2 (0.2%), with a maximum of 6/18. The tests for Hardy–Weinberg equilibrium for each SNP are in Table 22.
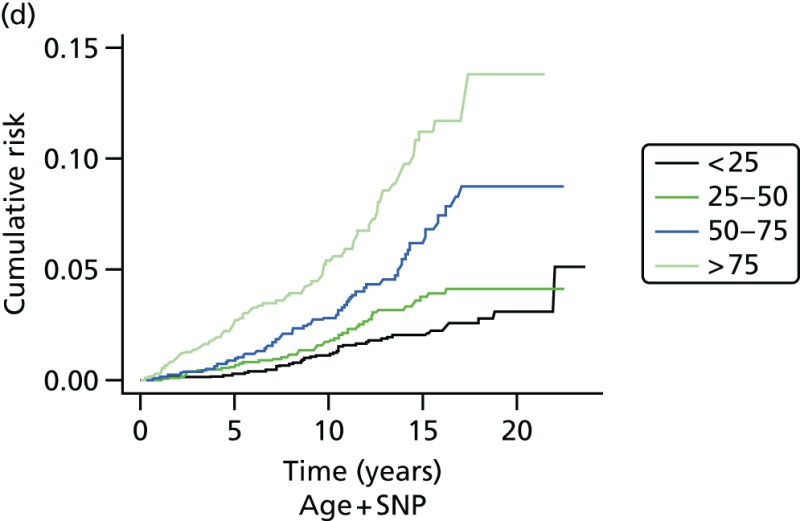
- Table 25 shows the results from logistic regression fits of the log SNP score, log 10-year absolute risk from age at recruitment, and log 10-year absolute risk from age at recruitment and the SNP score. It shows that adding the SNP score to age rates was useful for non-BRCA1 participants, but that neither age at baseline nor the SNP score was predictive for BRCA1 carriers.
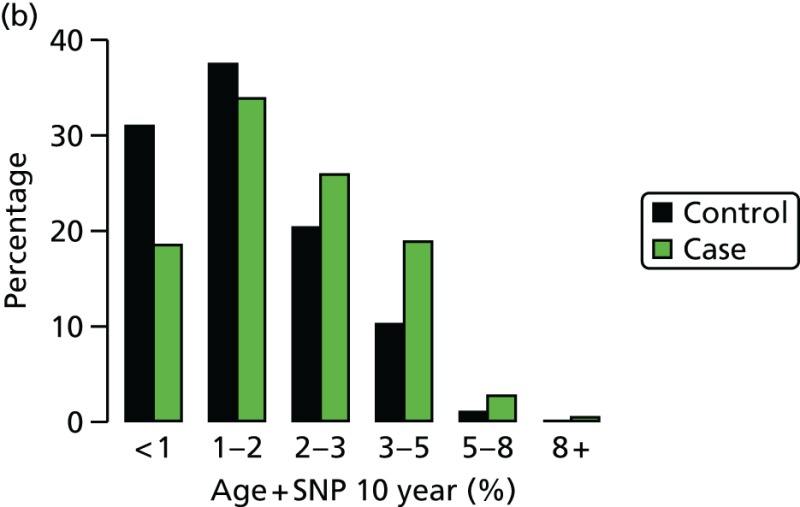
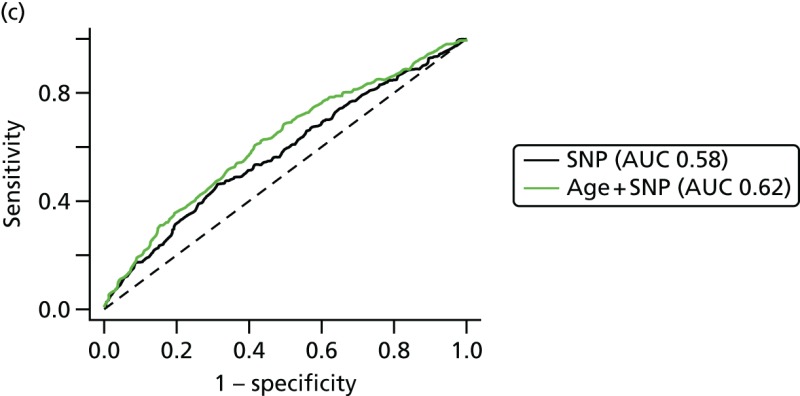
- Graphs are used to show the performance of the SNP score and age at recruitment in Figure 21.
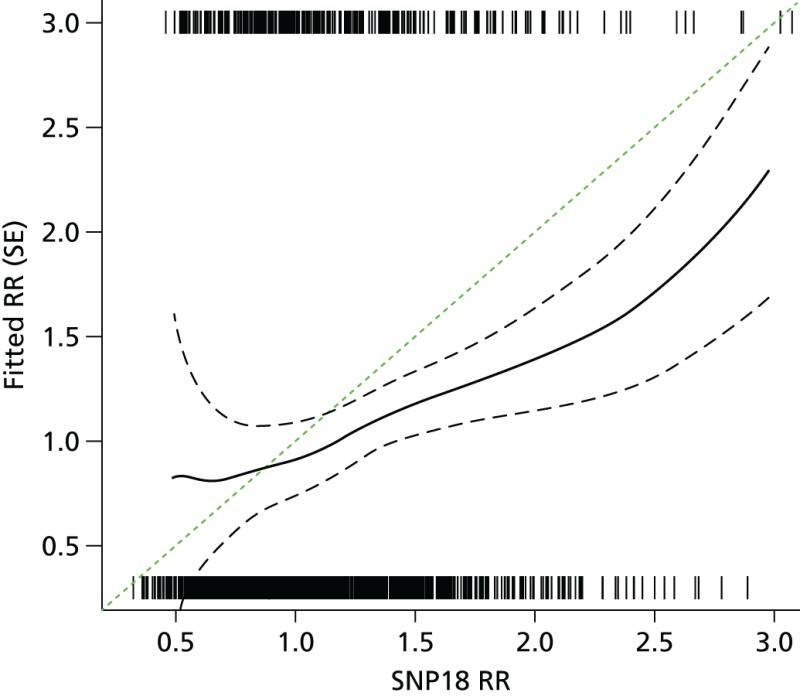
- Excluding BRCA1 cases and controls, the predicted risk from the SNP score was 82% (95% CI 45% to 121%) of expected. See also the histogram in Figure 21a and the binary regression plot in Figure 22.
TABLE 22
Summary of SNPs genotyped, excluding BRCA1
TABLE 23
Quantiles of SNP score by case/control and BRCA1 subgroups
TABLE 24
Quantiles of age at recruitment by case/control and BRCA1 subgroups
TABLE 25
Single nucleotide polymorphism 18 results from logistic regression model estimation. The OR is between the 75th and 25th quantile of each predictor in controls
FIGURE 22
Observed vs. expected RR from SNP18 in BRCA1-negative samples.
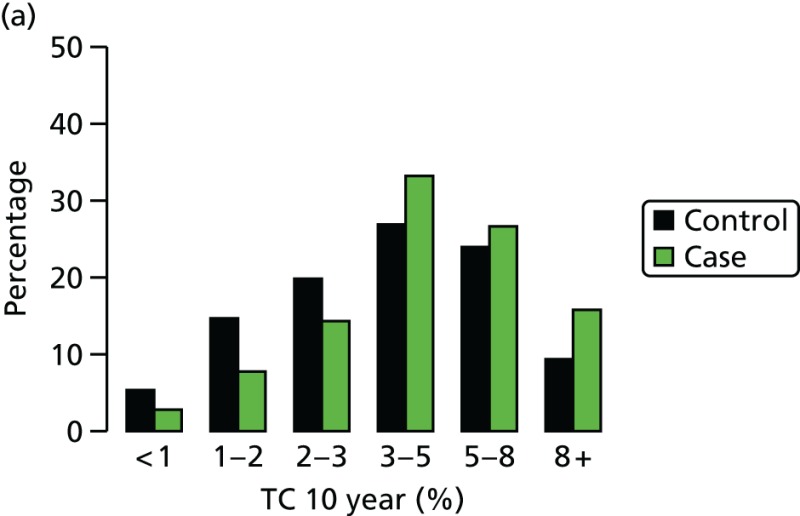
Tyrer–Cuzick model and single nucleotide polymorphism 18 score
- Figure 23 shows that there was very little correlation between the SNP18 score and projected 10-year RR from the TC model. SNP18 had a median RR of 1.00 in controls; it was 2.47 for TC.
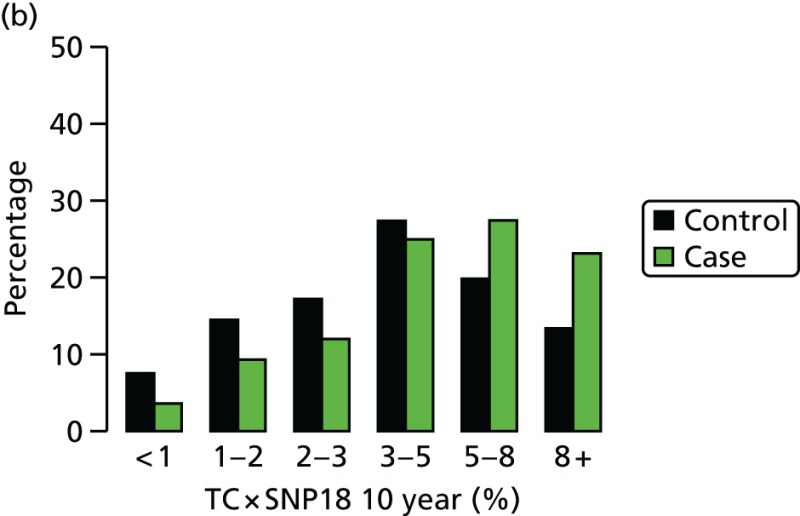
- Figure 24 shows the results of combining the TC model and SNP18.
- Table 26 provides a tabular summary of combining the SNP18 score with TC in this cohort. There is a substantial improvement in the LR-c2 seen when adding SNPs to TC by treating them as independent.
FIGURE 23
Tyrer–Cuzick vs. SNP18, BRCA1-negative cases and controls.

TABLE 26
Summary of performance of SNP and TC scores in non-BRCA1 + set, alone and when combined
Discussion
Overall, it has been possible to show some utility in using SNPs to predict breast cancer risk. This is not only for women in the general population, but also for those with a family history and also, in particular, for BRCA2 mutation carriers.
Study 1: BRCA1/BRCA2 carriers
The recent publications from CIMBA have suggested that breast cancer susceptibility SNPs could be used to provide BRCA2, and possibly BRCA1, mutation carriers with more detailed information as to their breast cancer risk.27,132 The present study has confirmed that in BRCA2 mutation carriers there is a strong relationship between a woman’s SNPs profile and the age at which she develops breast cancer, but suggests that in BRCA1 mutation carriers the SNPs do not add further discriminatory information. Furthermore, it seems that in BRCA2 mutation carriers the overall breast cancer risk scores derived from the CIMBA-validated SNPs only with the adjusted weightings for BRCA2136 are no better at predicting risk than the weightings from all 18 SNPs from the general population of breast cancer in Turnbull et al.,131 including the nine SNPs validated in the CIMBA study and three SNPs that have not been shown to increase risk in BRCA2 mutation carriers.
In BRCA1 mutation carriers, the median age at the development of breast cancer varies with risk group, but there was no trend for later age at diagnosis with lower risk score (see Table 19). Furthermore, there was considerable overlap between the 95% CIs for the respective risk groups. There are a number of possible explanations for this. First, it may be that the RAFs used are inappropriate as they relate to the general population rather than to BRCA1 carriers. Second, as we saw no improvement in the predictive ability of our risk model when only BRCA1-validated SNPs (TOX3, 2q, 6q25.1) were included, it may be that too small a proportion of the variation in time to the development of breast cancer in this population is explained by the SNPs that have been validated in BRCA1 carriers so far (i.e. we need to find more BRCA1-validated SNPs or increase the study size considerably). Third, it may be that in BRCA1 carriers the modifying effect of the SNPs (individually or jointly) on age at the development of breast cancer is very much smaller than in BRCA2 carriers or the general population so that, again, our study lacks sufficient power.
In BRCA2 mutation carriers, however, for the overall breast cancer risk scores based on either 18 or 15 SNPs, there was a clear trend for an increased age at diagnosis with decreasing risk scores (see Table 2). For example, in the highest-risk group, 7% of women (based on 18 SNPs) had developed breast cancer by the age of 30 years and 92% had developed breast cancer by the age of 70 years, whereas in the lowest-risk group the corresponding figures were 2% and 77%, respectively. Thus, there is clearly information in the overall breast cancer risk score that might be useful to both clinicians and women with BRCA2 mutations. Our results on cumulative incidence must be interpreted with caution, as there is substantial testing bias towards young women affected with breast cancer. Unfortunately, we do not have access to samples on a large proportion of unaffected close relatives and can test only those who have come forward for clinical predictive testing. As a result, the cumulative risks to 70 years would be predicted to be substantially lower in an unaffected woman tested aged 20 years. In reality, the predicted risks can be used from the range provided by Antoniou et al.,136,137 and even this may widen as more validated SNPs are added. The performance of the Cox model to predict the order in which a pair of women would develop breast cancer was disappointing but not surprising, given the overlap between the risk groups as regards age at diagnosis.
Estimates of breast cancer risk can vary considerably between family-based studies5,64 and population-based studies,143–145 especially for BRCA2. This difference in risk could be partly explained by low-risk genetic variants, such as the SNPs identified in GWAS. The current analysis validates the work of CIMBA and suggests that use of SNPs with the BRCA2-related weightings137 or the Turnbull weightings131 can be used to advise women within a range of breast cancer lifetime risks of between 42% and 96%. Clinicians could use the SNP multiplicative risk alongside family history of breast cancer and other risk factors to give a better indication of where their risk is likely to lie in this range. We have previously shown that decisions regarding risk-reducing surgery are driven by counselled risk.146 Although some of the present sample set was used to derive the initial large-scale study of validation in BRCA2,137 we are not aware of any genetics centres using SNPs. Validation in a smaller overlapping set does show that the risk differences are meaningful even between the bottom and top 20% of samples. Therefore, we believe the time is right to consider the use of SNP-adjusted penetrance estimates and that this is likely to affect decision-making in women with BRCA2 mutations.
Conclusions
The 18 validated breast cancer susceptibility SNPs identified through GWAS96 differentiate the risks of breast cancer between women with BRCA2 mutations, but not between those with BRCA1 mutations. There is little difference in the altered risks when validated susceptibility SNPs or a mixture of validated and unvalidated SNPs are factored in. Although further studies would be useful in confirming and refining the risk effects of the SNPs, it may now be appropriate to use these SNPs to help women with BRCA2 mutations make maximally informed decisions about their management options.
Study 2: PROCAS (population modelling)
In order to assess whether or not there are substantial interactions between existing risk factors including family history and MD and the 18SNP gene test, it was necessary to model this using population data. This is particularly important, as family history clearly has a strong genetic component, and MD also is thought to have a 60% heritable component. We carried this out on nearly 1000 samples (n = 993) and showed that the 18SNP test was effectively independent of existing risk factors in TC and MD as measured by a VAS.
The range of 10-year risks identified by the TC programme in the first 10,000 women in PROCAS is quite narrow, with 43.2% of all women having a 10-year risk of between 2% and 3%.141 These risks were calculated from family history information as well as from standard reproductive risk factors, but when risk information from SNPs was added to that from the TC model, a wider spread was generated, suggesting that adding SNPs to the TC model might lead to better discrimination. Two other studies, using seven147 and 15 susceptibility SNPs,148 also found no association between being assessed as high risk using one of the established breast cancer risk prediction models, such as the Gail149,150 and TC models,11 and being assessed as high risk based on SNPs. The addition of SNP information to the Gail model led to better discrimination,147,151 although the magnitude of the improvement was small; for one study,147 the area under the curve (AUC) increased from 0.557 to 0.594 with the addition of SNPs to the classic Gail risk model (p < 0.001) and, for the other, adding seven SNPs to the National Cancer Institute’s Breast Cancer Risk Assessment Tool increased the AUC from 0.607 to 0.632.151 Although significant, these effects are relatively modest and still result in AUCs which are not of a high value. The fact that there is little association between the three methods of assessing breast cancer risk (percentage dense area, TC model and SNPs) is promising, as it suggests that the addition of MD and SNPs to the TC model may lead to improved overall performance (by adding new, independent, information). The issue of how information on MD and SNPs might be used to further develop the TC model will be explored in detail, and the predictive ability of the expanded model assessed, when the data from this study are suitably mature and a sufficient number of breast cancers have occurred.
We have also shown that the assessment of MD can be incorporated into routine screening practice. It is likely that addition of MD to standard risk factors and DNA testing will further improve the precision of risk assessment, although, ideally, this will involve an automated measure of MD that can be made on digital mammograms that are now carried out in many areas of the NHSBSP. Ultimately, the incorporation of risk SNP results and MD into current risk prediction models will require further ongoing research and the maturation of prospective data from this and other cohorts. The performance of this, and existing risk prediction models, is currently being assessed, as the PROCAS study now has sufficient follow-up data. However, we are hoping to boost the number of prospective breast cancers with DNA above the current 398, and some cases are yet to be genotyped.
We also carried out modelling work to assess the potential impact of moving from the 18SNP test to a 67SNP test. Our data suggest that, although the spread in towards high risk currently achieved by SNP67 is not as large as that obtained from classical phenotypic markers, SNPs may add substantially to classic factors when used together.
Study 3: phenocopies
In a prospective analysis of the excess risk of breast cancer in women testing negative for a family BRCA1/BRCA2 mutation, we found excess risk to be confined to BRCA2 non-carriers with an observed to expected ratio of 4.57-fold (95% CI 2.50 to 7.67; p < 0.0001) (O : E in BRCA1 non-carriers 1.77).152 Increased risk was seen especially in BRCA2 families with high incidence of breast cancer (Manchester BRCA2 score of > 10), potentially implicating unlinked genetic modifiers causing this excess. Genotyping of 18 breast cancer susceptibility SNPs defined a RR of 1.31 for BRCA2 breast cancer phenocopies with a breast cancer diagnosis aged < 60 years. In this case, unaffected women in BRCA2 mutation-positive families might be expected to have a protective profile with a SNP RR < 1.0. However, we did not find this, suggesting that there is a bias towards higher allele frequencies of risk SNPs in the BRCA2 mutation-positive families. This then infers that selection of families for mutation screening also selects for higher SNP scores, irrespective of the subsequent BRCA2 mutation status. For BRCA1, there was little effect of the SNPs, with affected carriers having a lower RR than unaffected individuals. The 18 SNPs appear to contribute to the higher rate of breast cancer for those testing negative in BRCA2 families, although there must be other factors involved. At present, the 18 SNPs are considered to account for no more than 10% of the familial component of breast cancer.27
FH-Risk single nucleotide polymorphisms
This analysis has suggested that a SNP18 score may be added to the TC model by treating them as independent, for individuals who have not tested positive for BRCA1 mutations. Some points for discussion include the following. The study design, matching by age at diagnosis or last mammogram prior to diagnosis, differs from the International Breast Cancer Intervention Study I (IBIS-I) case–control study for SNPs, in which controls were matched by age at baseline and length of follow-up. An advantage of the present case–control design is that age at baseline is not matched out, so one may estimate the performance of risk models that include age as a factor.
Overall SNP18 improves the AUC with TC from 0.59 to 0.62 and, therefore, in non-BRCA1-related risk appears to add useful discrimination.
Conclusions
Our study in four different populations has shown that addition of the SNP18 improves the discrimination of breast cancer risk. This appears particularly effective in non-BRCA family history-positive cases (FH-Risk) and in the general population (PROCAS). However, our assessment has shown that this is not yet useful in BRCA1 carriers. This may be because SNP18 includes only a small number of SNPs that are associated with oestrogen receptor-negative breast cancer. The overall effects of adding SNPs to risk models are still relatively modest, with AUC scores which are still relatively low. Modelling as part of our study has shown that further benefit may be achieved by adding the additional SNPs with lower RRs identified in 2013 as part of the ICOGS initiative.
Publications resulting from work in Chapter 3
Evans DG, Ingham SL, Buchan I, Woodward ER, Byers H, Howell A, et al. Increased rate of phenocopies in all age groups in BRCA1/BRCA2 mutation kindred, but increased prospective breast cancer risk is confined to BRCA2 mutation carriers. Cancer Epidemiol Biomarkers Prev 2013;22:2269–76.152
Howell A, Astley S, Warwick J, Stavrinos P, Sahin S, Ingham S, et al. Prevention of breast cancer in the context of a national breast screening programme. J Intern Med 2012;271:321–30.153
Evans DG, Warwick J, Astley SM, Stavrinos P, Sahin S, Ingham SL, et al. Assessing individual breast cancer risk within the UK National Health Service Breast Screening Programme: a new paradigm for cancer prevention. Cancer Prev Res (Phila) 2012;5:943–51.141
Ingham SL, Warwick J, Byers H, Lalloo F, Newman WG, Evans DG. Is multiple SNP testing in BRCA2 and BRCA1 female carriers ready for use in clinical practice? Results from a large Genetic Centre in the UK. Clin Genet 2013;84:37–42.140
Brentnall AR, Evans DG, Cuzick J. Distribution of breast cancer risk from SNPs and classical risk factors in women of routine screening age in the UK. Br J Cancer 2014;110:827–8.154
Brentnall AR, Evans DG, Cuzick J. Value of phenotypic and single-nucleotide polymorphism panel markers in predicting the risk of breast cancer. J Genet Syndr Gene Ther 2013;4.155
Publication Details
Copyright
Included under terms of UK Non-commercial Government License.
Publisher
NIHR Journals Library, Southampton (UK)
NLM Citation
Evans DG, Astley S, Stavrinos P, et al. Improvement in risk prediction, early detection and prevention of breast cancer in the NHS Breast Screening Programme and family history clinics: a dual cohort study. Southampton (UK): NIHR Journals Library; 2016 Aug. (Programme Grants for Applied Research, No. 4.11.) Chapter 3, Project 2: assessment of predictive value of new genetic variants.

%2C%20based%20on%20the%2018%20SNPs%20from%20Turnbull%20et%20al.&p=BOOKS&id=379496_11-77-38-fig9.jpg "Click on image to zoom")
%2C%20based%20on%20the%20three%20validated%20SNPs%20from%20Antoniou%20et%20al.&p=BOOKS&id=379496_11-77-38-fig10.jpg "Click on image to zoom")
%20based%20on%20the%2018%20SNPs%20from%20Turnbull%20et%20al.&p=BOOKS&id=379496_11-77-38-fig11.jpg "Click on image to zoom")
%2C%20based%20on%20the%20nine%20validated%20SNPs%20from%20Antoniou%20et%20al.&p=BOOKS&id=379496_11-77-38-fig12.jpg "Click on image to zoom")
%2C%20and%20predicted%20breast%20cancer%20risk%20based%20on%20the%20SNPs%20alone%20(assuming%20that%20each%20woman%20has%20average%20breast%20cancer%20risk)%20for%20the%20993%20women%20who%20provided%20DNA%20samples.&p=BOOKS&id=379496_11-77-38-fig13.jpg "Click on image to zoom")
%2C%20and%20predicted%20breast%20cancer%20risk%20from%20the%20TC%20model%20(crudely%20adjusted%20to%20take%20account%20of%20individual%20SNPs)%20for%20the%20993%20women%20who%20provided%20DNA%20samples.&p=BOOKS&id=379496_11-77-38-fig14.jpg "Click on image to zoom")