| 3D Macromolecular Structures |
|
|
| |
|
To receive e-mail news about changes to the Molecular Modeling Database and its associated resources, subscribe to the structure-announce@ncbi.nlm.nih.gov mailing list by completing a brief form or sending an e-mail message with the word subscribe in the subject line to structure-announce-request@ncbi.nlm.nih.gov.
|
| |
iCn3D 3.0 released
[17 MAY 2021] Batch Process of 3D Structures Using iCn3D.
With the recent release of "icn3d" package at npm and iCn3D 3.0, you can write Node.js scripts to call functions in icn3d. These scripts can be run in the command line to process a list of 3D structures to get annotations. For example this script calculates the change in interactions due to a mutation. The classes and functions are listed at iCn3D Doc.
To find icn3d functions, you can first generate a custom view in iCn3D interactively. For example, you can click the menu "Analysis > Mutation" to see the "Interactions" of the mutations "6M0J_E_501_Y". Then you can click the menu "File > Share Link" to see the commands in the section "Original URL with commands". Most commands are processed with functions in the file "applyCommand.js". Other commands with asynchronized retrieval are processed in the file "loadScript.js".
Since the JavaScript code of iCn3D was upgraded from ES5 to ES6, the embedding of iCn3D has some changes.
|
| |
|
iCn3D publication in Bioinformatics describes features and applications of web-based 3D viewer
[20 JUN 2019] An article by Wang J., et al., describes the features and applications of iCn3D, NCBI's web-based 3D viewer, and provides examples of its use for interactive structural analysis:
- Wang J, Youkharibache P, Zhang D, Lanczycki CJ, Geer RC, Madej T, Phan L, Ward M, Lu S, Marchler GH, Wang Y, Bryant SH, Geer LY, Marchler-Bauer A. iCn3D, a Web-based 3D Viewer for Sharing 1D/2D/3D Representations of Biomolecular Structures. Bioinformatics. 2019 June 20; pii: btz502. doi: 10.1093/bioinformatics/btz502. [Epub ahead of print] [PubMed PMID: 31218344] [Full Text at Oxford Academic]
|
| |
|
|
|
|
| |
| |
|
iCn3D 2.22.0 released
[30 NOV 2020] iCn3D 2.22.0 is now available on NCBI web servers and from GitHub (https://github.com/ncbi/icn3d). With the recent release of iCn3D 2.22.0, users can now visualize consequences of non-synonymous sequence variation and alternate between 3D views for wild type and substituted side-chains for selected SNPs, as in this example. In the "Sequences & Annotations" window, which is accessible in the menu "Analysis > View Sequences & Annotations", users can click the tab "Details" and the checkbox "SNPs" or "ClinVar" to see known sequence variation, if available. The mouseover on SNPs/ClinVar residues with 3D-stucture shows three buttons: "3D with scap", "Interactions", and "PDB", which allow users to alternate between the wild type and mutant structures, alternate between their interactions, or download their coordinates. When users click "Interactions", the 2D interaction network window also pops up to show the change of interactions, which are shown in different colors. The coordinates of the mutant are predicted dynamically with the scap web service, which is converted from the scap program (http://honig.c2b2.columbia.edu/scap). The web service takes the coordinates of the residues within 10 angstrom from the SNP, uses rotamer libraries to predict the side chain conformation, and outputs the coordinates of the mutant and the neighboring residues. Another new feature dynamically computes and displays a selected protein's internal pseudo-symmetry, as in this example. The symmetry is calculated with the symd web service, which is converted from the SymD program (https://symd.nci.nih.gov/).
|
|
iCn3D 2.20.0 released
[07 OCT 2020] iCn3D 2.20.0 is now available on NCBI web servers and from GitHub (https://github.com/ncbi/icn3d). Users can now view the electrostatic potential map for any subset of 3D structures within 30,000 atoms. The potential is calculated using the DelPhi program by solving linear Poisson-Boltzmann equation. Users can show the potential on surface or show equipotential map. The potential map shows the effect of charges on molecular interactions qualitatively. This example shows the electrostatic potential for the binding of Gleevec to Abl2. The ligand shows the -25 mV (red) and +25 mV (blue) equipotential map with a grid size 65, salt concentration 0.15 M, and pH 7. The protein shows the surface potential with a gradient from -75 mV (red) to +75 mV (blue). This new feature can be accessed from the menu "Analysis > DelPhi Potential". Users can also download the PQR file format with assigned partial charges.
Other recently introduced features include:
More features are listed and described at /Structure/icn3d/icn3d.html
|
| |
|
iCn3D 2.18.0 released
[22 JUL 2020] iCn3D 2.18.0 is now available on NCBI web servers and from GitHub (https://github.com/ncbi/icn3d). Users can view SNPs of the 2019-nCov structures in the "Sequences & Annotations" window. Users can also access the 2D Interaction Network and 2D Interaction Map for protein-ligand or protein-protein interaction by selecting the menu "View > H-Bonds & Interactions".
Another new feature is "icn3dpy", a Jupyter Notebook widget of iCn3D, which enables data scientists to use iCn3D in a Jupyter environment. Users can view a predefined display or create a custom view directly in the Jupyter Notebook. As an example the SNPs of the 2019-nCov spike (S) glycoprotein were viewed using a Jupyter Notebook and saved here as HTML.
|
| |
|
iCn3D 2.15.0 released
[21 APR 2020] iCn3D 2.15.0 is now available on NCBI web servers and from GitHub (https://github.com/ncbi/icn3d). To view the updated web application, retrieve any structure of interest from the Molecular Modeling Database (MMDB), open its structure summary page, and click the button for "full-featured 3D viewer" in the molecular graphic. For example, retrieve structures that contain the term SARS-COV-2, click on a structure of interest to open its summary page, then follow the link for "full-featured 3D viewer." Alternatively, open iCn3D and use the "File" menu to retrieve a structure by its ID (for example, enter 2DD8 to load the crystal structure of Sars-Cov Spike Receptor-Binding Domain Complexed With Neutralizing Antibody) or to open a structure file on your local computer. A gallery with live examples demonstrates a variety of ways in which iCn3D can be used to view and analyze structures. The iCn3D Web APIs document describes how to use the iCn3D structure viewer in your own web page.
The gallery with live examples now includes COVID-19-related structures:
New features in this iCn3D release include the ability to:
- Apply custom colors to individual residues by using the iCn3D menu option for "Color > Residue > Custom."
- Add "Custom Color" for any chain in the "Sequences & Annotations" window.
- Add multiple sequence alignments as tracks when clicking "Add Track" in the "Sequences & Annotations" window.
- Show the same structure "Side by Side" in two views in the "View" menu. Each view has the same orientation, but can have an independent 3D display. One example is shown in the gallery, where each view shows one of the aligned structures.
- Realign two structures or two chains by using the iCn3D menu option for "File > Realign," if you want to view an alignment that is different than the one generated by VAST+ or by dynamic chain alignment. Specifically, the "Realign" option enables you to select residues of interest and to realign the structures or chains on those residues.
For example, some chains, such as 6ACK_C and 6M0J_E don't align well using dynamic alignment. Using the "Realign" function, you can select those two chains, which are then aligned based on their sequence data. The 3D coordinates of the residues in the sequence alignment are then used to generate a new structure alignment.
- The Change Log section of the iCn3D Web API help document lists additional enhancements that have been made to iCn3D since its original release.
|
| |
|
iCn3D 2.10.0 released
[05 DEC 2019] iCn3D 2.10.0 is now available on NCBI web servers and from GitHub (https://github.com/ncbi/icn3d). To view the updated web application, open iCn3D and use the "File" menu to retrieve a structure by its ID or to open a structure file on your local computer. A gallery with live examples demonstrates a variety of ways in which iCn3D can be used to view and analyze structures. The iCn3D Web APIs document describes how to use the iCn3D structure viewer in your own web page.
New features in this release include:
- Show each hydrogen bond and contact in 3D using the menu "View > H-Bonds & Interactions".
- Display membranes for transmembrane proteins using data from Orientations of Proteins in Membranes (OPM). The feature is available from the iCn3D menu option for "File > Retrieve by ID > OPM PDB ID".
- Display/output salt bridges; color helices and sheets with spectrum in the menu "Color > Secondary > Spectrum".
- Enabled the mobile style menu with the URL parameter "mobilemenu=1".
- Added "Label Scale" in the View menu to scale all labels.
- Improved the display of binding sites with fog and slab.
- Align any sequence to a hit structure by clicking "Align > Sequence to Structure" in the File menu.
- The Change Log section of the iCn3D Web API help document lists additional enhancements that have been made to iCn3D since its original release.
|
| |
|
Multi-character identifiers for sequences with 3D structures from the PDB
[01 APR 2019] Advances in experimental methods permit the three-dimensional (3D) structure determination of ever larger biomolecular assemblies. To accommodate this, the RCSB Protein Data Bank (PDB) relaxed their constraint that individual biopolymers (proteins and nucleotide sequences) in 3D macromolecular structure records are labeled by a single character. Specifically, a biopolymer identifier may now be up to four characters long.
- This change has required NCBI to revise how it treats PDB-derived sequence records.
- The initial and most visible impact will appear in the release of BLASTDBv5 (see BLAST announcement), which will support multi-character identifiers for PDB-derived sequences. But any software, from NCBI or created elsewhere, that assumes a one-character PDB chain identifier will be affected.
- These changes will also impact the Molecular Modeling Database (MMDB), which is derived from PDB, and the related structure services. More details about how NCBI structure services are affected will be provided on this page once multi-character identifiers are fully implemented in MMDB.
|
| |
|
iCn3D 2.6.0 released
[19 MAR 2019] iCn3D 2.6.0 is now available on NCBI web servers and from GitHub (https://github.com/ncbi/icn3d). To view the updated web application, see the example structures below, or use iCn3D's "File" menu to retrieve a structure by its ID or to open a structure file on your local computer. The iCn3D Web APIs document describes how to use the iCn3D structure viewer in your own web page.
New features in this release include:
- It is now possible to align a protein sequence to a 3D structure that contains a similar protein sequence. This can be done by opening the "File" menu and selecting "Align > Sequence to Structure." The resulting dialog box enables you to enter (a) the Sequence ID (or FASTA sequence) of the query protein, and (b) the identifier of a structure-based protein that was found by a BLAST search with a query protein against the Protein Databank Proteins (pdb).
- As an example, open the iCn3D display of NP_001108451 aligned to 1TSR_A. This shows the human tumor protein 63 isoform 3 (NP_001108451) aligned to the 3D structure of protein chain A from the P53 core domain in complex with DNA (1TSR_A).
- The default color scheme for sequence-structure or structure-structure alignments is color by sequence "Conservation."
- The Change Log section of the iCn3D Web API help document lists additional enhancements that have been made to iCn3D since its original release.
|
| |
|
iCn3D 2.5.0 released
[31 JAN 2019] iCn3D 2.5.0 is now available on NCBI web servers and from GitHub (https://github.com/ncbi/icn3d). To view the updated web application, see the example structures below, or use iCn3D's "File" menu to retrieve a structure by its ID or to open a structure file on your local computer. The iCn3D Web APIs document describes how to use the iCn3D structure viewer in your own web page.
New features in this release include:
- Electron microscopy (EM) maps can now be displayed for any subset of a structure that was determined by EM (example: 6ENY), to supplement the electron density maps that became available in iCn3D 2.4.0 for structures determined by X-ray crystallography (example: 3GVU).
- A new annotation, Disulfide Bonds, is now available in the Sequences and Annotations window.
- Non-standard biopolymers, such as nucleotide or protein sequences that contain a large percentage of non-standard residues, are now displayed as parallelograms in iCn3D's 2D window (interactions schematic). As an example, open the structure for 4GLS in iCn3D. Click on any icon in the interactions schematic to highlight the corresponding molecule in the 3D window (molecular graphic) and to display only that molecule in the 1D window (sequences and annotations). Use Control+click to highlight multiple molecules in the 2D and 3D windows, and to show all of the selected molecues in the 1D view.
- The Change Log section of the iCn3D Web API help document lists additional enhancements that have been made to iCn3D since its original release.
|
| |
|
Updated MMDB structure summary pages featuring faster load times
[24 JAN 2019] The Molecular Modeling Database (MMDB) structure summary pages have been revised to use Scalable Vector Graphics (SVG) to draw the interactions schematic and the protein annotations in the table of molecular components, improving the backend response time and the page load time. The interactions schematic has also been enhanced to include a new icon (parallelogram ) for non-standard biopolymers, an option to remove chemicals from the display, and the ability to move icons in the interactions schematic.
As an example, view the MMDB summary page for 4GLS
"Crystal Structure of Chemically Synthesized Heterochiral {D-Protein Antagonist plus VEGF-A} Protein Complex in space group P21."
The MMDB help document provides additional information about structure summary pages, including an illustrated example.
|
|
|
iCn3D 2.4.0 released
[17 DEC 2018] iCn3D 2.4.0 is now available on NCBI web servers and from GitHub (https://github.com/ncbi/icn3d). As an example of the updated web application, open the structure for 1TUP: Tumor Suppressor P53 Complexed With Dna on the web, or use iCn3D's "File" menu to retrieve a structure by its ID or to open a structure file on your local computer. The iCn3D Web APIs document describes how to use the iCn3D structure viewer in your own web page.
New features in this release include:
- An option to display an electron density map for any subset of a crystal structure is now available from the iCn3D "Style" menu.
- The iCn3D PNG image file, which is generated by the "File > Save Files > iCn3D PNG Image" menu option, now includes both a static image of the structure and a URL that captures the series of iCn3D commands (e.g., selections, styles, colors, position) that were used to customize the structure before it was saved. As a result, the PNG file can either be viewed as a static image (if opened in photo viewing software), or as an interactive 3D structure (if opened in iCn3D using the "File > Open File > iCn3D PNG Image" menu option). The URL that is saved as part of the iCn3D PNG Image file is the same as the URL produced by iCn3D's "File > Share Link" menu option.
- Gene symbols are now displayed in the "Sequences and Annotations" window.
- The Change Log section of the iCn3D Web API help document lists additional enhancements that have been made to iCn3D since the release of iCn3D 2.0 in April 2018.
|
| |
|
iCn3D 2.0 released
[17 APR 2018] iCn3D 2.0 is now available on NCBI web servers and from GitHub (https://github.com/ncbi/icn3d).
New features in this release include:
- A new "Sequences and Annotations" window is accessible from the iCn3D "Windows" menu, and has replaced the previous "Sequences" window.
- A variety of biological annotations are now available, such as clinically significant sequence variations (ClinVar), single nucleotide polymorphisms (SNPs), 3D domains, conserved domains, functional sites, interaction interfaces, and more, and can be viewed on both the sequence data and the corresponding 3D structure.
- As an example, open a view of the 1TUP: Tumor Suppressor P53 Complexed With DNA, customized to display ClinVar data and functional sites in the "Sequences and Annotations window."
- The "Summary" tab in the "Sequences and Annotations" window shows a graphical summary of the annotations you choose to view. Click the name of an annotation track (e.g., ClinVar) to highlight all annotations from that track on the corresponding 3D structure.
- The "Details" tab shows the annotations mapped onto the sequence data. Click on individual residues in the sequence to view their position in the 3D, and mouse over the annotations in the "Sequences and Annotations" window to read more about the individual annotations and/or link to related information in other databases.
- 3D printing is now available in the "File" menu
- This option exports both Stereolithography (STL) and Virtual Reality Modeling Language (VRML) files for 3D printing.
- A "Search" button is located near the top-right corner of iCn3D, and enables you to enter one-letter IUPAC codes for sequence residues, to find them within the sequence data and 3D structure.
- As an example, open the structure for 1TUP: Tumor Suppressor P53 Complexed With DNA and:
- Enter R in the "Search" box to find all arginine residues, or
- Enter RLG to find all regions of sequence that contain an arginine, leucine, and glycine adjacent to each other.
- The ambiguity code of X can be used to represent any amino acid, so a search for RXLG will find all regions of sequence that contain an arginine, followed by any amino acid, and then followed by leucine and glycine.
- The sequence residues that you searched for will be highlighted in the 3D structure, 2D interaction schematic, and 1D sequence windows.
- The "View Only Selection" option in the "View" menu refreshes all iCn3D windows (3D structure, 2D interactions schematic, and 1D sequences and annotations) to show only the objects you have selected.
- As an example, open the structure for 1TUP: Tumor Suppressor P53 Complexed With DNA and:
- Use CTRL+click to select proteins 1TUP_A and 1TUP_C from either the "Sequences and Annotations" (1D) window, or from the "Interactions" (2D) window.
- Use the "View > View Only Selection" menu option to display only the selected proteins in all windows, including in the molecular graphic (3D) window.
- Use the "View > Reset > All" menu option to revert back to the original view in the 3D window
- Reload the iCn3D page to revert to the original view in all windows (3D, 2D, and 1D).
- The "Defined Sets" option in the "Select" menu is a combined version of the previous "Advanced", "Structure", "Chain", "Custom" menus.
- By default, the "Select Sets" window (that appears when you choose the "Select > Defined Sets" menu option) lists each protein and nucleotide molecule in the structure, allowing you to select one or more individual biomolecules. It also provides an option to select all "ions," "nucleotides," or "proteins" in the structure.
- You can also add custom sets to the "Select Sets" window, if desired. To do this:
- Open the "Details" tab in the "Sequences and Annotations" window, select items of interest (e.g., individual amino acids from a protein molecule)
- Enter the name and description of the selected data set in the "Selection: Name" and "Description" text boxes.
- Click the "Save" button
- The name of the custom set will then appear in the "Select Sets" window.
- The custom set can also be be used in conjunction with iCn3D options such as "View > View Selection Only," "Style," and "Color," allowing you to isolate the custom set in all iCn3D windows, and/or to render it in the desired style. It can also be saved for future use via the "File > Save Files > State File" menu option.
|
| |
|
iCn3D 1.2.0 released
[17 AUG 2016] iCn3D 1.2.0 is now available on NCBI web servers (/Structure/icn3d/icn3d.html) and on GitHub (https://github.com/ncbi/icn3d). New features in this release include:
- an interactions schematic (2D view) that is available when a structure is loaded as an MMDB file. It can be used to select/highlight molecular components (illustrated example) or interaction interfaces (illustrated example)
- calculation of secondary structures if the input PDB file does not define secondary structure information
- previous files src/icn3d.js, src/full_ui.js, and src/simple_ui.js have been separated into small files
The iCn3D help document provides additional details about the viewer, including examples of how iCn3D can be used.
|
| |
|
New version of VAST+ released
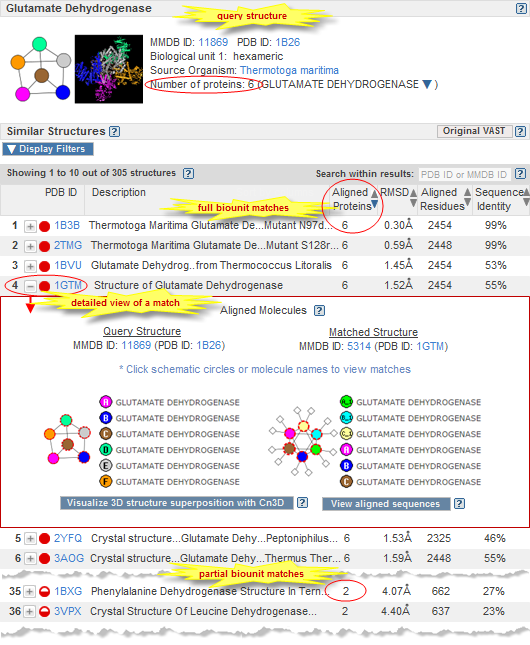
[27 JUL 2016] A new version of VAST+ was released. It provides a refined structure-based alignment of similar macromolecular complexes, and displays the 3D superpositions in the recently released iCn3D, a WebGL-based structure viewer. The initial alignment of similar macromolecular complexes, which became available with the first release of VAST+, uses the complete set of individually aligned macromolecules and corresponding matching amino acids to calculate a superposition of the complex structures. In contrast, the new release of VAST+ identifies a subset set of amino acids that have highly similar 3D positions in the query and subject complex structure, and uses it to create a refined alignment that allows identification and visualization of the most similar portion of the structures (the structurally invariant core of the assembly), as well as the differences between the structures.
|
| |
|
iCn3D 1.0 is now available
[28 APR 2016] iCn3D 1.0 is now available. It is a new WebGL-based viewer for interactive viewing of three-dimensional macromolecular structures on the web, without the need to install a separate application, and enables you to:
- interactively view 3D structures and corresponding sequence data
- interactively view superpositions of similar structures
- cutomize the display of a structure and generate a URL that allows you to share the link
- incorporate iCn3D into your own pages
An example of each is accessible from the "About iCn3D" page.
iCn3D can be accessed from the molecular graphic that appears on the structure summary page for any record in the Molecular Modeling Database (MMDB).
As an example, view the MMDB summary page for the Tumor Suppressor P53 Complexed with DNA (1TUP). Click on the spin icon  in the molecular graphic to open the structure in the basic version of iCn3D, or click on the launch icon in the molecular graphic to open the structure in the basic version of iCn3D, or click on the launch icon  to open the structure in the advanced (full feature) version of iCn3D in a separate window. to open the structure in the advanced (full feature) version of iCn3D in a separate window.
You can also access the advanced version of iCn3D directly at /Structure/icn3d/full.html, where you can use the "File" menu to retrieve a structure by its ID or to open a structure file on your local computer.
The source code is available from GitHub (https://github.com/ncbi/icn3d) for developers who would like to customize the program and/or contribute code, and for users who would like to run the program on their local computer.
|
|
|
New structure summary pages featuring interactive molecular graphic
[28 APR 2016] MMDB structure summary pages have been revised to feature interactive molecular graphics using iCn3D, a new WebGL-based viewer for three-dimensional macromolecular structures. A spin icon in the molecular graphic loads a basic version of iCn3D into the web page, enabling you to render the structure in the desired style and highlight molecules of interest by clicking on the corresponding interactions schematic. A launch icon opens the advanced (full feature) version of iCn3D in a separate window. As an example, view the MMDB summary page for Tumor Suppressor P53 Complexed With DNA (1TUP). Additional information is available in the MMDB help document and the About iCn3D page.
|
|
|
VAST+ released! Find 3D structures with similar macromolecular complexes
[06 DEC 2013] VAST+ is a new tool designed to identify macromolecules that have similar 3-dimensional structures, with an emphasis on finding similar macromolecular complexes. The similarities are calculated using purely geometric criteria, without regard to sequence similarity, and therefore can identify distant homologs. VAST+ is built upon the original Vector Alignment Search Tool (VAST), and expands the capabilities of that program by taking into account the biological unit ("biounit") of each structure, not just individual protein molecules or their substructures. A recent publication provides details and the VAST+ help document includes a comparison of original VAST and VAST+, as well as examples of how can VAST+ be used to learn more about proteins. (Please note: in order to view the 3D superpositions of similar biological units, you must install the most recent version of the NCBI molecular viewing software, Cn3D 4.3.1.)
|
| |
|
Cn3D 4.3.1 now available
[06 DEC 2013] A new version of NCBI's macromolecular structure viewing program, Cn3D 4.3.1, is now available (download). New features include the ability to view superpositions of 3D structures that have similar biological units, as identified by the newly released VAST+, an enhanced version of the Vector Alignment Search Tool (VAST). In addition, Cn3D 4.3.1 now uses the MIME type: application/vnd.ncbi.cn3d. Up to version 4.3, Cn3D used the MIME type: chemical/ncbi-asn1-binary.
|
| |
|
Merged PDB split files: View large macromolecules in their entirety
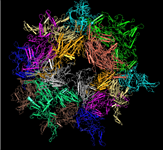
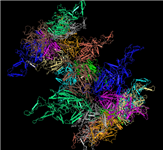
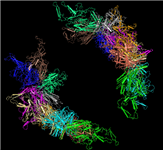
[25 JUL 2012] It is now possible to interactively view and/or download large macromolecular structures in their entirety, such as the viral capsid illustrated below, the rat liver vault, and the ribosome structure by Nobel Laureate V. Ramakrishnan, and more. These and approximately 150 other large macromolecular structures exceed the size limits implicit to the PDB file format and are therefore split into several PDB files. The MMDB data processing procedure merges the files into a single structure record, and the merged files can be viewed interactively with Cn3D 4.3 (install). You can also retrieve all merged files, if desired.
| |
PDB SPLIT FILES for the
Adeno-associated Virus Serotype 6 (Aav-6) |
 |
MMDB MERGED FILE |
| PDB ID: 1VU0
|
PDB ID: 1VU1
|
PDB ID: 3TSX
|
|
MMDB ID: 99554 |
 |
 |
 |
|
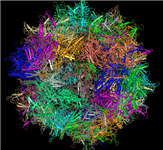
Click on the thumbnail image above to open the merged file in Cn3D 4.3 and interactively view the entire structure and its sequence data. |
|
|
|
|
|
Entrez Structure interface redesign
[25 JUL 2011] NCBI's Structure database now has a revised home page, search interface, and search results display, to have functions similar to those available in PubMed. Changes include: (a) a streamlined home page with links to related resources; (b) an "Advanced Search" page, which provides the ability to build a query one term at a time, browse the index of any search field, and combine earlier searches; and (c) new search results displays that provide links in the right margin to search filters, related data, and tools.
|
| |
|
Cn3D 4.3 now available
[25 MAY 2011] A new version of NCBI's macromolecular structure viewing program, Cn3D 4.3, is now available (download). New features include the ability to view biological unit(s), including those containing molecules generated by applying transformations from crystallographic symmetry, side by side stereo views, additional alignment algorithms for editing multiple sequence alignments, new highlighting features, and more. It is similar to the Cn3D 4.2 preview release that was packaged with CDTree, but has been packaged as a standalone program and enhanced to handle the new Molecular Modeling Database (MMDB) data specification that now includes biological units and interactions.
|
| |
|
New structure summary pages featuring biological units and interactions
[09 MAY 2011] MMDB structure summary pages have been revised to display salient features of each structure, including its biological unit(s) and an interaction schematic depicting the interactions among the structure's molecular components, as in the human hemoglobin example below. The procedures to identify a structure's biological unit(s) and thresholds used to display interactions are described in the help document.
|
|
| |
|
Cn3D 4.2 preview available
[09 MAY 2011] A preview of a new version of NCBI's structure viewing program, Cn3D 4.2, is packaged together with the CDTree program (install). New features include:
- the ability to view the biological units identified within a structure, including those containing molecules generated by applying transformations from crystallographic symmetry
- side by side stereo views
- additional alignment algorithms for editing multiple sequence alignments
- new highlighting features
- more robust handling of sequence identifiers
|
| |
|
"Selected Structures" display in Entrez Structure search results
[03 JUN 2010] When you search the Entrez Structure (Molecular Modeling Database) database, a "Selected Structures" summary box now appears in the upper right corner of the search results page (for example, see the results of a search for p53 tumor suppressor). The "Selected Structures" box lists the top five protein domain families found among the retrieved structures, inferring protein function, as well as the top five organisms represented in the structures. It also provides easy access to various subsets of structure records in the search results, such as those composed of specific molecule combinations (e.g., protein-protein, protein-DNA, protein-chemical), and those with links to literature in PubMed or free full text in PubMed Central.
|
| |
|
Inferred Biomolecular Interactions Server (IBIS) publicly available
[18 AUG 2009] The NCBI Inferred Biomolecular Interactions Server (IBIS) server was made public. For a given protein sequence or structure query, IBIS reports physical interactions observed in experimentally-determined structures for this protein. IBIS also infers/predicts interacting partners and binding sites by homology, by inspecting the protein complexes formed by close homologs of a given query. To ensure biological relevance of inferred binding sites, the IBIS algorithm clusters binding sites formed by homologs based on binding site sequence and structure conservation. (read more about IBIS; additional publications)
|
| |
|
|
|