

NCBI Bookshelf. A service of the National Library of Medicine, National Institutes of Health.
Probe Reports from the NIH Molecular Libraries Program [Internet]. Bethesda (MD): National Center for Biotechnology Information (US); 2010-.
Potent inhibitors of lipid droplet formation
Jiwen Zou, Santhi Ganji, Ian Pass, Robert Ardecky, Mahesh Peddibhotla, Milan Loribelle, Susanne Heynen-Genel, Michelle Sauer, Ian Pass, Stefan Vasile, Eigo Suyama, Siobhan Malany, Arianna Mangravita-Novo, Michael Vicchiarelli, Danielle McAnally, Anton Cheltsov, Stonich Derek, Shenghua Shi, Ying Su, Fu-Yue Zeng, Anthony B. Pinkerton, Layton H. Smith, Sylvia Kim, Hung Ngyuen, Fu-Yue Zeng, Jena Diwan, Andrew J. Heisel, Rosalind Coleman, Patrick M. McDonough, and Thomas D.Y. Chung.
Author Information and Affiliations
Received: October 31, 2011; Last Update: May 13, 2014.
Non-alcoholic fatty liver disease (NAFLD) is prevalent (overall occurrence of ~20%) in the US adult population and is very commonly associated with obesity and diabetes (occurs in ~ 60% of diabetic patients). NAFLD presents as increased number and size of lipid droplets within the hepatocytes, and, if untreated, can progress to the inflammatory disease steatohepatitis and liver dysfunction. This probe report discloses the identification and optimization of two highly potent nanomolar, non-cytotoxic first-in-class small molecule chemical inhibitors of hepatic lipid droplet formation in murine AML-12 cells, that represent distinct chemical scaffolds: ML261 (IC50 = 69.7 nM), a thienopyrrole -5-caboxamide and ML262 (IC50 = 6.4 nM), a phenylthiophene-2-carboxamide. A novel high-content imaged based phenotypic assay that uses automated image processing to quantitate the inhibitory effect of compounds on the number and size of lipid droplets formed upon treatment of AML-12 murine hepatocyte cell cultures with oleic acid, after fixing and staining them with a lipophilic BODIPY due. These inhibitors appear to work downstream of lipid transporters, ... These inhibitors are much more potent than triacsin C (IC50 ~1 – 3 μM) in AML-12 cells (as determined from this work), which is a known inhibitor of long-chain acyl-CoA synthetase (ACSL) with potency against ACSL in Raji cell membrane fractions (~1 μM) or cell sonicates (2.6 – 8.7 μM). And as compared to more recent, cellularly active inhibitors ranging in potency from 2.5 to 100 μM. Surprisingly, these inhibitors appear to be exquisitely potent in AM12 murine hepatocytes but show little activity in the corresponding HuH7 or primary human hepatocyte cells, suggesting species-specific effects.
Assigned Assay Grant #: 1 R03 DA026213-01 (previously grant 1 R03 MH083261-01A1) (Cycle 8)
Screening Center Name & PI: Sanford-Burnham Medical Research Institute, John C. Reed, M.D., Ph.D.
Chemistry Center Name & PI: Sanford-Burnham Medical Research Institute, John C. Reed, M.D., Ph.D.
Assay Submitter & Institution: Patrick M. McDonough, Ph.D., Vala Sciences, Inc. (San Diego, CA)
PubChem Summary Bioassay Identifier (AID): 1658
Indirect Publications:
- http://www.ncbi.nlm.nih.gov/pmc/articles/PMC2872546/ - describing algorithrms used to quantitate Lipid droplets
- http://www.valasciences.com/reagents/lipid-droplet-screen-certified-cell-imaging-kit-z-05 – note Vala has commercialized a lipid droplet kit
- http://jbx.sagepub.com/content/15/7/798 - microRNA inhibitors of lipid droplet formation
Probe Structure & Characteristics
This Center Probe Report describes two inhibitors of lipid droplet formation, ML261 and ML262. Potency characteristics are summarized for these probes in the summary table.

| CID/ML#** | Target Name | AML12 IC50 (nM) [SID, AID] | Anti-target Name(s) | IC50/EC50 (μM) [SID, AID] | Fold Selective | Secondary Assay(s) Name: IC50/EC50 (nM) [SID, AID] |
|---|---|---|---|---|---|---|
| CID 9550710 ML261 | Lipid Droplets Formation in AML12 | 69.7 nM SID 103061845 AID 463191 | AML12 HCS cytotoxicity Index < 3 | >33 μM SID 103061845 AID 463200 | >477 X | AML12 cytotoxicity (by ATPLite™) >10,000 nM SID 103061845 AID 504443 |
| CID 20855303 ML262 | 6.4 nM SID 104222756 AID 463191 | >33 μM SID 104222756 AID 463200 | >520 X | AML12 cytotoxicity (by ATPLite™) >10,000 nM SID 103061845 AID 504443 |
Recommendations for scientific use of the probe
These novel compounds can be used by the larger research community to study the activities of key regulators of the hepatic lipid droplet biosynthetic pathway in mouse models of hepatic lipid droplet formation, to increase our currently incomplete understanding of how hepatic lipid droplet formation is regulated. These potent molecules may be further improved for their pharmacokinetic and pharmacodynamics properties to evaluate their potential therapeutic effects against fatty liver disease in mouse models. These two probes increase the limited armamentum of compounds that inibit lipid droplet formation beyond the currently available probes. Indeed, triacsin C, the inhibitor of long chain Acyl CoA Synthetase, which we used in our studies that led to the preliminary data for the original R03 proposal, remains one of relatively few chemicals known to inhibit this process. Notably, there have been recent advances in developing probes that inhibit the activity of diacylglycerol acyltransferases. This class of enzyme is responsible for linking fatty acids (presented to the enzyme as Co-A-fatty acid moieties) to diacylglycerol to form triacylglycerol. There is also an absence of such probes for fatty acid uptake/transport into cells, and hepatocytes, in particular. Finally, two protein kinase pathways have very recently been linked to hepatic steatosis, which include the Par-1a (aka MARKI3/C-TAK1) which is a member of the “Polarity Kinase” family. Mice in which Par-1a are knocked out are resistant to development of obesity and hepatic steatosis [1], and the mechanism may involve alterations in autophagy [2]. Additionally, inhibitors of c-Jun N-terminal kinase are proving to be protective against the development of non-alcoholic steatohepatitis (NASH) in rodents fed a high fat diet [3].
Thus, the compounds discovered in the present project to inhibit hepatic lipid droplet formation might well prove to be novel DGAT inhibitors, or inhibitors of fatty acid transport or the Par-1a or c-Jun N terminal kinase group. It is well worth emphasizing that the compounds discovered in this study are the most potent inhibitors of lipid formation ever identified in any cellular model. Thus, these compounds may have applications beyond fatty liver, including potential modulation of lipid load in tissues such as adipose and skeletal muscle. In fact, reduction of lipid load in non-hepatic tissue, especially skeletal muscle, is emerging as a prime therapeutic strategy in the management of diabetes, for example, as reducing lipid load in this tissue improves sensitivity to insulin. Thus, these compounds might represent a novel strategy towards anti-diabetic therapeutics.
1. Introduction
Specific Aims. (This probe report is derived from grant awarded during the earliest period of production phase of the Molecular Libraries Program, Cycle 8, and was also one of the first HCS screen of the full MLSMR collection at the time)
Fatty liver disease occurs in a very high percentage of the US human population (20% to 30% of the normal population and 60% to 70% of the obese and diabetic population) and is a common cause of liver dysfunction. Additionally, as the population grows more obese, the incidence of fatty liver disease is likely to increase, resulting in an even greater health cost. Thus, it is of utmost importance to increase our understanding of this disease and to identify compounds with potential therapeutic benefit against this affliction. Fatty liver disease is caused by the excessive formation of lipid droplets within hepatocytes. HuH-7 and AML12 are continuous cell lines derived from human and murine hepatocytes that maintain a high degree of hepatocyte-like characteristics. Both cell types form very consistent monolayers when cultured in high-throughput screening formats. Preliminary data indicate that lipid droplet levels increase HuH-7 and AML12 cells exposed to oleic acid (9-cis-oleic acid), a primary constituent of olive oil. Oleate-induced lipid droplet increase is blocked by triacsin C, an inhibitor of long-chain acyl CoA synthetase, a key enzyme in the lipid droplet synthesis pathway. We found that both lipid droplet and the effects of triacsin C were readily quantifiable with exceptional fidelity using high-content imaging and a cell image analysis algorithm designed specifically to quantify cellular lipid droplets. Thus, these cells provide an excellent platform for quantifying the impact of small-molecule libraries on fatty liver disease. The following Specific Aim is proposed.
Specific Aim #1. Screen chemical libraries from the NIH Screening Centers Network for their ability to modify oleic acid-induced lipid droplet formation in HuH-7 and AML12 hepatocytes. HuH-7 cells will be cultured in 384-well format, exposed to oleic acid alone and with test chemicals for 24 hrs, and then stained for lipid droplets. The cells will then be photographed utilizing high-content robotic microscopy. Resulting images will be automatically quantified for lipid droplets in individual fields using an algorithm specifically designed to quantify lipid droplet size, number, and staining intensity. If difficulties are encountered with the HuH-7 cells, AML12 cells will be used, which are also very suitable for these assays. (Please note that ultimately this Aim was met with the AML12 cells as the HuH-7 cells proved to be problematic and also later literature and studies by Vala cast some doubt of it as a suitable model for liver lipid droplet formation dysregulation).
Background and Significance. Medical researchers world-wide now use the term “epidemic” or “pandemic” to describe the alarming incidence of obesity in modern society [4–7], which is estimated to occur in 30% of the general US population. Perhaps, most alarming is the high incidence of obesity in children and adolescents [8–10], which indicates that medical problems associated with obesity (e.g., diabetes, metabolic syndrome, and heart disease) will increase in the foreseeable future, as obesity often increases with age. The dominant cellular basis for obesity is increased accumulation of triglycerides in lipid droplets within the cell. The two major cell types in which lipid droplet formation leads to pathological problems are adipocytes and hepatocytes. The present probe 0 report specifically addresses lipid droplet formation in hepatocytes, which underlies the pathology of several related syndromes that have wide impact on human health in modern society: Non-Alcoholic Fatty Liver Disease (NAFLD and Fatty liver in alcoholism (Alcoholic Liver Disease or ALD). Figure 1 illustrates a “fatty liver” biopsy and disease progression.
Excessive alcohol consumption has long been associated with liver disease (Alcoholic Liver Disease or ALD), in which excessive formation of lipid droplets occurs within hepatocytes. Typical disease progression occurs with the liver becoming excessively “fatty”, then inflamed, fibrostic, cirrhotic, and ultimately there is liver failure [11,12]. Fatty liver disease associated with obesity in the absence of alcoholism is becoming an increasing recognized syndrome ([13,14] and is now commonly termed non-alcoholic fatty liver disease (NAFLD) [15]. Ominously, 20% to 35% of the adult population in the US has NAFLD, and its incidence in obese individuals is approximately 75% [16]. NAFLD is closely associated with diabetes and the Metabolic Syndrome [17,18]. In a recent study, approximately 69% of patients with type II diabetes were diagnosed with NAFLD [19]. NAFLD is also strongly associated with hepatitis C virus infection as steatosis was present in 50% of the patients infected with HCV [20] and can also be a rare occurrence in the “in the third trimester of pregnancy [21,22]. The pathological progression of NAFLD is very similar to what occurs with alcoholism namely, initial increase in fat content of the liver, which corresponds to increased lipid droplets within hepatocytes, followed by fibrosis, and liver damage.
AML12 and HuH-7 cells. As NAFLD is due to accumulation of triglyceride lipid droplets within hepatocytes, we chose AML12 cells, which are a widely used immortalized cell line [23], derived from hepatocytes from a transgenic mouse overexpressing TGFα. AML12 cells retain many of the characteristics of differentiated hepatocytes but do not form tumors. Thus, AML12 cells represent a non-transformed hepatocyte-derived cell line that exhibits a phenotype similar to normal hepatocytes. Because of their ability to form very consistent flat monolayers when cultured in 96-well dishes, these cells are exceptionally good candidates for high-content analysis, in an environment for compound screening that can be more precisely controlled, readily quantitated, and accomplished with much less effort than in whole animal models. We observed that lipid droplet levels strongly increase in AML12 cells exposed to oleic acid and that the lipid droplets can be very well quantified by high-content microscopy coupled with automated image analysis. HuH-7 is a human cell line with characteristics reported to be analogous to AML12, and has been used in inhibitors on lipid droplet formation assays [24–26]. Unfortunately, in our hands these cells grew over each other and clumped even at low seeding densities, rendering them unsuitable for HCS and quantitative imaging. This cellular phenotype cast some doubt for its use as a suitable cell culture model for liver lipid droplet formation dysregulation.
Pathways controlling hepatic lipid droplet formation. Despite the wide-spread importance of lipid droplets to biological processes and human health, relatively little is known about the specific mechanisms that regulate their formation and metabolism. Fatty acids from the extracellular compartment (fatty acids bound to albumin in the bloodstream) enter the cell via association with fatty acid transport proteins (e.g., FATP, [27]) (Figure 2). Fatty acids are then linked to coenzyme A (CoA) by acyl-CoA synthetases (ACS1-ACS5) [28]. Isoforms of acyl-CoA synthetases have different specificities for fatty acids of different chain lengths, different tissue and cellular distributions, and different sensitivity to inhibitors. ACS1, ACS4, and ACS5 are found in the liver [29] in association with different organelles and membrane fractions. Thus, ACS1 is in the endoplasmic reticulum ER) and cytosol, while ACS4 is associated with mitochondrial membranes, and ACS5 is in the mitochondrial membrane. ACS1, ACS3, and ACS4 are competitively inhibited by the fungal component triacsin C [26,30]. ACS3, previously identified in the brain, has recently been found to be expressed in human hepatocyte-derived HuH7 cells in association with lipid droplets [24–26]. Thus, ACS3 likely represents a newly identified, and perhaps, critical regulator of hepatic lipid droplet formation. Another key regulator of the process is diacylglycerol acyltransferase (DGAT – [31]). There are two mammalian isoforms of DGAT (DGAT1 and DGAT2); DGAT2 is most prominent in the liver, and there is much current interest in developing small molecules to regulate DGAT activity [32]. The acyl groups of fatty acid CoA thioesters are transferred to diacyl glycerol to form triglycerides, which are incorporated into lipid droplets. Hepatic lipid droplets are coated by adipose differentiation-related protein (ADFP), which has been hypothesized to participate in lipid droplet initiation [33].
Many other proteins also associate with lipid droplets and are likely regulate droplet formation. Identification and characterization of such proteins is an arena of intense genomic-scale investigation [34–36]. While lipid droplets are thought to arise by budding from the ER [33,37], little is known regarding the mechanism(s) by which triglycerides are added to the lipid droplets.
Therefore any novel probes the affect the overall phenotypic uptake of FA’s and formation of lipid droplets may provide novel tools that map to any one of these processes, and may also map to unknown processes of lipid droplet formation. Probes that interfere with hepatocyte lipid droplet formation will be of tremendous interest to biomedical researchers.
Prior Art – Unmet needs
Triacsin C is a fungal metabolite of a family of metabolite (triacsin A through D), that has an estimated potency (IC50~1 – 3 μM) for blockade of lipid accumulation in AML-12 cells, as determined from this work. It is a known inhibitor of long-chain acyl-CoA synthetase (ACSL) with modest potency (IC50 ~1 μM) against ACSL in Raji cell membrane fractions [38]. It is also reported to selectively inhibit arachidonoyl-CoA synthetase in intact cells and the nonspecific acyl-CoA synthetase in cell sonicates IC50=3.6–8.7μM. in cell sonicates (IC50 = 2.6 – 8.7 μM) as noted by the commercial supplier, Enzo Life Sciences (see http://www.enzolifesciences.com/BML-EI218/triacsin-c/). The chemical structure of Triacsin C (Figure 3), suggests that it may be considered a polyunsaturated fatty acid substrate analog for the ACSLs, with the acid N-hydroxytriazene moiety mimicking the carboxylic acids of fatty acids. Any envisioned synthetic modifications would be limited to substrate mimics, and the polyunsaturated chain would make the pharmacokinetic and cell penetrance properties challenging.
Figure 3
Structure of Triacsin C.
Indeed, triacsin C, the inhibitor of long chain Acyl CoA Synthetase, which we used in our studies that led to the preliminary data for the original R03 proposal, remains one of relatively few chemicals known to inhibit this process. However, triacsin C is toxic to cells at concentrations that are very close to the IC50 for inhibition of lipid droplet formation
Notably, there have been recent advances in developing probes that inhibit the activity of diacylglycerol acyltransferases. This class of enzyme is responsible for linking fatty acids (presented to the enzyme as Co-A-fatty acid moieties) to diacylglycerol to form triacylglycerol (Figure 2). Several laboratories are developing specific probes to inhibit DGAT1, with the hopes that such molecules will provide structures relevant to therapeutic treatment of obesity and related disorders [39–41]. It is certainly possible that the list of molecules identified in the current project that inhibit lipid droplet formation in the AML12 cells represent novel inhibitors of the DGATs. While progress has been made with probe development for DGATs, there is an absence of such probes for fatty acid uptake/transport into cells, and hepatocytes, in particular. Fatty acids are likely to cross the plasma membrane associated with several protein classes, including the fatty acid transport proteins (FATP1-6 (as identified in Figure 2)), CD36, or the plasma membrane-associated fatty acid-binding protein family (FABPpm) [42]. However, specific probes that bind to and inhibit the function of these molecules are not widely known.
Two protein kinase pathways have very recently been linked to hepatic steatosis. These include the Par-1a (aka MARKI3/C-TAK1) which is a member of the “Polarity Kinase” family, which is evolutionarily conserved from yeast to man. Mice in which Par-1a are knocked out are resistant to development of obesity and hepatic steatosis [1], and the mechanism may involve alterations in autophagy [2]. Additionally, inhibitors of c-Jun N-terminal kinase are proving to be protective against the development of non-alcoholic steatohepatitis (NASH) in rodents fed a high fat diet [3].
Thus, the compounds discovered in the present project to inhibit hepatic lipid droplet formation might well prove to be novel DGAT inhibitors, or inhibitors of fatty acid transport or the Par-1a or c-Jun N terminal kinase group.
Natural products. The search for compounds with positive therapeutic effects against alcohol-induced liver injury has thus far identified polyphenols from seeds, insulin-sensitizing agents, and antiestrogens [43–45]. Recently, two new natural product inhibitors of lipid droplet accumulation in mouse macrophages, Isobisvertinol and Bisvertinol were recently reported [46]. Both Isobisvertinol and Bisvertinol inhibit the synthesis of cholesterol esters (CE) and triglycerides (TG), the main constituents of lipid droplets in macrophages, with an IC50 of 2.5 and 4.0 μM respectively [46]. Another report of inhibitors of lipid droplet formations is the natural product FKI-3765-1. This compound was isolated from the broth of Penicillium cecidicola and in a dose-dependently manner inhibited lipid droplet formation in mouse macrophages. Furthermore, FKI-3765-1 was found to inhibit the synthesis of CE in mouse macrophages with IC50 of 3.65 μM [47].
Additionally, two heterocyclic compounds FKI-1746-1 and −2 were isolated from an Aspergillus broth and both compounds show modest inhibition of macrophages in a lipid droplets assay with an IC50 of 4.8 and 7.0 μM respectively, described in a Japanese patent (JP 2009184946). An additional report of lipid droplet formation inhibitors by hydroxylated fullerene and/or encapsulated fullerenes in preadipocyte 3T3-L1 cells was reported. These compound displayed modest inhibition of lipid droplet formation in mouse macrophages in the range of 10 – 100 μM. (JP 2008222645).
2. Materials and Methods
The details of the primary HTS and additional assays can be found in the “Assay Description” section in the PubChem BioAssay view under the AIDs as listed in Table 1. Additionally the details for the primary HTS are provided in the Appendix at the end of this probe report. However, a significant portion of the novelty and the technical challenge of this high-content screen (HCS) or automated image processing and image-based phenotypic assay was in the development and validation of the algorithms for automated image analysis, comprising image segmentation, object identification, counting, and extraction of parametric measures that have to be correlated with meaningful biological events and phenotypic changes. Much of this preliminary development was funded at Vala Sciences by another NIH Grant 1R43DK074333-01 and they developed an image analysis algorithm to quantify lipid droplets in cultured adiopocytes and then incorporated the algorithm into a Java-based image cytometry software commercialized as CyteSeer™. The software package was specifically designed for analyzing images obtained from cells plated in multi-well format and imaged using high-content microscopy workstations. The lipid droplet quantification algorithm works on cells that have been imaged in two fluorescence channels, one for nuclei (nuclear channel) and another for lipid droplets (lipid channel, typically the green fluorescence channel). Cells are conveniently stained with DAPI to visualize the nuclei and with Bodipy 493/505 to visualize lipid droplets although other nuclear and lipid stains can be used. Cells within the image are identified (segmented) on the basis of nuclear size, shape, and intensity. A variety of image processing techniques are then used to define the pixels corresponding to lipid droplets within the images corresponding to the lipid channel. Once loaded, images are processed relatively rapidly (a few seconds per image) to count the droplets per cell, droplet size and intensity. A large variety of additional parameters such as intensity and area of non-lipid, cytoplasmic regions are also measured.
Table 1
Summary of Assays and AIDs.
The lipid droplet algorithm was validated by using it to automatically quantify the effects of triacsin C (TC) on oleic acid (OA)-induced lipid droplet formation, when AML12 cells are exposed to OA alone or with TC. Cells were incubated overnight, stained, and scanned by high-content microscopy, then analyzed with the lipid droplet algorithm. Figure 4 shows a representative set of images that illustrates the analysis process for this set of control experiments. Oleic acid strongly stimulated lipid droplet formation, whereas this effect was inhibited, in large part, by triacsin C (Figure 4).
Lipid droplets in the AML12 cells were identified with high fidelity (Figure 4C, 4F, and 4I). Although the lipid droplet algorithm is able to calculate many data parameters related to the lipid image, including the number of pixels assigned to the lipid droplet mask per cell, the average brightness per cell, and other related parameters, all of which were increased with addition of oleic acid (data not shown), the data parameter that was elevated most consistently was the ratio of area of the lipid droplet mask to the cell area, which increased by 21-fold after treatment with 200 μM OA (Figure 4J). Upon transfer of the assay to the screening center, the CyteSeer™ lipid droplet detection algorithm was adapted to run on the Acapella™ (PerkinElmer) high content analysis software package for on-the-fly analysis on the Opera™ (Perkin Elmer) QEHS high content screening system.
2.1. Assays
Table 1 summarizes the details for the assays that drove this probe project.
The primary HCS assay was conducted on a Perkin Elmer Opera™ high-content imaging system. The multiplexed HCS cytotoxicity counterassay was performed to weed out potential cytoxic compounds, and was done by calculating a cytotoxicity index based on nuclear morphometric and fluorimetric parameters as compared to the negative control cells. Correction of systematic plate effects observed in the primary screen data was performed using a Hybrid-Median Filter before selection of hits [48].
2.2. Probe Chemical Characterization
a) Chemical name of probe compound
The IUPAC name of the probes are: 2-chloro-N-(3,4-diethoxyphenethyl)-4-methyl-4H-thieno[3,2-b]pyrrole-5-carboxamide (ML261) and N-(3,4-diethoxyphenethyl)-5-morpholino-4-phenylthiophene-2-carboxamide (ML262). The actual batches prepared, tested and submitted to the MLSMR are archived as SID 103061845 (ML261) and SID 104222756 (ML262) corresponding to CID 9550710 (ML261) and CID 20855303 (ML262).
b) Probe chemical structure including stereochemistry if known
The probes ML261 and ML262 have no chiral centers. (See Figure 5)
Figure 5
Probe structures.
c) Synthesis and Structural Verification Information of probe ML261 SID 103061845 corresponding to CID 9550710 (See Scheme 1) and ML262 SID 104222756 corresponding to CID 20855303 (See Scheme 2).

Scheme 1
Synthesis of ML261, conditions. a. Na, EtOH, b. reflux, xylene, c. NaH, RX. THF, d. LiOH, EtOH 60°C, then HCL acidification, e. EDC, HOBT, NMM, DMF
Scheme 2
Synthesis of ML262, conditions. a. EDC, HOBT, NMM, DMF, (55%)
d) If available from a vendor, please provide details
The probe molecule ML261 is commercially available from Chem Div and the vendor compound ID number is C703-1895 The probe molecule ML262 is not currently commercially available.
Samples of ML261 (purchased) and ML262 (synthesized at SBCCG) have been deposited in the MLSMR (Bio-Focus DPI) (see Probe Submission Tables 3 and 4).
Table 3
Probe ML261 and Analog Submissions to MLSMR (BioFocus DPI) for lipid droplet Inhibitors.
Table 4
Probe ML262 and Analog Submissions to MLSMR (BioFocus DPI) for lipid droplet Inhibitors.
e) Solubility and Stability of probe in PBS at room temperature
The stability and solubility of ML261 and ML262 were investigated in 1:1 acetonitrile:1XPBS buffer at room temperature (Figure 6a & 6b). A comparison at times 0, 3, 6, 12, 24 and 48 h indicates that probe ML261, somewhat surprisingly, has some hydrolytic instability (it did not appear to be compound precipitation by inspection), with a half-life of greater than 12 hours. Since the lipid droplet assays are overnight incubations (~12 – 15 hrs), as least half of the initial compound dose is expected to remain, so the apparent potencies should be within a 2-fold the true potency. As noted in the Summary of in vitro ADME/T properties (Table 9), ML262 has limited solubility in aqueous buffer at all pH’s tested (0.99, 0.81 and 2.1 μM [0.47, 0.39, and 1.0 μg/mL], at pH 5, 6.2, and 7.4, respectively. Therefore, in order to evaluate its potential hydrolytic instability aliquots of ML262 was prepared as solutions in 50% aqueous acetonitrile:PBS and were analyzed by LC/MS. In contrast to ML261, ML262, our more potent (6 nM) probe is very stable (see Figure 6b).

Figure 6a
Stability of ML262 in 50% acetonitrile: 1X PBS.
Table 9
Summary of in vitro ADME Properties of Novel Selection of Lipid Droplet Inhibitor Probes ML262.
Figure 6b
Stability of ML262 in 50% acetonitrile: water.
f) Calculated and known probe properties
Table 2Calculated Properties of Probe ML261 and ML262
| CID 9550710[ML261] | CID 20855303[ML262] | |
|---|---|---|
| Molecular Weight | 406.92622 [g/mol] | 480.61898 [g/mol] |
| Molecular Formula | C20H23ClN2O3S | C27H32N2O4S |
| AlogP | 5 | 5.6 |
| H-Bond Donor | 1 | 1 |
| H-Bond Acceptor | 3 | 4 |
| Rotatable Bond Count | 8 | 10 |
| Exact Mass | 406.111791 | 480.208278 |
| MonoIsotopic Mass | 406.111791 | 480.208278 |
| Topological Polar Surface Area | 80.7 | 88.3 |
| Heavy Atom Count | 27 | 34 |
| Formal Charge | 0 | 0 |
| Complexity | 498 | 611 |
| Isotope Atom Count | 0 | 0 |
| Defined Atom StereoCenter Count | 0 | 0 |
| Undefined Atom StereoCenter Count | 0 | 0 |
| Defined Bond StereoCenter Count | 0 | 0 |
| Undefined Bond StereoCenter Count | 0 | 0 |
| Covalently-Bonded Unit Count | 1 | 1 |
g) Probe(s) and analogs submission the MLSMR
We provide MLS# that verify the submission of probe molecule(s) and five related samples for each that were submitted to the SMR collection:
2.3. Probe Preparation
Experimental
ML261: This probe is commercially available from ChemDiv. A representative scheme (Scheme 3) for the analogs that were synthesized is shown:
Scheme 3
General synthetic strategy for analogs of ML261. a. Na, EtOH, b. reflux, xylene, c. NaH, RX. THF, d. LiOH, EtOH 60°C, then HCl acidification, e. EDC, HOBT, NMM, DMF
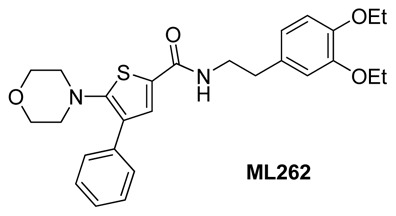
5-morpholino-4-phenylthiophene-2-carboxylic acid (0.28 g, 1 mmol) was dissolved in 3 ml of dimethylformamide and EDC (0.21g, 1.1 mol), HOBT (0.17g, 1.1 mmol) and 0.5 ml of NMM was added to the solution. The reaction mixture was stirred for 30 minutes at room temperature and then a solution of 2-(3,4-diethoxyphenyl)ethanamine (0.42g, 2 mmol) in 1 ml of dimethylformamide was added. The reaction was stirred overnight at room temperature and then the solvent was removed under reduced pressure. The residue was dissolved in 30 ml of ethyl acetate and the organic layer was poured into 100 ml of water, washed successively with 50 ml of saturated sodium bicarbonate, 50 ml of 1 N HCl, 50 ml of brine and the resultant organic phase was then dried over anhydrous sodium sulfate, filtered and concentrated under reduced pressure. The resulting solid was chromatographed on silica gel and eluted with methylene chloride: ethyl acetate using a gradient of 100:1 to 90:10, to yield N-(3,4-diethoxyphenethyl)-5-morpholino-4-phenylthiophene-2-carboxamide ML262 (0.30 g, 68% yield), 1H NMR (400 MHz, CDCl3) δ 1.40 (q, 6H), 2.80 (t, 2H), 2.93 (t, 4H), 3.62 (q, 2H), 3.72 (t, 4H), 4.04 (q, 4H), 6.73 (t, 2H), 6.82 (d, 1H), 7.24 (m, 2H), 7.33 (m, 3H), 7.60 (d, 1H). MS ESI m/z 481 [M+1].
3. Results
This HCS project was formally assigned on December 10, 2008 and much of the initial assay development time was in completing final assay miniaturization and validation in the 384 well format. Cell densities, eveness of cell monolayers and homogeneity of lipid droplet formation within wells were critical factors. Optimal cell density was determined to be at 10,000 cells per well with lower densities having a patchy distribution of the cell monolayer while the higher densities started to show multi-layer cell areas. We observed that using 200 μM oleic acid to induce lipid formation made the cells less adherent, resulting in patchy cell monolayers. Reducing the oleic acid to 100 μM yielded better monolayers while still resulting in significant lipid droplet formation. We therefore proceeded, using 100 μM oleic acid for further assay development. Next, the sensitivity of the assay to DMSO concentration was evaluated using DMSO concentrations from 0 to 1.5%. At concentrations of >0.6% the lipid droplet formation in response to oleic acid was increasingly diminished, resulting in decreased Z′ values. Therefore a primary screening concentration of 0.5% DMSO was selected. Z′ test plates were run on different days to determine the performance of the assay across entire 384 well plates. Z′ values of 0.495 to 0.511 were observed for 100 μM oleic acid alone versus 100 μM oleic acid with 5 μM Triacsin C, both at 0.5% final DMSO concentration, as shown in Section 3.1. A dose-response experiment for the positive control compound Triacsin C was performed at 0, 1.56, 3.12, 6.25, 12.5, and 25 μM. At concentrations above 12.5 μM, cytotoxicity of the control compound began interfering with the assay.
3.1. Summary of Screening Results
We completed a full-deck HCS screen of the available MLSMR library of 236, 441 compounds at 5 μM final library compounds concentration at ~0.2% (v/v) final DMSO concentration for inhibitors of lipid droplet formation in monolayer AML12 cells cultured and treated for 24 hours with oleic acid and compounds, triacsin C inhibition control, or DMSO uninhibited control. Fixed cells were stained with DAPI and Bodipy and lipid droplets and cells nuclei were counted. Figure 7 summarizes the hit triage and prosecution. An initial 952 hits were obtained at >50% inhibitory activity where we had at least 300 cells/well for good counting statistics. We requested all of these as “cherry picks” of fresh DMSO stock solutions from the MLSMR and received 869 of them for a order fulfillment of 91.3%.

Figure 7
Hit triage for Lipid Droplets.
Of the 869 received cherry picks, 585 confirmed in duplicate at the original 5 μM test concentration, and passed the same hit criteria (>50%I & > 300 cells/well). The reconfirmed active wells were also examined in the DAPI channel to estimate any cytotoxic condensation or fragmentation of the nuclei, to ensure that the HCS cytotoxicity index was < 3. This only removed 5 compounds for any cytotoxicity, leaving the majority of these for consideration. We did order a second resupply of the stock solutions and received 530 of these.
Due to the laborious nature of HCS assays, the cheminformatic group performed statistical filtering using Bayesian methods to compare significance of the HTS data and was able to prioritize 256 of the 530 compounds as significantly different and worthy of full dose response titration. Only 114 of these compounds yielded potencies better than 3 μM (IC50 < 3 μM) for AML12 lipid droplets formation), and some of these compounds had sub-micromolar potency. Careful inspection and perusal of these data revealed that these 114 compounds naturally grouped into 12 chemical scaffold classes of which only 2 were deemed chemically attractive and tractable by our project chemists. Both of these had sub-micromolar potency for lipid droplet inhibition in AML12 cells. The synthetic strategy for these two scaffolds are described further in section 3.2.
3.2. Dose Response Curves for Probe

Figure 8IC50 determinations from full dose-response curves of ML261 and ML262
Note that probes exhibited no cytotoxicity was seen at the highest tested concentration (33 μM) either by HCS cytotoxicity indices or by ATPLite™ cytotoxicity assays on the AML12 cell
3.3. Scaffold/Moiety Chemical Liabilities
This screening effort produced 12 distinct scaffolds, several of which had significant chemical liabilities. Our synthetic efforts were focused on the two scaffolds in Figure 9, 2-chloro-N-(3,4-diethoxyphenethyl)-4-methyl-4H-thieno[3,2-b]pyrrole-5-carboxamide, compound 1A (CID 9550710) and N-(benzo[d][1,3]dioxol-5-ylmethyl)-5-morpholino-4-phenylthiophene-2-carboxamide, compound 1D (CID 20854922), which were the two most potent hits from these series derived from the screen (see Table 5). Neither the scaffolds contain standard chemical liabilities, nor do the lead molecules appear to be frequent hitters. In fact, both compounds appear remarkably clean, hitting in only this assay out of >300 in PubChem.
Figure 9
Structure of confirmed most attractive screening hits.
Table 5
Potencies of key screening hit scaffolds.
3.4. SAR Tables
SCAFFOLD I
After confirmation of the initial results, the hit-to-probe process was initiated by both an “analog-by-catalog” (ABC) approach and an internal medicinal chemistry effort. The original lead compound 2-chloro-N-(3,4-diethoxyphenethyl)-4-methyl-4H-thieno[3,2-b]-pyrrole-5-carboxamide, compound 1A in Table 5 has an IC50 = 69.7 nM in the AML12 Lipid Droplet assay
Using ABC approach, 7 closely related analogs of this scaffold were purchased to expand the SAR around the thieno[3,2-b]pyrrole series compound 1A. The biological activity of these compounds is shown in Table 6.
Table 6
SAR elucidation of thieno[3,2-b]pyrrole series A and B.
Concurrently, 28 thieno[3,2-b]pyrrole analogs were synthesized and the activity in the AML12 Lipid Drop Assay was measured. The general SAR strategy we pursued around this scaffold from the screening hit, CID 9550710 (entry 1A in Table 6) is depicted in Figure 10. In order to improve the potency of this series of molecules numerous changes to the scaffold were investigated. In Quadrant I we focused on changing the substituents on the phenyl ring, both in type and location on the ring.

Figure 10
SAR strategy for Scaffold I.
In Quadrant II we changed the thieno[3,2-b]pyrrole ring structure to other heteroaromatic ring systems. We also investigated changes in the chain length.
SCAFFOLD II
After confirmation of the initial results, the hit-to-probe process was initiated by both an analog-by-catalog approach and an internal medicinal chemistry effort. The original lead compound N-(2,3-dihydro-1H-inden-5-yl)methyl)-5-morpholino-4-phenylthiophene-2-carboxamide, compound 1C (CID20854922) ( see Table 5), has an IC50 = 412 nM in the AML12 Lipid Droplet assay
Using an ABC approach, one additional analog of this particular scaffold was purchased to expand the SAR around the dihydrobenzo[d]oxazole series, compound 1C. Concurrently, seven 5-morpholino-4-phenylthiophene analogs were synthesized and their activity in the AML12 Lipid Drop Assay was measured. The general SAR strategy we pursued around this scaffold from the screening hit, CID 20854922 (entry 1C in Table 6) is depicted in Figure 11. In Quadrant I we focused on changing the substituents on the phenyl ring, both in type and location on the ring. In Quadrant II we changed the R3 substituents on the thiophene ring and also investigated if the amine functionality on the thiophene is necessary for activity. We also investigated changes in the chain length.

Figure 11
SAR strategy for Scaffold II.
SAR: SCAFFOLD I - Compound ML261 (probe)
The results of both the ABC approach and our internal medicinal chemistry efforts are summarized in Table 6. Entry 6A is a very close analog of the lead compound 1A, the key difference is that the chloride atom on the thiophene ring has been replaced by a hydrogen atom. The IC50 values of both entries 1A and 6A in the AML12 Lipid Droplet assay are almost identical. This initial finding led us to pursue the thieno[3,2-b]pyrrole series of molecules without the chlorine atom present on the thiophene ring. This simplified our synthesis significantly as the des-chloro- thieno[3,2-b]pyrrole core ring structure was considerable easier to synthesize. We next focused on investigating if the ethyl group at the R2 position was essential for activity. To this end we synthesized compound 7A, in which the R2 ethyl group of entry 6A was replaced by a hydrogen atom, and the IC50 values of both entries 1A and 7A in the AML12 Lipid Droplet assay are almost identical. We observed that when the ethyl group at R2 of entry 6A was replaced by a methyl group the potency of the compound diminished by two fold entry 5A. We discovered that changes in the R3 group influenced the potency of the compounds in a critical manner. Interestingly, the only other amine groups at R3 that matched the potency of the 2-(3,4-diethoxyphenyl)ethanamine present in entries 1A, 6A and 7A are either 2-(4-ethoxy-3-methoxyphenyl)ethanamine and 2-(3-ethoxy-4-methoxyphenyl)ethanamine, see entries 14A and 15 A respectively. We found that decreasing the chain length to either zero or one carbon atom greatly decreased the activity. (See Entries 10A – 12 A). We note that none of these compounds tested had any significant cytotoxicity up to 33 μM, the highest concentration tested, as judged by an HCS cell cytoxicity index < 3.
We next investigated the replacement of the thieno[3,2-b]pyrrole, entries 1A–16A with thieno[2,3-b]pyrrole, entries1B – 15B in Table 6. The activities and potency of comparable molecules is similar in nature, see entries 6A and 10B, the IC50 values are 69.9 and 77.9 nM respectively in the AML12 Lipid Droplet assay. None of these compounds had any cytotoxicity up to 33 μM, the highest test concentration.
Finally we replace the thieno[3,2-b]pyrrole heterocycle with a 1-methyl-1H-indole heterocycle and the results are presented in Table 7. We synthesized 4 molecules in this series and all compounds are less potent in the AML12 Lipid Droplet assay.
Table 7
SAR elucidation 1-methyl-1H-indole heterocyclic series C.
Finally, compound 1A was nominated as our probe molecule ML261, CID 9550710, SID 103061845 as it is one of the most potent inhibitors from this series in our Lipid Droplet Assay with an IC50 of 69.7 nM. Again, throughout SAR optimization, no compound or analog proved to be cytotoxic.
SAR: SCAFFOLD II - ML262 (2nd probe)
The results of both the analog-by-catalog approach and our internal medicinal chemistry effort are summarized in Table 8 for Scaffold II compounds. Using the information we obtained in optimizing Scaffold I, we made a select library of 7 compounds. Interestingly, we found that the optimum R2 group was the 2-(3,4-diethoxyphenyl)ethanamine, entry 2E. The most active amines are either 2-(4-ethoxy-3-methoxyphenyl)ethanamine and 2-(3-ethoxy-4-methoxy-phenyl)-ethanamine, see entries 4E and 7E, respectively. These findings parallel our results for Scaffold I.
Table 8
Further SAR elucidation Scaffold II – series E.
Compound 3E was nominated as our probe molecule ML262, CID 20855303, SID 104222756 because of its exceptional potency in our Lipid Droplet Assay with an IC50 of 6.4 nM. We did not pursue further SAR around this series after this compound was found.
3.5. Cellular Activity
The primary assay used for driving SAR is a cell-based assay, so by definition all these compounds are cell active. None of these SAR compounds were cytotoxic as judged by the cell selectivity index calculated from the HCS nuclei and cell number parameters
3.6. Profiling Assays
As a pro forma activity, the SBCCG is committed to profiling all final probe(s) compound(s) and in certain cases key informative analogs in the PanLabs full panel as negotiated by the MLPCN network. For these particular probes as one class of potential targets for inhibition are the Par-1a or c-Jun N terminal kinases, we will submit ML261 and ML262 for extensive kinase profiling. These probes will also be submitted to the GPCR PDSP panel of Bryan Roth at UNC. Additional commercial profiling services will be considered for funding by SBCCG as deemed appropriate and informative.
The in vitro pharmacology ADME/T parameters for the nominated probes were sent for evaluation by the Sanford-Burnham Pharmacology Resource (S-B Exp Pharm) and the results for ML262 are shown in Table 9.
ML261 was recently submitted to the Exploratory pharmacology group, however, while we await experimental determination ADME/T parameters, we expect them to similar to ML262 as the calculated properties of both probes are similar with respect to AlogP, H-bond donor/acceptors, topological polar surface area (tPSA), and complexity (see Table 2).
ML262 is poorly soluble in aqueous media over a range of pH values, 1 to have similar properties since it has remarkably similar calculated properties. However, due to the potent nature of these molecules, their poor solubility do not confound their efficacy. ML262 is soluble at 156-fold, 126-fold, and 328-fold over its 6.4 nM IC50 for lipid droplet formation in AML12 cells, at pH 5.0, 6.2 and 7.4, respectively. These favorable solubility vs. potency ratios are especially pertinent at the lower pHs which may be expected during the vescicular trafficking of lipid filled vesicle (lipid droplet formation).
The PAMPA (Parallel Artificial Membrane Permeability Assay) assay is used as an in vitro model of passive, transcellular permeability. An artificial membrane immobilized on a filter is placed between a donor and acceptor compartment. At the start of the test, drug is introduced in the donor compartment. Following the permeation period, the concentration of drug in the donor and acceptor compartments is measured using UV spectroscopy. Consistent with the predicted LogP (see table 3), ML262 is moderately permeable in this assay. This also seems consistent with the nature of this cell-based AML12 lipid formation assay, as the overall process of the binding, transport, conjugation, and vesicular trafficking of very lipophilic fatty acid substrates would seem to select for lipophilic and cell permeable compounds.
Plasma Protein Binding is a measure of a drug’s efficiency to bind to the proteins within blood plasma. The less bound a drug is, the more efficiently it can traverse cell membranes or diffuse. Highly plasma protein bound drugs are confined to the vascular space, thereby having a relatively low volume of distribution. In contrast, drugs that remain largely unbound in plasma are generally available for distribution to other organs and tissues. ML262 shows high binding to plasma proteins in mouse and human plasma.
Plasma Stability is a measure of the stability of small molecules and peptides in plasma and is an important parameter, which strongly can influence the in vivo efficacy of a test compound. Drug candidates are exposed in plasma to enzymatic processes (proteinases, esterases), and they can undergo intramolecular rearrangement or bind irreversibly (covalently) to proteins. ML262 shows excellent stability in human and moderate stability in mouse plasma.
The microsomal stability assay is commonly used to rank compounds according to their metabolic stability. This assay addresses the pharmacologic question of how long the parent compound will remain circulating in plasma within the body. ML262 shows poor stability in both human and mouse liver microsomes. This may be due to the removal of the capping ether functionalities on to release the catechol moiety.
4. Discussion
This probe report, illustrates the power of unbiased, phenotypic automated image-based assay focused on identifying compounds that modulate the overall pathway(s) leading to intracellular lipid droplet formation which is the hallmark of hepatic steatosis associated with alcoholic liver disease (ALD) and non-alcoholism fatty liver disease. While some of these pathways are known, there still remain others that have not been elucidated. The two probes uncovered in this probe report offer chemical tools to potentially dissect these novel pathways in murine models of this important disease. Also the curious and unexpected species selectivity may suggest that there are heretofore unknown species specific differences in the lipid droplet formation pathways between mouse and man.
4.1. Comparison to existing art and how the new probe is an improvement
Using a novel, unbiased, phenotypic automated image-based assay that for compounds that inhibit the overall formation of intracellular lipid droplet formation in AML12, a murine hepatocyte cell line, we have found two first-in-class, very potent single (6.4 nM) and double digit (69.7 nM) nanomolar inhibitors of overall lipid accumulation, that are non-toxic by at least ~ 500-fold compared to efficacious doses. These two probes are more potent by at least 2 orders of magnitude than the current state of the art probes which have potencies in the 2.5 – 100 μM range (see Prior Art section). Furthermore, they represent two distinct and tractable chemical scaffolds, that are of completely different chemical classes to those current inhibitors for overall lipid droplet formation which are targeted towards inhibition of: 1) long chain Acyl CoA Synthetase (LCACS) isoforms, 2) diacylglycerol acyltransferases (DGATs) or 3) Par-1a or c-Jun N terminal kinases. We also note that these probes are exquisitely non-promiscuous appearing active only in this lipid droplet formation assay out of >300 assays listed in PubChem representing different targets.
Disappointingly, from our limited explorations of molecular target identification (see Section 4.2 Mechanism of Action Studies), these two probes do not appear to be the much sought after and currently absent inhibitors of fatty acid transporter proteins (FATP). The elucidated SAR for each compound and the nature of the chemical appendages suggest that further improvements to some ADME/T liabilities can be synthetically overcome, so these compounds could be further developed into bonafide in vivo proof of concept tools in murine models of ALD and NAFLD.
4.2. Mechanism of Action Studies
The probes ML261 and ML262 were tested in full dose-response up to 50 μM for testing of inhibition of fatty acid uptake by using the fatty acid uptake assay from molecular Devices. The compounds were co-incubated with BODIPY labeled fatty acid in AML12 cells. Kinetic readings were taken every 20 seconds at 37°C on the FlexStation™ (Molecular Devices) plate reader. No significant inhibition in fatty acid transport was observed for either probe.
The compounds were tested in dose-response with pre-plated primary human hepatocytes (XenoTech). The assay conditions were exactly the same as for the primary assay in AML12 cells. The hepatocytes were fixed and stained with DAPI for nuclei and BODIPY for lipid. The same lipid droplet anaylsis algorithm was used for High Content imaging of the primary cells. No significant inhibition was observed by either compound.
4.3. Planned Future Studies
Next steps for the probes will be to identify the specificity of the inhibition (via the assays proposed), and, also to progress to animal models. Towards this end, the SBCCG has provided sufficient synthesized powders to Dr. McDonough to perform some key cellular based experiments to further confirm the cell based efficacy in other rodent and human cell lines. If successful in establishing further translations efficacy required, sufficient material can be synthesized under additional grants that Vala and its collaborators have. An initial compound exposure study could be conducted through SBCCG Exploratory Pharmacoloy Core as a service, but we also expect
Relevant to this are researchers associated with Vala Sciences Inc, which include Tim Morgan, of the University of California at Irvine. Dr. Morgan’s group is investigating the development of fatty liver in mice fed high fat diets. Also, Dr. Layton Smith, of Sanford Burnham Florida, is investigating the development of fatty liver in PAI-1 knockout mice. Finally, Dr. Michael Sturek, of the University of Indiana is investigating the development of obesity and fatty liver disease in a unique porcine strain (the Ossabaw pig), and Dr. Sturek is collaborating with Vala Sciences on the development of assays to quantify lipid droplet formation in skeletal muscle. All of these investigators would be very interested in testing novel probes for their ability to inhibit hepatic steatosis and the associated obesity related pathologies in their model systems. Research directed towards exploring the potential development of such probes would be very appropriate subjects for the NIH STTR program, which involve the formal collaboration of a commercial venture (such as Vala Sciences) with an academic research institution. Dr. Gregory Roth, and Layton Smith, from Sanford Burnham, Florida, would likely be very willing collaborators on grant projects to follow up the potential use and further development of probes discovered from the present project. A pharmaceutical company that would very likely be interested in such probes is Sanofi Aventis. Representatives of Sanofi Aventis have been following the progress of Vala Sciences in developing lipid droplet assays, and have discussed performing large scale high throughput screens to identify modulators of lipid droplet formation in adipocytes with Vala Scientists and it is likely that they would be interested in inhibitors of hepatic steatosis, as well. Finally, since HCV replication depends upon interaction of viral proteins with hepatic lipid droplets, such probes might have anti-HCV effects, and would likely be over very high interest to Dr. Inder Verma’s group at the Salk Institute, as this group has developed a unique mouse model appropriate for HCV research, in which the murine hepatocytes within the liver have been replaced with human hepatocytes [10].
In summary, the study has produced compounds that will be of extreme interest to the scientific research and biomedical community. The current state of the research is that these compounds are the most potent compounds yet discovered to inhibit lipid droplet formation in any cellular system. The probe has to date, been extensively tested in a murine cell line (AML12 cells), and in one human line (Huh-7) cells. The inability of the compounds to inhibit oleic acid-induced lipid droplet formation in Huh-7 cells could relate to differences in the metabolism of lipid droplets in mouse vs. man. However, this is unlikely; as such differences in metabolism between these two species are not widely known. Indeed, it is tempting to speculate that the Huh-7 cells may not express the target of the compounds, which might point to a defect in lipid metabolism for the Huh-7 cells. Indeed, Huh-7 cells, along with HepG2 cells are derived from hepatocellular carcinoma, and both of these cells accumulate lipid droplets to a greater extent than primary hepatocytes under identical culture conditions. Thus, these probes will likely be of great use to researchers investigating not only fatty liver disease, but also the altered state of metabolism that likely occurs during the transition to hepatocellular carcinoma, which is the ultimately most dangerous manifestation of fatty liver, and cirrhosis.
5. References
- 1.
- Lennerz JK. Loss of Par-1a/MARK3/C-TAK1 kinase leads to reduced adiposity, resistance to hepatic steatosis and defective gluconeogenesis. Mol Cell Biol. 2010;30:5043–50456. [PMC free article: PMC2953066] [PubMed: 20733003]
- 2.
- Singh R, et al. Autophagy regulates lipid metabolism. Nature. 2009;458:1131–1135. [PMC free article: PMC2676208] [PubMed: 19339967]
- 3.
- Hu YB, Liu XY. Protective effects of SP600125 in a diet-induced rat model of non-alcoholic steatohepatitis. 2009. [PubMed: 19891587]
- 4.
- Haffner SM. Relationship of metabolic risk factors and development of cardiovascular disease and diabetes. Obesity. 2006;14(Suppl 3):121S–127S. [PubMed: 16931493]
- 5.
- Hensrud DD, Klein S. Extreme obesity: a new medical crisis in the United States. Mayo Clin. Proc. 2006;81(10 Suppl):S5–10. [PubMed: 17036573]
- 6.
- Francischetti EA, Genelhu VA. Obesity-hypertension: an ongoing pandemic. Int J Clin Pract. 2007;61:269–280. [PubMed: 17263714]
- 7.
- Hill JO, Peters JC, Wyatt HR. The role of public policy in treating the epidemic of global obesity. Clin Pharmacol Ther. 2007;81:772–775. [PubMed: 17314927]
- 8.
- Dehghan M, Akhtar-Danesh N, Merchant AT. Childhood obesity, prevalence and prevention. Nut. J. 2005;4:24. [PMC free article: PMC1208949] [PubMed: 16138930]
- 9.
- Wyatt SB, Winters KP, Dubbert PM. Overweight and obesity: prevalence, consequences, and causes of a growing public health problem. Am J Med Sci. 2006;331:166–174. [PubMed: 16617231]
- 10.
- Orio F Jr, Palomba S, Cascella T, Savastano S, Lombardi G, Colao A. Cardiovascular complications of obesity in adolescents. J Endocrinol Invest. 2007;30:70–80. [PubMed: 17318026]
- 11.
- Reuben A. Alcohol and the liver. Curr. Opin Gastroenterol. 2008;24:328–338. [PubMed: 18408461]
- 12.
- Purohit V, Russo D, Coates PM. Role of fatty liver, dietary fatty acid supplements, and obesity in the progression of alcoholic liver disease: introduction and summary of the symposium. Alcohol. 2004;34:3–8. [PubMed: 15670659]
- 13.
- McClain CJ, Mokshagundam SPL, Barve SS, Song Z, Hill DB, Chen T, Deaciuc I. Mechanisms of non-alcoholic steatohepatitis. Alcohol. 2004;34:67–79. [PubMed: 15670668]
- 14.
- Parekh S, Anania FA. Abnormal lipid and glucose metabolism in obesity: implications for nonalcoholic fatty liver disease. Gastroenterol. 2007;132:2191–2207. [PubMed: 17498512]
- 15.
- Browning JD, Horton JD. Molecular mediators of hepatic steatosis and liver injury. J Clin Invest. 2004;114:147–152. 2004. [PMC free article: PMC449757] [PubMed: 15254578]
- 16.
- Reddy JK, Rao MS. Lipid metabolism and liver inflammation. II. Fatty liver disease and fatty acid oxidation. Am J Phsyiol Gastrointest Liver Physiol. 2006;290:G852–G858. [PubMed: 16603729]
- 17.
- Moscatiello S, Manini R, Marchesini G. Diabetes and liver disease: an ominous association. Nutrition, Metabolism & Cardiovascular Diseases. 2007;17:63–70. [PubMed: 17164082]
- 18.
- Neuschwander-Tetri BA. Fatty liver and the metabolic syndrome. Current Opin Gastroenterol. 2007;23:193–198. 2007. [PubMed: 17268250]
- 19.
- Targher G, Bertolini L, Padovani R, Rodella S, Tessari R, et al. Prevalence of nonalcoholic fatty liver disease and its association with cardiovascular disease among type 2 diabetic patients. Diabetes Med. 2006;23:403–409. [PubMed: 16620269]
- 20.
- Bondini S, Younossi ZM. Non-alcoholic fatty liver disease and hepatitis C infection. Minerva Gastroenterol Dietol. 2006;52:135–143. [PubMed: 16557185]
- 21.
- Ibdah JA. Acute fatty liver of pregnancy: an update on pathogenesis and clinical implications. World J Gastroenterol. 2006;12:7397–7404. [PMC free article: PMC4087582] [PubMed: 17167825]
- 22.
- Rajasri AG, Srestha R, Mitchell J. Acute fatty liver of pregnancy (AFLP) an overview. J Obstetrics and Gynaecol. 2007;27:237–240. [PubMed: 17464801]
- 23.
- Wu JC, Merlino G, Fausto N. Establishment and characterization of differentiated, nontransformed hepatocyte cell lines derived from mice transgenic for transforming growth factor alpha. Proc. Natl. Acad. Sci USA. 1994;91:674–678. [PMC free article: PMC43011] [PubMed: 7904757]
- 24.
- Fujimoto Y, Itabe H, Sakai J, Sakai J, Makita M, Noda J, Mori M, Higashi Y, Kojima S, Takano T. Identification of major proteins in the lipid droplets-enriched fraction isolated from the human hepatocyte cell line HuH7. Biochimica et Biophysica Acta. 2004;1644:47–59. [PubMed: 14741744]
- 25.
- Fujimoto Y, Onoduka J, Homma KJ, Yamaguichi S, Mori M, Higashi Y, Makita M, Kinoshita T, Noda JI, Itabe H, Takano T. Long-chain fatty acids induce lipid droplets formation in a cultured human hepatocyte in a manner dependent of acyl-CoA synthetase. Biol Pharm Bull. 2006;29:2174–2180. [PubMed: 17077510]
- 26.
- Fujimoto Y, Itabe H, Kinoshita T, Homma KJ, Onoduka, et al. Involvement of ACSL in local synthesis of neutral lipids in cytoplasmic lipid droplets in human hepatocyte HuH7. J Lipid Res. 2007;48:1280–1292. [PubMed: 17379924]
- 27.
- Gimeno RW. Fatty acid transport proteins. Current Opinion in Lipidology. 2007;18:271–276. [PubMed: 17495600]
- 28.
- Coleman R, Lewin TM, Van Horn CG, Gonzalez-Baró MR. Do long-chain acyl-CoA synthetases regulate fatty acid entry into synthetic versus degradative pathways? J Nutr. 2002;132:2123–2126. [PubMed: 12163649]
- 29.
- Lewin TM, Kim JH, Granger DA, Vance JE, Coleman RA. Acyl-CoA synthetase isoforms 1, 4, and 5 are present in different subcellular membranes in rat liver and can be inhibited independently. J Biol Chem. 2001;276:24674–24679. [PubMed: 11319232]
- 30.
- Van Horn CG, Caviglia Jm, Li LO, Wang S, Granger DA, Coleman RA. Characterization of recombinant long-chain rat acyl-CoA synthetase isoforms 3 and 6: identification of a novel variant of isoform 6. Biochemistry. 2005;44:1635–1642. [PubMed: 15683247]
- 31.
- Turkish A, Sturley SL. Regulation of triglyceride metabolism. I. Eukaryotic neutral lipid synthesis: “Many ways to skin ACTA or a DGAT” Am J. Physiol. Gastrointest Liver Physiol. 2007;292:G953–G957. [PubMed: 17095752]
- 32.
- Matsuda D, Tomoda H. DGAT inhibitors for obesity. Curr. Opin. Investig Drugs. 2007;8:836–841. [PubMed: 17907060]
- 33.
- Wolins NE, Quaynor BK, Skinner JR, et al. S3–12, adipophilin, and TIP47 package lipid in adipocytes. Journal of Biological Chemistry. 2005;280:19146–19155. [PubMed: 15731108]
- 34.
- Athenstaedt K, Zweytick D, Jandrositz A, Kohlwein SD, Daum G. Identification and characterization of major lipid particle proteins of the yeast Saccharomyces cerevisiae. J Bacteriol. 1999;181:6441–6448. [PMC free article: PMC103780] [PubMed: 10515935]
- 35.
- Brasaemle DL, Dolios G, Shapiro L, Wang R. Proteomic analysis of proteins associated with lipid droplets of basal and lipolytically stimulated 3T3-L1 adipocytes. J Biol Chem. 2004;279:46835–46842. [PubMed: 15337753]
- 36.
- Beller M, Riedel D, Jansch L, Dieterich G, Wehland J, Jackle H, Kuhnlein RP. Characterization of the Drosophila lipid droplet subproteome. Mol Cell Proteomics. 2006;5:1082–1094. [PubMed: 16543254]
- 37.
- Robenek MJ, Severs NJ, Schlattmann K, et al. Lipids partition caveolin-1 from ER membranes into lipid droplets: updating the model of lipid droplet biogenesis. FASEB J. 2004;18:866–8. [PubMed: 15001554]
- 38.
- Tomoda H, Igarashi K, Cyong JC, Omura S. Evidence for an essential role of long chain acyl-CoA synthetase in animal cell proliferation. Inhibition of long chain acyl-CoA synthetase by triacsins caused inhibition of Raji cell proliferation. J. Biol. Chem. 1991;266:4214–4219. [PubMed: 1999415]
- 39.
- Yamamoto, et al. Coenzyme A: Diacylglycerol acyltransferase 1 inhibitor ameliorates obesity, liver steatosis, and lipid metabolism abnormality in KKAy mice fed high-fat or high-carbohydrate diets. Eur J Pharmacol. 2010;640:243–249. [PubMed: 20478303]
- 40.
- Matsuda D, Tomoda H. Triazolo compounds useful as diacylglycerol acyltranserase1 inhibitor- WO2009126624. Expert Opin Ther Pat. 2010;20:1097–1102. [PubMed: 20509774]
- 41.
- Nakada Y, et al. Novel Acyl Coenzyme A: Diacylglycerol Acyltransferase 1 Inhibitors -synthesis and biological activities of N-(substituted heteroaryl)-4-(substituted phenyl)-4-oxobutanamides. Chem Pharm Bull. 2010;58:673–679. [PubMed: 20460795]
- 42.
- Schwenk RW, et al. Fatty acid transport across the cell membrane: regulation by fatty acid transporters. Prostag Leukotrienes and Essenstial Fatty Acids. 2010;82:149–154. [PubMed: 20206486]
- 43.
- Järveläinen HA, Lukkari Ta, Heinaro S, Sippel H, Lindros KO. The antiestrogen toremifene protects against alcoholic liver injury in female rats. J Hepatol. 2001;35:46–52. [PubMed: 11495041]
- 44.
- Kaviarasan S, viswanathan P, Anuradha CV. Fenugreek seed (Trigonella foenum graecum) polyphenols inhibit ethanol-induced collagen and lipid accumulation in rat liver. Cell Biol. Toxicol. 2007 in press. [PubMed: 17453353]
- 45.
- Bergheim I, Guo L, Davis MA, et al. Metformin prevents alcohol-induced liver injury in the mouse: critical role of pasminogen activator inhibitor-1. Gastroenterol. 2006;130:2099–2112. [PMC free article: PMC2648856] [PubMed: 16762632]
- 46.
- Koyama N, Inoue Y, Sekine M, Hayakawa Y, Homma H, Omura S, Tomoda H. Relative and absolute stereochemistry of quinadoline B, an inhibitor of lipid droplet synthesis in macrophages. Organic Letts. 2007;9:425–428. [PubMed: 18922003]
- 47.
- Yamazaki H, Kobayashi K, Matsuda D, Nonaka K, Masuma R, Omura S, Tomoda H. Pentacecilides, new inhibitors of lipid droplet formation in mouse macrophages, produced by Penicillium cecidicola FKI-3765-1: I. Taxonomy, fermentation, isolation and biological properties. The Journal of Antibiotics. 2009;62:195–200. [PubMed: 19300470]
- 48.
- Bushway P*, Azimi B, Heynen-Genel S* Optimization and Application of Median Filter Corrections to Relieve Diverse Spatial Patterns in Microtiter Plate Data. Journal of Biomolecular Screening. 2011;16(9):1068–80. *Authors contributed equally to the work. 2011. [PMC free article: PMC4079548] [PubMed: 21900202]
6. Supplementary Information
6.1. Assay Details
High Throughput Imaging Assay for Hepatic Lipid Droplet Formation
The dominant cellular basis for obesity is increased accumulation of triglycerides in lipid droplets within the cell. The two major cell types in which lipid droplet formation leads to pathological problems are adipocytes and hepatocytes. This phenotypic image-based assay monitors the intracytoplasmic formation and accumulation of lipid droplets in a murine hepatocyte cell line, AML12, upon their treatment with oleic acid in the presence and absence of potential inhibitory compounds. Lipid droplets are visualized after cell fixation with Bodipy dye staining, while nuclei are visualized by DAPI staining. Automated image process algorithms the quantitate the number, size and distribution of lipid droplets.
Hepatic Lipid Droplet Formation Assay Protocol
Assay Materials
- 384-well plates, black with clear bottom (Greiner# 781091)
- AML12 cells (mouse hepatocytes) were obtained from the ATCC
- Culture Media: phenol-red free DMEM with L-glutamine, Pen-strep, and 10% Fetal Bovine Serum
- Oleic Acid Working Solution: water soluble Oleic Acid (Sigma, O1257, 5mM stock in PBS) diluted to 1mM in PBS
- Positive Control Working Solution: Triacsin-C (Biomol, E1218, 5mM stock in DMSO) diluted to 77.1μM in PBS. Additional DMSO is added to achieve a DMSO concentration of 2%.
- Negative Control Working Solution: 2% DMSO in water.
- Fixative Working Solution: 6% Paraformaldehyde (PFA) in PBS.
- Permeabilization Buffer Working Solution: 0.1% BSA (Sigma, A7888) and 0.01% Saponin (Sigma, 84510) in PBS
- Lipid Stain Working Solution: BODIPY 493/503 (Invitrogen, D3922) diluted to 5μg/mL in PBS.
- Nuclear Stain Working Solution: DAPI (Invitrogen, D1306) diluted to 150ng/ml in DAPI buffer (10mM TRIS, 10mM EDTA, 100mM NaCl, pH 7.4).
Assay Protocol
- 45μL of cell suspension (220,000 cells/ml in culture medium) was dispensed in each well of the assay plates using a Wellmate bulk dispenser.
- Incubate plates overnight or approx. 20 hours at 37 degrees C and 5% CO2.
- 3.5μL of 100μM compound solution was added to columns 3 through 24 of the assay plates for a final assay compound concentration of 6.5μM and 0.13% DMSO. Compound addition was done on a Biomek FX with 384-head dispenser (Beckman).
- 3.5μl of negative control (2% DMSO) working solution was added to column 2 using the Biomek FX with 384-head dispenser for a final assay concentration of 0.13% DMSO.
- 3.5μL of the positive control (77.1μM Triacsin-C) working solution was added to column 1 of each plate manually for a final assay concentration of 5μM Triacsin-C and 0.13% DMSO.
- 5.5μL of oleic acid working solution was added to each well using the Biomek FX with 384-head dispenser for a final assay oleic acid concentration of 100μM.
- Plates were incubated overnight at 37 degree C and 5% CO2.
- Media was aspirated leaving 20μL liquid in each well using a Titertek plate washer.
- 40μL of fixative working solution was added to each well using a Wellmate bulk dispenser (Matrix) for a final concentration of 4% PFA and plates were incubated for 40 minutes at room temperature.
- Fixative was aspirated and plates were washed twice with 50μL PBS leaving 20ul liquid in each well using a Titertek plate washer.
- 40μL of permeabilization buffer working solution was added to each well using the Wellmate bulk dispenser and plates were incubated for 15 minutes at room temperature.
- Permeabilization buffer was aspirated and plates were washed twice with 50μL PBS leaving 20ul liquid in each well using a Titertek plate washer.
- 40μL of lipid stain working solution was added to each well using the Wellmate bulk dispenser (Matrix) for a final concentration of 3.3 μg/ml and plates were incubated for 1 hour at room temperature.
- Stain solution was aspirated and plates were washed twice with 50μL PBS leaving 20ul liquid in each well using a Titertek plate washer.
- 40μL of DAPI working solution was added using a Wellmate bulk dispenser for a final DAPI concentration of 100ng/ml and plates were sealed.
HCS System Settings and Image Analysis Protocol
- Image acquisition was performed on an Opera QEHS (Perkin Elmer) with 45 plate capacity loader/stacker and the following settings:
- -
20× 0.45 NA air objective
- -
Acquisition camera set to 2-by-2 binning for an image size of 688 by 512 pixels
- -
2 channels acquired sequentially: Exp1Cam1 = Bodipy 493/503 (lipid droplets) using 488 nm laser excitation and 540/70 emisssion filters, Exp2Cam2 = DAPI (nuclei) using 365 nm Xenon lamp excitation and 450/50 emission filters
- -
2 fields per well
- Image analysis was performed using the CyteSeer software (Vala Sciences) with the “Lipid Droplets” algorithm where “Nucleus” represents DAPI-stained nuclei and “Lipid” represents Bodipy 493/503 stained lipid droplets. The following CyteSeer software settings were used:
- CHANNEL 1: “Nucleus”
- -
Nucleus Enabled: TRUE
- -
Nucleus Folder Name: Exp2Cam4
- -
Nucleus Thresholding Method: Savitsky-Golay
- -
Nucleus Sensitivity: 500.00%
- -
Nucleus Filtering Method: None
- -
Nucleus Filtering Radius: 1
- -
Nucleus Minimum Size: 5
- CHANNEL 2: “Lipid”
- -
Lipid Enabled: TRUE
- -
Lipid Folder Name: Exp1Cam1
- -
Lipid Thresholding Method: Otsu
- -
Lipid Sensitivity: 100.00%
- -
Lipid Filtering Method: None
- -
Lipid Filtering Radius: 1
- -
Lipid Minimum Size: 1
- Well averages of cell-by-cell metrics calculated from...
- -
NUCLEI IMAGES: cell count (“CellCount”), nuclear area (“AreaNm”), integrated intensity of the nucleus (“TIINiNm”),
- -
CELL (LIPID DOPLET) IMAGES: area of the lipid droplet mask (“AreaLm”=raw data, “AREALm_HMF”=Hybrid-Median-Filter corrected for systemic plate effects), integrated intensity of the lipid droplets (“TIILiLm”=raw data, “TIILiLm_HMF”= Hybrid-Median-Filter corrected for systemic plate effects),
- Actives were determined using CBIS software (ChemInnovations) by calculating the % inhibition of the “TIILiLm_HMF” metric and using a hit criteria of %inhibition >50%. Wells with cell counts <300 in the 2 acquired images were flagged cytotoxic/low cell count. All flagged wells were excluded from hit selection and were assigned an outcome of “inconclusive”.
Activity Scoring: Compounds with a %Inhibition >= 50% at 6. 5 μM concentration and greater than 500 cells are defined as actives in this assay. Wells with cell counts <300 in the 2 acquired images were flagged cytotoxic/low cell count. All flagged wells were excluded from hit selection and were assigned an outcome of “inconclusive”.
- First tier (0–40 range) is reserved for primary screening data. The score is correlated with % displacement in the assay demonstrated by a compound at 6.5 μM concentration:
- If primary % inhibition is less than 0%, then the assigned score is 0
- If primary % inhibition is greater than 100%, then the assigned score is 40
- If primary % inhibition is between 0% and 100%, then the calculated score is (% Inhibition)*0.4
- Second tier (41–80 range) is reserved for dose-response confirmation data and is not applicable to this assay.
- Third tier (81–100 range) is reserved for resynthesized true positives and their analogues and is not applicable to this assay.
6.2. Probe Characterization 1H-NMR Spectra and LC-MS data


- PMCPubMed Central citations
- PubChem BioAssay for Chemical ProbePubChem BioAssay records reporting screening data for the development of the chemical probe(s) described in this book chapter
- PubChem SubstanceRelated PubChem Substances
- PubMedLinks to PubMed
- Triacsin C reduces lipid droplet formation and induces mitochondrial biogenesis in primary rat hepatocytes.[J Bioenerg Biomembr. 2017]Triacsin C reduces lipid droplet formation and induces mitochondrial biogenesis in primary rat hepatocytes.Dechandt CRP, Zuccolotto-Dos-Reis FH, Teodoro BG, Fernandes AMAP, Eberlin MN, Kettelhut IC, Curti C, Alberici LC. J Bioenerg Biomembr. 2017 Oct; 49(5):399-411. Epub 2017 Sep 16.
- Compound K modulates fatty acid-induced lipid droplet formation and expression of proteins involved in lipid metabolism in hepatocytes.[Liver Int. 2013]Compound K modulates fatty acid-induced lipid droplet formation and expression of proteins involved in lipid metabolism in hepatocytes.Kim MS, Lee KT, Iseli TJ, Hoy AJ, George J, Grewal T, Roufogalis BD. Liver Int. 2013 Nov; 33(10):1583-93. Epub 2013 Sep 2.
- Review Non-Alcoholic Fatty Liver Disease.[Adv Exp Med Biol. 2017]Review Non-Alcoholic Fatty Liver Disease.Engin A. Adv Exp Med Biol. 2017; 960:443-467.
- Discovery of 5,7-Dimethoxy-2-(3,4,5-trimethoxyphenoxy)-chromen-4-one with Lipid Lowering Effects in Hepatocytes.[Pharmaceuticals (Basel). 2022]Discovery of 5,7-Dimethoxy-2-(3,4,5-trimethoxyphenoxy)-chromen-4-one with Lipid Lowering Effects in Hepatocytes.Chang YH, Yen CH, Lai CC, Lai HY, Hung HY. Pharmaceuticals (Basel). 2022 Apr 4; 15(4). Epub 2022 Apr 4.
- Review Recent insights into the molecular pathophysiology of lipid droplet formation in hepatocytes.[Prog Lipid Res. 2014]Review Recent insights into the molecular pathophysiology of lipid droplet formation in hepatocytes.Sahini N, Borlak J. Prog Lipid Res. 2014 Apr; 54:86-112. Epub 2014 Mar 6.
- Potent inhibitors of lipid droplet formation - Probe Reports from the NIH Molecu...Potent inhibitors of lipid droplet formation - Probe Reports from the NIH Molecular Libraries Program
- Therapeutic Inhibitors of Phosphomannose Isomerase - Probe 2 - Probe Reports fro...Therapeutic Inhibitors of Phosphomannose Isomerase - Probe 2 - Probe Reports from the NIH Molecular Libraries Program
- Re-evaluation of Some Organic Chemicals, Hydrazine and Hydrogen PeroxideRe-evaluation of Some Organic Chemicals, Hydrazine and Hydrogen Peroxide
Your browsing activity is empty.
Activity recording is turned off.
See more...