Copyright Notice
This is a work of the US government and distributed under the terms of the Public Domain

An official website of the United States government

NCBI Bookshelf. A service of the National Library of Medicine, National Institutes of Health.

NIEHS Report
Scott S. Auerbach, Mamta V. Behl, Bradley J. Collins, Michelle C. Cora, Jennifer M. Fostel, Ying F. Liu, Jeanne Luh, Georgia K. Roberts, Kelly A. Shipkowski, Suramya Waidyanatha, and AtLee T.D. Watson.
Author Information and Affiliations2-Ethylhexyl diphenyl phosphate (EHDP) is an organophosphate flame retardant currently on the market that is used as a replacement for phased-out polybrominated diphenyl ethers. Toxicological information on this class of chemicals is sparse. A short-term, in vivo transcriptomic study was used to assess the biological potency of EHDP.
Scientists at the Division of Translational Toxicology, National Institute of Environmental Health Sciences conducted this short-term in vivo biological potency study on EHDP in young adult male Sprague Dawley (Hsd:Sprague Dawley® SD®) rats. EHDP was formulated in corn oil and administered once daily for 4 consecutive days by gavage. EHDP was tested at six doses (0, 61, 123, 245, 489, and 979 mg/kg body weight [mg/kg] corresponding to 0, 0.169, 0.338, 0.675, 1.35, and 2.7 mmol/kg). On study day 4, animals were euthanized, standard toxicological measures were assessed, and the liver was assayed in gene expression studies using Affymetrix microarrays. Modeling was conducted to identify the benchmark doses (BMDs) associated with apical toxicological endpoints and transcriptional changes in the liver. A benchmark response of one standard deviation was used to model all endpoints.
Several clinical pathology and organ weight measurements showed dose-related changes from which BMD values could be obtained. The effects include decreased serum bile salt/acid concentration, increased serum high-density lipoprotein cholesterol concentration, and increased relative liver weight. The BMDs and benchmark dose lower confidence limits (BMDLs) were 20.3 (9.3), 36.8 (18.3), and 39.4 (17.2), respectively. Although serum cholinesterase activity was significantly decreased in all dosed groups (31%–54% decrease), beginning with 61 mg/kg (the lowest-observed-effect level), its BMD value was below the lower limit of extrapolation (<20.3 mg/kg).
Two Gene Ontology biological processes had BMD median values <20.3 mg/kg, which relate to prostaglandin metabolic process and xenobiotic catabolic process. The most sensitive gene sets for which a reliable estimate of the BMD could be made were long-chain fatty acid biosynthetic process and glutathione metabolic process with median BMDs of 23.8 and 29.4 mg/kg, respectively, and both with a median BMDL of 15.2 mg/kg. Four individual genes, Ddit4, Ugt2b17, Ces2c, and Gstt3, had BMD values <20.3 mg/kg. All four genes were upregulated. The most sensitive upregulated genes with reliable BMD estimates included Aldh1a1, Cryl1, Me1, and App with BMDs (BMDLs) of 21.0 (12.8), 23.0 (14.0), 23.6 (14.5), and 28.8 (18.4) mg/kg, respectively. The most sensitive downregulated genes with reliable BMD estimates were Slc34a2 and Slc6a6 with BMDs (BMDLs) of 25.8 (14.9) and 30.7 (20.2) mg/kg, respectively.
Taken together, the most sensitive gene set BMD (BMDL) median, individual gene BMD (BMDL), and apical endpoint BMD (BMDL) values that could be reliably determined occurred at 23.8 (15.2), 21.0 (12.8), and 20.3 (9.3) mg/kg, respectively. The BMDs (BMDLs) could not be determined for two gene sets and four individual genes and were estimated to be <20.3 mg/kg. Serum cholinesterase inhibition was also estimated to be <20.3 mg/kg. Future studies investigating lower doses would be helpful to obtain more accurate estimates of BMD values for the most sensitive gene sets and genes and for cholinesterase inhibition.
The National Institute of Environmental Health Sciences (NIEHS) is one of 27 institutes and centers of the National Institutes of Health, which is part of the U.S. Department of Health and Human Services. The NIEHS mission is to discover how the environment affects people in order to promote healthier lives. NIEHS works to accomplish its mission by conducting and funding research on human health effects of environmental exposures; developing the next generation of environmental health scientists; and providing critical research, knowledge, and information to citizens and policymakers who are working to prevent hazardous exposures and reduce the risk of disease and disorders connected to the environment. NIEHS is a foundational leader in environmental health sciences and committed to ensuring that its research is directed toward a healthier environment and healthier lives for all people.
The NIEHS Report series began in 2022. The environmental health sciences research described in this series is conducted primarily by the Division of Translational Toxicology (DTT) at NIEHS. NIEHS/DTT scientists conduct innovative toxicology research that aligns with real-world public health needs and translates scientific evidence into knowledge that can inform individual and public health decision-making.
NIEHS reports are available free of charge on the NIEHS/DTT website and cataloged in PubMed, a free resource developed and maintained by the National Library of Medicine (part of the National Institutes of Health).
This report was modeled after the NTP Research Report on In Vivo Repeat Dose Biological Potency Study of Triphenyl Phosphate (CAS No. 115-86-6) in Male Sprague Dawley (Hsd:Sprague Dawley® SD®) Rats (Gavage Studies) (https://doi.org/10.22427/NTP-RR-8), which was reviewed internally at the National Institute of Environmental Health Sciences and peer reviewed by external experts. Importantly, these reports employ mathematical model-based approaches to identify and report potency of dose-responsive effects and do not attempt more subjective interpretation (i.e., make calls or reach conclusions on hazard). The peer reviewers of the initial 5-day research report determined that the study design, analysis methods, and results presentation were appropriate. The study design, analysis methods, and results presentation employed for this study are identical to those previously reviewed, approved, and reported; therefore, following internal review, the NIEHS Report on the In Vivo Repeat Dose Biological Potency Study of 2-Ethylhexyl Diphenyl Phosphate (CASRN 1241-94-7) in Male Sprague Dawley (Hsd:Sprague Dawley® SD®) Rats (Gavage Studies) was not subjected to further external peer review.
Publisher: National Institute of Environmental Health Sciences
Publishing Location: Research Triangle Park, NC
ISSN: 2768-5632
DOI: https://doi.org/10.22427/NIEHS-02
Report Series: NIEHS Report Series
Report Series Number: 02
Official citation: Auerbach SS, Behl MV, Collins BJ, Cora MC, Fostel JM, Liu YF, Luh J, Roberts GK, Shipkowski KA, Waidyanatha S, Watson ATD. 2022. NIEHS report on the in vivo repeat dose biological potency study of 2-ethylhexyl diphenyl phosphate (CASRN 1241-94-7) in male Sprague Dawley (Hsd:Sprague Dawley® SD®) rats (gavage studies). Research Triangle Park, NC: National Institute of Environmental Health Sciences. NIEHS Report 02.
This work was supported by the Intramural Research Program (ES103316, ES103318, ES103319, ES102505) at the National Institute of Environmental Health Sciences (NIEHS), National Institutes of Health and performed for NIEHS under contracts GS00Q14OADU417 (Order No. HHSN273201600015U), HHSN273201400020C, HHSN316201200054W, and HHSN291200775561C.
2-Ethylhexyl diphenyl phosphate (EHDP) is an organophosphate flame retardant (OPFR). OPFRs are organic phosphate esters used in a diverse collection of products to interrupt or hinder combustion.1 OPFRs can leach from treated materials and persist in the environment.2 They have been detected in indoor air, household dust, wastewater treatment plant effluent, drinking water, and wildlife samples.3-6 The literature contains little information on the incidence and potency of health effects associated with exposure to this chemical class. For this reason, OPFRs were nominated to the National Institute of Environmental Health Sciences for toxicological characterization.
Reported here are the results of a repeat dose study of EHDP performed in male rats. The goal of this study is to provide a rapid assessment of in vivo biological potency by evaluating a combination of traditional toxicological endpoints and transcriptomics analysis to broadly query biological space for any dose-related change. The justification for using this type of assessment relates to the observation that gene set benchmark dose values from short-term transcriptomic studies have been shown to approximate dose responsiveness of the most sensitive apical endpoints from resource intensive guideline toxicological assessments (e.g., carcinogenicity).7,8 Importantly, the study reported here is not intended to assess or identify hazards. In particular, any observations related to traditional toxicological hazards gleaned from qualitative interpretation of the transcriptomics data should be considered hypotheses requiring further evaluation.
Young adult male Sprague Dawley (Hsd:Sprague Dawley® SD®) rats were obtained from Harlan Laboratories, Inc. (now Envigo, Indianapolis, IN). Males were selected because of the historical precedent of using males in transcriptomic studies to avoid challenges with hormonal cyclicity in female rats that can affect interpretation of gene expression data. On receipt, the rats were 7–8 weeks of age. Animals were quarantined for 7 days, and then randomly assigned to one of six dose groups, each containing five rats. The rats in each dose group then were administered 2-ethylhexyl diphenyl phosphate (EHDP) by gavage in corn oil at a dose level of 0, 61, 123, 245, 489, or 979 mg/kg body weight. These doses correspond to molar equivalencies of 0, 0.169, 0.338, 0.675, 1.35, and 2.7 mmol/kg. Corn oil was selected as the vehicle on the basis of physical and chemical properties that indicated the test article would exhibit maximal solubility in corn oil relative to other commonly used vehicles. Dosing of the animals with the test article occurred on 4 consecutive days. Dosage volume was 5 mL/kg body weight and was based on the most recently measured body weight. Euthanasia, blood/serum collection, and tissue sample collection were completed on the day following the final administration of the test article (study day 4). Animal identification numbers and microarray data file names for each animal are presented in Appendix A.
Dose selection was informed by National Toxicology Program (NTP) subchronic studies of tricresyl phosphate, a chemical structurally similar to EHDP. At dose levels of approximately 1,000 mg per kg body weight per day (mg/kg/day) for 90 days, tricresyl phosphate produced significant histopathological manifestations in the liver of rats, which indicated the animals were adequately challenged. An equimolar dose of EHDP was estimated to be approximately 979 mg/kg/day; thus, this dose was selected as the highest dose in the present study.
EHDP (CASRN 1241-94-7; C20H27O4P; molar mass 362.4 g/mol) was obtained from TCI America (Portland, OR; lot BKUNE). The identity was confirmed and the purity (98.5%) was estimated using gas chromatography/mass spectrometry (GC/MS).
Dose formulations were prepared in corn oil at target concentrations of 0 (vehicle), 0.0338, 0.0676, 0.135, 0.270, and 0.540 mmol/mL, analyzed by GC with flame ionization detection, and shipped to Alion (Research Triangle Park, NC). All formulations were within ±10% of target concentrations, and no EHDP was detected in any control formulation. The stability of the corn oil formulations was assessed using the 0.0338 mmol/mL concentration for up to 21 days when stored at ambient temperature in sealed glass bottles under inert gas; the measured concentration was within 10% of the nominal concentration on day 0, demonstrating the stability during the period of use. All chemistry activities were conducted by MRIGlobal (Kansas City, MO).
Standard clinical observations were performed within 4 hours post dosing on all study days. Animals were observed for signs of cholinesterase inhibition with specific signs recorded, such as weakness, lethargy, tremors, eye-bulging, salivation, lacrimation, and diarrhea.
Animals were weighed on the first day of dosing and on the day of necropsy. During necropsy, the entire liver and brain were removed, and organ weights were recorded for each animal.
Animals were terminated in random order by CO2/O2 (70%/30%) anesthesia one day after the final day of dosing. Blood samples were taken via cardiocentesis. Five mL of blood was collected into a tube void of anticoagulant and the serum harvested for clinical chemistry, total thyroxine (T4), and cholinesterase measurements. The following clinical chemistry parameters were measured on an Olympus AU400e chemistry analyzer (Olympus America, Inc., Irvin, TX) using reagents obtained from Beckman Coulter (Brea, CA) or Diazyme (Poway, CA): urea nitrogen, creatinine, total protein, albumin, sorbitol dehydrogenase, alanine aminotransferase, aspartate aminotransferase, bile acids, cholesterol, triglycerides, low-density lipoprotein (LDL) cholesterol, high-density lipoprotein (HDL) cholesterol, and cholinesterase. Total T4 was measured using an MP Biomedical T4 radioimmunoassay kit with an Apex automatic gamma counter (ICN Micromedic Systems, Inc., Huntsville, AL). Toxicological study data tables are presented in Appendix B.
Liver transcriptomics were performed on samples taken from three animals per dose group (randomly selected). Half the left liver lobe was processed for RNA isolation. Specifically, three pieces (3-mm cubes) were dissected and transferred to a weigh boat containing liquid nitrogen. Once flash frozen, the liver tissue for each animal was placed into a single, prechilled 2-mL cryotube and stored at or below −70°C. Frozen liver samples were shipped to the Battelle Biomedical Research Center (West Jefferson, OH) on dry ice.
The frozen liver tissues were submerged in 10 volumes of prechilled RNAlater®-ICE (Life Technologies, Carlsbad, CA) and stored at −20°C ± 10°C for a minimum of 16 hours. The tissues were removed from the RNAlater®-ICE and weighed. Each liver tissue sample, weighing between 21 and 30 mg, was added to lysis buffer and homogenized using plastic disposable pestles (Fisher Scientific, Pittsburgh, PA). Following homogenization, samples were stored at −70°C ± 10°C until RNA was isolated. Samples were thawed and centrifuged. RNA was extracted from the supernatant, subjected to DNase digestion, and isolated using the Qiagen RNeasy Mini Kit (Cat #: 74104; Qiagen, Valencia, CA). Each RNA sample was analyzed for quantity and purity by UV analysis using a NanoDrop ND-1000 Spectrophotometer (NanoDrop Technologies, Wilmington, DE). All samples were evaluated for RNA integrity using an RNA 6000 Nano Kit with an Agilent 2100 Bioanalyzer (Agilent, Santa Clara, CA) and then stored at −70°C ± 10°C until further processing.
Total RNA (100 ng), isolated from each liver sample, was used to synthesize single-stranded DNA, which was subsequently converted into a double-stranded complementary DNA (cDNA) template for transcription. An in vitro transcription (IVT) reaction, which incorporates biotinylated ribonucleotide analogs, then was used to create labeled amplified RNA (aRNA). This RNA target preparation was performed using the Affymetrix GeneChip® 3’ IVT Express Kit (Cat #: 901228; Affymetrix Inc., Santa Clara, CA) and an Eppendorf Mastercycler® thermal cycler (Eppendorf, Hamburg, Germany).
Labeled aRNA was fragmented and subsequently hybridized to the Affymetrix Rat Genome 230 2.0 Array (Cat #: 900505; 31,099 probe sets) using an Affymetrix GeneChip® Hybridization Oven 645. The arrays were washed and stained using the Affymetrix GeneChip® Hybridization Wash and Stain kit (Cat #: 900720) and a Fluidics Station 450 according to the Affymetrix-recommended protocol (FS450_0001). After washing and staining, arrays were scanned using an Affymetrix GeneChip® Scanner 3000 7G, and the raw microarray data (.CEL files) were acquired using Affymetrix GeneChip® Command Console® Software. The Rat Genome 230 2.0 Array provides coverage of more than 30,000 known transcripts; although the array provides comprehensive coverage of global transcript expression, of note is that it does not cover the entirety of the rat transcriptome.
Quality control measurements were evaluated to determine if the data generated from each Affymetrix GeneChip® array were of sufficient quality. Affymetrix-recommended guidelines for evaluating quality were used to evaluate the output files for each GeneChip® array using the R/Bioconductor package, Simpleaffy.9 The following quality control parameters were evaluated for each array: average background, scale factor, percentage of genes scored as present, 3’ to 5’ ratios for the internal control genes beta-actin and glyceraldehyde-3-phosphate dehydrogenase, values for hybridization control transcripts, and values for poly (A) controls.
For samples that failed to pass quality control evaluation due to insufficient data quality, an additional round of RNA isolation and cDNA synthesis was performed and additional GeneChip® arrays were run, which were designated with –R after each sample number.
Two approaches were employed to assess the significance of pairwise comparisons between dosed and vehicle control groups in the analysis of continuous variables. Organ and body weight data, which have approximately normal distributions, were analyzed using the parametric multiple comparison procedures of Williams10,11 and Dunnett.12 Hormone data and clinical chemistry, which typically have skewed distributions, were analyzed using the nonparametric multiple comparison methods of Shirley13 and Dunn.14 The Jonckheere test15 was used to assess the significance of dose-response trends and to determine whether a trend-sensitive test (Williams or Shirley test) was more appropriate for pairwise comparisons than a test that assumes no monotonic dose response (Dunnett or Dunn test). Trend-sensitive tests were used when the Jonckheere test was significant at p ≤ 0.01.
Prior to analysis, values identified by the outlier test of Dixon and Massey16 were examined by National Institute of Environmental Health Sciences staff. Values from animals suspected of illness due to causes other than experimental exposure and values that the laboratory indicated as inadequate due to measurement problems were eliminated from the analysis.
A no-observed-effect level (NOEL) was identified as the highest dose not showing a significant (p ≤ 0.05) pairwise difference relative to the vehicle control group. A lowest-observed-effect level (LOEL) was identified as the lowest dose demonstrating a significant (p ≤ 0.05) pairwise difference relative to the vehicle control group.
Clinical pathology, body weight, and organ weight endpoints that exhibited a significant trend and pairwise test were submitted in batch for automated benchmark dose (BMD) modeling analysis. For body weight, the BMD and benchmark dose lower confidence limit (BMDL) were reported as not determined when there were no significant results. BMD modeling and analysis was conducted using a modification of Benchmark Dose Modeling Software (BMDS) version 2.7.0. Data sets were executed using the Python BMDS interface (https://pypi.python.org/pypi/bmds; version 0.11), which allows for batch processing of multiple data sets. Data for all endpoints submitted were continuous. A default benchmark response (BMR) of 1 standard deviation (relative to control) was used for all data sets. The following BMDS 2.7.0 models were used to model the means of the data sets:
Multiple versions of the polynomial model were executed, from a polynomial of degree 2 to a polynomial of degree equal to the number of dose groups minus 1 (e.g., if a data set had five dose groups, a 2°, 3°, and 4° polynomial model would be executed). Models were initialized using BMDS 2.7.0 model defaults, including restricting the power parameter of the power model and n-parameter of the Hill model to >1 and the beta parameters of the polynomial model to positive or negative, depending on the mean response direction of the data set. For all models, either a constant or nonconstant variance model was selected as outlined in U.S. Environmental Protection Agency (EPA) BMD technical guidance17 and was implemented in the BMDS 2.7.0 software.
After model execution, BMDs were selected using the model recommendation procedures generally described17 and the automated decision logic described in Wignall et al.18 and summarized in Appendix D, Table D-1. Models were placed into one of four possible bins, depending on the results and the bin recommendation logic:
If only one model was in the viable model bin, it was selected as the best-fitting model. If the viable bin had more than one model, consistent with EPA guidance,17 either the model with the lowest Akaike information criterion (AIC) or lowest BMDL was selected. If the range of BMDL values was sufficiently close (less than threefold different), the AIC value was used; otherwise, the BMDL value was used. If no model was recommended, no BMD was presented in the results. Details on the analysis criteria and decision tree are provided in Appendix D, Table D-1 and Figure D-1, respectively. To avoid effects of model extrapolation, BMD values derived from viable models that were threefold lower than the lowest nonzero dose tested were reported as <1/3 the lowest nonzero dose tested and corresponding BMDL values were not reported.
The BMD analysis of the transcriptomic data was performed in accordance with NTP best practices for genomic dose-response modeling as reviewed by an independent panel of experts in October 2017. These recommendations are described in the 2018 publication, National Toxicology Program Approach to Genomic Dose Response Modeling.19
Probe set intensities from raw microarray data (.CEL files from Affymetrix Rat Genome 230 2.0 Arrays) were normalized by applying the Robust Multi-array Average (RMA) algorithm from the genomics analysis tool, GeneSpring GX 12.6 (Agilent Technology, Foster City, CA). The microarray studies of multiple organophosphate phosphates (data to be reported elsewhere) were performed at the same time such that .CEL files from those related studies were normalized together with the data sets collected in this study. Principal component analysis (PCA) of the primary RMA-normalized data indicated a batch effect; due to randomization of the samples in the processing and detailed metadata capture, the source of the batch effect could be identified as the hybridization date. To correct the batch effect, the primary normalized data were loaded into Partek Genomic Suite version 6.16.0812 (St. Louis, MO) and annotated with chemical exposure/dose group and hybridization date annotations. The ANOVA-based remove batch effect function in Partek Genomic Suite then was used to remove quantitative impacts from the hybridization date batch effect. Quality control of the batch-corrected, normalized data was performed by visual inspection, using a PCA plot and normalized intensity histograms (Appendix C).
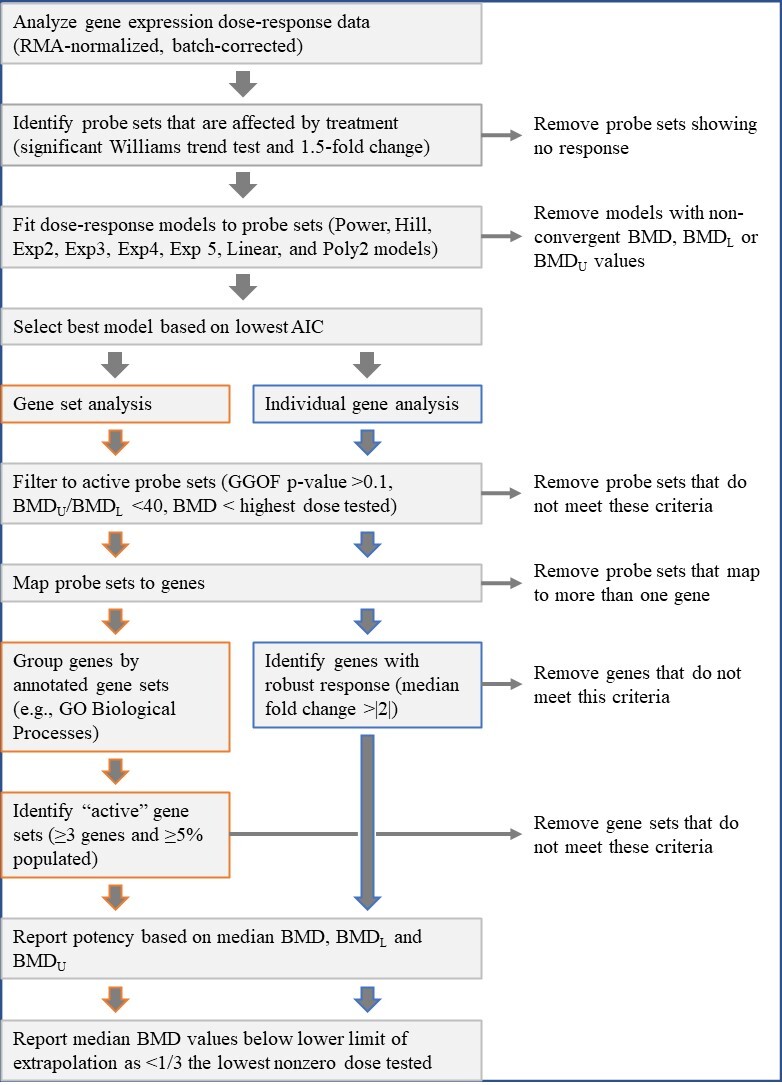
Dose-response analyses of RMA-normalized, batch-corrected probe set intensities from the EHDP study samples were performed using BMDExpress 2.20.0148 beta20 (https://github.com/auerbachs/BMDExpress-2/releases), an updated version of BMDExpress 1.41 that uses an updated modeling approach. First, control genes (AFFX-) were removed from each data set. A trend test (the Williams trend test,10,11 p ≤ 0.05) and fold change filter (1.5-fold change up or down relative to the vehicle control group for probe sets) was applied to the data set to remove probe sets demonstrating no response to chemical exposure from subsequent analysis. These filter criteria were empirically determined, with the goal of balancing false discovery with reproducibility. The criteria are consistent with the MicroArray Quality Control recommendations to combine the nominal p value threshold with a fold change filter to maximize replicability of transcriptomic findings across labs. The following dose-response models were fit to the probe sets that passed the trend test and fold change filter:
All gene expression data analyzed in BMDExpress were log2 transformed, and thus nearly all probe sets exhibit constant variance across the doses. For this reason and for efficiency purposes, each model was run assuming constant variance. Lacking any broadly applicable guidance regarding the level of change in gene expression considered to be biologically significant, a BMR of 1 standard deviation (relative to the fit at control) was used in this study. This approach enables standardization of the BMR between apical endpoints and transcriptomic endpoints and provides a standard for use across multiple chemicals tested in this rapid screening paradigm. The expression direction (upregulated or downregulated) for each probe set was determined by a trend test intrinsic to the model executables (provided by EPA) contained in BMDExpress.
To identify the best-fit model for each fitted probe set, the AIC values for each fitted model were compared and the model with the lowest AIC selected. The best model for each probe set was used to calculate the BMD, BMDL, and BMD upper confidence limit (BMDU). The specific parameter settings, selected from the BMDExpress software when performing probe set-level BMD analysis, were as follows: maximum iterations – 250, confidence level – 0.95, BMR factor – 1 (the multiplier of the SD that defined the BMD), restrict power – no restriction, and constant variance – selected. The specific model selection setting in the BMDExpress software when performing probe set-level BMD analysis was as follows: best poly model test – lowest AIC, flag Hill model with ‘k’ parameters – <1/3 the lowest nonzero dose tested, and best model selection with flagged Hill model – include flagged Hill model. The inclusion of the flagged models is a deviation from EPA guidance. The justification for this deviation relates to subsequent use of the data in which the probe set BMD values are grouped into gene sets from which a median BMD is derived. If the probe sets were removed from the analysis or forced to another model, the probe set might not be counted in the gene set analysis and could lead to loss of “active” gene sets. Importantly, most of the probe sets that produce flagged Hill models show highly potent responses and should therefore be counted in the analysis.
To perform Gene Ontology (GO; annotation accession date: 03/09/18) gene set analysis, only GO terms with ≥10 and ≤250 annotated genes measured on the gene expression platform were considered. Before sorting genes into the GO terms, the best-fit model for each probe set was subjected to a filtering process to remove those probe sets (1) with a BMD >highest dose tested, (2) that mapped to more than one gene, (3) that had a global goodness-of-fit p value ≤0.1, and (4) with a BMDU/BMDL ratio >40. GO terms that were at least 5% populated and contained three genes that passed the above criteria were considered “active” (i.e., responsive to chemical exposure). For this report, GO terms populated with identical sets of differentially expressed genes were filtered to limit redundancy in reporting based on the following selection criteria: (1) highest percentage populated and (2) most specific/highest GO level. Redundant GO terms failing to differentiate on the basis of these criteria were retained and reported. A complete list of “active” GO terms can be found in Appendix F. To avoid effects of model extrapolation, GO terms exhibiting BMD values below the lower limit of extrapolation (<1/3 the lowest nonzero dose tested) were reported as <1/3 the lowest nonzero dose tested and corresponding BMDL and BMDU values were not reported.
To perform Individual Gene Analysis, a Defined Category Analysis in BMDExpress was performed that mapped probe sets to genes using a probe-to-gene annotation file. In short, the best-fit model for each probe set was subjected to a filtering process to remove those probe sets (1) with a BMD >highest dose tested, (2) that mapped to more than one gene, (3) that had a global goodness-of-fit p value ≤0.1, and (4) with a BMDU/BMDL ratio >40. For genes that had more than one probe set represented on the microarray and passed the above filtering, a median BMD was used to estimate the BMD, BMDL, and BMDU values. To ensure only genes with a robust response were assessed for potency, genes with probe sets that had a median fold change <|2| were removed prior to reporting. A complete list of genes and their corresponding metrics can be found in Appendix F. To avoid effects of model extrapolation, genes exhibiting BMD values below the lower limit of extrapolation (<1/3 the lowest nonzero dose tested) were reported as <1/3 the lowest nonzero dose tested and corresponding BMDL and BMDU values were not reported.
A summary of the BMDExpress gene expression analysis pipeline used in this study is shown in Figure D-2.
Primary and analyzed data used in this study are available to the public at https://doi.org/10.22427/NIEHS-DATA-NIEHS-02.21
Seven rats died early in the study; one vehicle control rat was found dead and six rats died due to gavage error (two in the 61 mg/kg group, one each in the 123 and 489 mg/kg groups, and two in the 979 mg/kg group). No clinical observations were noted. A negative trend was found in terminal body weight, along with a significant decrease in the 489 mg/kg group as compared to the vehicle control group; a benchmark dose (benchmark dose lower confidence limit)—BMD (BMDL)—was not determined because no viable model was available (Table 1).
Body Weight Summary.
At study termination, a significant increase in relative liver weight and relative brain weight occurred in dose groups ≥123 mg/kg and ≥489 mg/kg, respectively; both endpoints had positive trends (Table 2). The BMD (BMDL) for increased relative liver weight was 39.4 (17.2) mg/kg and for relative brain weight was 123.7 (43.3) mg/kg. Of note is that the change in relative brain weight is an artifact of significant dose-dependent decreases in body weight. Significant trend and pairwise comparisons were not observed in absolute brain or liver weights (Appendix B).
Organ Weights Summarya.
Serum bile salt/acid concentration was significantly decreased in all dosed groups and had a negative trend with a BMD (BMDL) of 20.3 (9.3) mg/kg (Table 3). High-density lipoprotein (HDL) cholesterol concentration was significantly increased in dose groups ≥123 mg/kg with a positive trend and a BMD (BMDL) of 36.8 (18.3) mg/kg. A positive trend in serum cholesterol concentration occurred with significant pairwise comparisons at the two highest dose groups of 489 and 979 mg/kg; a BMD (BMDL) was not determined because no viable model was available. There were no other clinical chemistry findings that exhibited significant trend and pairwise comparisons (Appendix B).
Clinical Chemistry Summary.
Serum cholinesterase activity was significantly decreased in all dosed groups by 31%–54%, beginning with the 61 mg/kg group; a BMDL was not reportable because the BMD was below the lower limit of extrapolation (<20.3 mg/kg) (Table 4). Testing lower doses in future studies will therefore be necessary to calculate a BMD associated with decreased cholinesterase in the context of 2-ethylhexyl diphenyl phosphate (EHDP) exposure. No significant trend and pairwise comparisons were observed in total thyroxine concentration (Appendix B).
Hormones and Enzymes Summary.
A summary of the calculated BMDs for each toxicological endpoint is provided in Table 5. The lowest-observed-effect level (LOEL) and no-observed-effect level (NOEL) are included and could be informative for endpoints that lack a calculated BMD either because no viable model was available or because the estimated BMD was <20.3 mg/kg.
BMD, BMDL, LOEL, and NOEL Summary for Apical Endpoints, Sorted by BMD or LOEL from Low to High.
Chemical-induced alterations in liver gene transcript expression were examined to determine those gene sets most sensitive to EHDP exposure. To that end, BMD analysis of transcripts and gene sets (Gene Ontology [GO] biological process) was conducted to determine the potency of the chemical to elicit gene expression changes in the liver. This analysis used transcript-level BMD data to assess an aggregate score of gene set potency (median transcript BMD) and enrichment.
The “active” gene sets with the lowest BMD median values are shown in Table 6. The gene sets in Table 6 should be interpreted with caution from the standpoint of the underlying biology and any relationship to toxicity or toxic agents referenced in the GO term definitions. The data primarily should be considered a metric of potency for chemical-induced transcriptional changes that could serve as a conservative surrogate of estimated biological potency and, by extension, toxicological potency when more definitive toxicological data are unavailable.
Top 10 Gene Ontology Biological Process Gene Sets Ranked by Potency of Perturbation, Sorted by Benchmark Dose Mediana.
Two gene sets had estimated BMD median values <20.3 mg/kg, which relate to prostaglandin metabolic process and xenobiotic catabolic process. The most sensitive GO biological processes for which a BMD value could be reliably calculated were long-chain fatty acid biosynthetic process (GO:0042759) and glutathione metabolic process (GO:0006749) with BMDs (BMDLs) of 23.8 (15.2) and 29.4 (15.2) mg/kg, respectively. The full list of affected gene sets can be found in Appendix F.
The top 10 genes (fold change >|2|, significant Williams trend test, global goodness of fit p value >0.1, and BMDU/BMDL < 40), ranked by estimated BMD are shown in Table 7. As with the GO analysis, the biological or toxicological significance of the changes in gene expression shown in Table 7 should be interpreted with caution. The data primarily should be considered a metric of potency for chemical-induced transcriptional changes that could serve as a conservative surrogate of estimated biological potency, and by extension, toxicological potency when more definitive toxicological data are unavailable.
Top 10 Genes Ranked by Potency of Perturbation, Sorted by Benchmark Dose Mediana.
The most sensitive genes, exhibiting an increase in expression, were Ddit4 (DNA damage-inducible transcript 4), Ugt2b17 (UDP glucuronosyltransferase family 2 member B17), Ces2c (carboxylesterase 2C), and Gstt3 (glutathione S-transferase, theta 3), each with an estimated BMD median value <20.3 mg/kg. The most sensitive upregulated genes with a calculated BMD were Aldh1a1 (aldehyde dehydrogenase 1 family, member A1), Cryl1 (crystallin, lambda 1), Me1 (malic enzyme 1), and App (amyloid beta precursor protein) with BMDs (BMDLs) of 21.0 (12.8), 23.0 (14.0), 23.6 (14.5), and 28.8 (18.4) mg/kg, respectively. The most sensitive downregulated genes were Slc34a2 (solute carrier family 34 member 2) and Slc6a6 (solute carrier family 6 member 6) with BMDs (BMDLs) of 25.8 (14.9) and 30.7 (20.2) mg/kg, respectively.
2-Ethylhexyl diphenyl phosphate (EHDP) is an organophosphorus flame retardant with widespread human exposure. The literature contains few toxicological data for estimating the potential adverse health effects of EHDP. This study used a transcriptomic approach and standard toxicological endpoints to estimate the in vivo biological potency of EHDP.
Serum cholinesterase activity was significantly and markedly decreased for all dosed groups. These findings are consistent with several reports that show the classic cholinesterase inhibition in organophosphates.27 As the lowest-observed-effect level for the study, cholinesterase inhibition appeared to be the most sensitive apical measure; the estimated benchmark dose (BMD) was below the lower limit of extrapolation (<20.3 mg/kg). Further studies are warranted to assess cholinesterase effects at doses <20.3 mg/kg to obtain an accurate point of departure. The most sensitive apical endpoint for which a BMD could be determined was a decrease in serum bile salt/acid concentration with a BMD and benchmark dose lower confidence limit (BMDL) of 20.3 (9.3) mg/kg. The next most sensitive apical endpoints observed were an increase in serum high density-density lipoprotein cholesterol concentration and an increase in relative liver weight with BMDs (BMDLs) of 36.8 (18.3) and 39.4 (17.2) mg/kg, respectively.
Gene set-level transcriptional changes in the liver following EHDP exposure were estimated to occur at a BMD (BMDL) as low as 23.8 (15.2) mg/kg, corresponding to long-chain fatty acid biosynthetic process (GO:0042759). Two gene sets had BMD estimates below the lower limit of extrapolation (<20.3 mg/kg). Four liver genes exhibited changes in expression at dose levels below which a reliable estimate of potency could be achieved (<20.3 mg/kg). The most sensitive gene for which a reliable BMD could be determined was Aldh1a1, with a BMD (BMDL) of 21.0 (12.8) mg/kg. Several additional genes had potency estimates in the same range (i.e., BMD <31 mg/kg and BMDL <13 mg/kg).
Under the conditions of this short-duration transcriptomic study in Sprague Dawley (Hsd:Sprague Dawley® SD®) rats, the most sensitive point of departure with a reliable estimate was a decrease in serum bile salt/acid concentration, with a BMD (BMD L) of 20.3 (9.3) mg/kg. Gene set and individual gene transcriptional changes provided potency estimates slightly higher than serum bile salts/acids. Follow-up studies that investigate transcriptional and apical endpoint changes at lower doses will be a useful future direction to determine the biological potency of EHDP more accurately.
| Animal Number | Group | Dose (mmol/kg/day) | Dose (mg/kg/day) | Survived to Study Terminationa | Array ID |
|---|---|---|---|---|---|
| 7 | Corn Oil | 0 | 0 | No | NA |
| 26 | Corn Oil | 0 | 0 | Yes | 025-052014-MW_(Rat230_2).CEL |
| 34 | Corn Oil | 0 | 0 | Yes | 061-052114-MW_(Rat230_2).CEL |
| 35 | Corn Oil | 0 | 0 | Yes | 033-052014-MW_(Rat230_2).CEL |
| 57 | Corn Oil | 0 | 0 | Yes | 065-052714-JAP_(Rat230_2).CEL |
| 5 | EHDP | 0.169 | 61 | Yes | 026-052014-MW_(Rat230_2).CEL |
| 6 | EHDP | 0.169 | 61 | No | NA |
| 11 | EHDP | 0.169 | 61 | Yes | 062-052114-MW_(Rat230_2).CEL |
| 29 | EHDP | 0.169 | 61 | Yes | 096-052814-MW_(Rat230_2).CEL |
| 58 | EHDP | 0.169 | 61 | No | NA |
| 4 | EHDP | 0.338 | 123 | Yes | 097-052814-MW_(Rat230_2).CEL |
| 17 | EHDP | 0.338 | 123 | Yes | 027-052014-MW_(Rat230_2).CEL |
| 30 | EHDP | 0.338 | 123 | No | NA |
| 37 | EHDP | 0.338 | 123 | Yes | NA |
| 54 | EHDP | 0.338 | 123 | Yes | 063-052114-MW_(Rat230_2).CEL |
| 3 | EHDP | 0.675 | 245 | Yes | 028-052014-MW_(Rat230_2).CEL |
| 14 | EHDP | 0.675 | 245 | Yes | 064-052114-MW_(Rat230_2).CEL |
| 16 | EHDP | 0.675 | 245 | Yes | NA |
| 27 | EHDP | 0.675 | 245 | Yes | NA |
| 53 | EHDP | 0.675 | 245 | Yes | 098-052814-MW_(Rat230_2).CEL |
| 15 | EHDP | 1.35 | 489 | No | NA |
| 23 | EHDP | 1.35 | 489 | Yes | 029-052014-MW_(Rat230_2).CEL |
| 45 | EHDP | 1.35 | 489 | Yes | 099-052814-MW_(Rat230_2).CEL |
| 52 | EHDP | 1.35 | 489 | Yes | NA |
| 63 | EHDP | 1.35 | 489 | Yes | 066-052714-JAP_(Rat230_2).CEL |
| 10 | EHDP | 2.7 | 979 | No | NA |
| 25 | EHDP | 2.7 | 979 | No | NA |
| 46 | EHDP | 2.7 | 979 | Yes | 030-052014-MW_(Rat230_2).CEL |
| 47 | EHDP | 2.7 | 979 | Yes | 067-052714-JAP_(Rat230_2).CEL |
| 60 | EHDP | 2.7 | 979 | Yes | 100-052814-MW_(Rat230_2).CEL |
NA = no transcriptomics data collected for selected animal.
One vehicle control rat was found dead on study day 3. Six unscheduled deaths occurred due to gavage error during exposure (study day 0: animals #15, #25; study day 1: animal #10; study day 2: animals #30, #58; study day 3: animal #6).
| Study Day | 0 mg/kg n = 4–5c | 61 mg/kg n = 3–5c | 123 mg/kg n = 4–5c | 245 mg/kg n = 5 | 489 mg/kg n = 4c | 979 mg/kg n = 3–4c |
|---|---|---|---|---|---|---|
| 0 | 254.6 ± 1.8 | 258.9 ± 1.8 | 259.0 ± 2.9 | 262.2 ± 4.7 | 257.8 ± 5.4 | 259.0 ± 2.3 |
| 4 | 272.2 ± 0.4* | 275.5 ± 6.9 | 274.1 ± 7.8 | 270.2 ± 6.1 | 247.1 ± 6.7* | 258.0 ± 5.2 |
Statistical significance for a dosed group indicates a significant pairwise test compared to the vehicle control group. Statistical significance for the vehicle control group indicates a significant trend test.
Statistically significant at p ≤ 0.05.
Study day 0 = the first day of dosing; study day 4 = the day of necropsy.
Data are displayed as mean ± standard error of the mean; body weight data are presented in grams.
Statistical analysis performed by the Jonckheere (trend) and Williams or Dunnett (pairwise) tests.
Changes in n are the result of early deaths related to gavage error and not related to chemical exposure.
| Endpoint | 0 mg/kg n = 4 | 61 mg/kg n = 3 | 123 mg/kg n = 4 | 245 mg/kg n = 5 | 489 mg/kg n = 4 | 979 mg/kg n = 3 |
|---|---|---|---|---|---|---|
| Terminal Body Weight (g) | 272.2 ± 0.4* | 275.5 ± 6.9 | 274.1 ± 7.8 | 270.2 ± 6.1 | 247.1 ± 6.7* | 258.0 ± 5.2 |
| Brain Weight Absolute (g) | 1.67 ± 0.07 | 1.80 ± 0.07 | 1.76 ± 0.03 | 1.79 ± 0.02 | 1.77 ± 0.04 | 1.74 ± 0.02 |
| Brain Weight Relatived (mg/g) | 6.14 ± 0.26** | 6.53 ± 0.11 | 6.44 ± 0.20 | 6.64 ± 0.16 | 7.19 ± 0.23** | 6.76 ± 0.17** |
| Liver Weight Absolute (g) | 10.40 ± 0.31 | 11.69 ± 0.93 | 12.40 ± 0.49* | 12.31 ± 0.25* | 11.91 ± 0.32 | 12.29 ± 0.97 |
| Liver Weight Relative (mg/g) | 38.21 ± 1.15** | 42.34 ± 2.46 | 45.20 ± 0.76** | 45.70 ± 1.68** | 48.20 ± 0.75** | 47.54 ± 2.86** |
Statistical significance for a dosed group indicates a significant pairwise test compared to the vehicle control group. Statistical significance for the vehicle control group indicates a significant trend test.
Statistically significant at p ≤ 0.05; **p ≤ 0.01.
Descriptions of organ weight endpoints and changes are provided in Appendix E.
Data are displayed as mean ± standard error of the mean.
Statistical analysis performed by the Jonckheere (trend) and Williams or Dunnett (pairwise) tests.
Relative organ weights (organ weight-to-body weight ratios) are given as mg organ weight/g body weight.
| Endpoint | 0 mg/kg n = 4 | 61 mg/kg n = 3 | 123 mg/kg n = 4 | 245 mg/kg n = 5 | 489 mg/kg n = 4 | 979 mg/kg n = 3 |
|---|---|---|---|---|---|---|
| Urea Nitrogen (mg/dL) | 12.8 ± 0.5 | 12.3 ± 1.3 | 14.0 ± 1.1 | 13.2 ± 1.4 | 12.5 ± 1.0 | 13.3 ± 0.7 |
| Creatinine (mg/dL) | 0.35 ± 0.03 | 0.32 ± 0.04 | 0.32 ± 0.03 | 0.33 ± 0.02 | 0.30 ± 0.01 | 0.34 ± 0.01 |
| Total Protein (g/dL) | 6.45 ± 0.13 | 6.80 ± 0.17 | 6.48 ± 0.19 | 6.52 ± 0.20 | 6.75 ± 0.12 | 6.83 ± 0.12 |
| Globulin (g/dL) | 2.90 ± 0.04 * | 3.10 ± 0.12 | 2.93 ± 0.06 | 3.02 ± 0.12 | 3.20 ± 0.07 | 3.20 ± 0.12 |
| A/G Ratio | 1.23 ± 0.06 * | 1.20 ± 0.03 | 1.21 ± 0.04 | 1.16 ± 0.02 | 1.11 ± 0.04 | 1.14 ± 0.04 |
| Albumin (g/dL) | 3.55 ± 0.14 | 3.70 ± 0.06 | 3.55 ± 0.15 | 3.50 ± 0.09 | 3.55 ± 0.10 | 3.63 ± 0.03 |
| Cholesterol (mg/dL) | 115.0 ± 9.1** | 113.0 ± 1.0 | 133.5 ± 2.1 | 128.6 ± 10.5 | 142.5 ± 11.1* | 150.3 ± 16.7* |
| Triglyceride (mg/dL) | 63.5 ± 11.1 | 91.7 ± 19.9 | 96.3 ± 13.4 | 75.2 ± 3.1 | 76.3 ± 12.1 | 73.0 ± 5.3 |
| LDL Cholesterol (mg/dL) | 25.8 ± 0.9 | 27.0 ± 1.5 | 28.5 ± 0.5 | 24.0 ± 1.1 | 23.5 ± 3.3 | 21.3 ± 1.2 |
| HDL Cholesterol (mg/dL) | 50.0 ± 2.7** | 54.7 ± 3.8 | 68.0 ± 2.3** | 68.0 ± 4.4* | 74.8 ± 9.9* | 87.7 ± 9.6** |
| Alanine Aminotransferase (IU/L) | 59.50 ± 9.92 | 64.67 ± 1.86 | 71.75 ± 5.92 | 66.20 ± 11.41 | 46.75 ± 7.61 | 59.67 ± 9.33 |
| Aspartate Aminotransferase (U/L) | 169.75 ± 46.17** | 123.00 ± 27.43 | 115.75 ± 22.48 | 92.20 ± 15.07 | 69.50 ± 6.40 | 92.33 ± 16.48 |
| Sorbitol Dehydrogenase (IU/L) | 14.8 ± 5.4 | 14.1 ± 1.5 | 21.8 ± 7.2 | 15.4 ± 2.7 | 12.4 ± 0.8 | 10.6 ± 2.0 |
| Bile Salts/Acids (µmol/L) | 52.2 ± 5.2** | 34.9 ± 4.2* | 22.2 ± 4.7** | 27.6 ± 2.6** | 16.5 ± 4.5** | 20.0 ± 5.0** |
Statistical significance for a dosed group indicates a significant pairwise test compared to the vehicle control group. Statistical significance for the vehicle control group indicates a significant trend test.
Statistically significant at p ≤ 0.05; **p ≤ 0.01.
A/G Ratio = ratio of albumin to globulin; LDL = low-density lipoprotein; HDL = high-density lipoprotein.
Data are displayed as mean ± standard error of the mean.
Statistical analysis performed by the Jonckheere (trend) and Shirley or Dunn (pairwise) tests.
| Endpoint | 0 mg/kg n = 4 | 61 mg/kg n = 3 | 123 mg/kg n = 4 | 245 mg/kg n = 5 | 489 mg/kg n = 4 | 979 mg/kg n = 3 |
|---|---|---|---|---|---|---|
| Total Thyroxine (µg/dL) | 3.97 ± 0.23 | 4.71 ± 0.47 | 3.77 ± 0.28 | 4.02 ± 0.16 | 3.86 ± 0.53 | 3.47 ± 0.43 |
| Cholinesterase (IU/L) | 291.3 ± 9.4** | 200.3 ± 15.6* | 196.0 ± 10.5* | 164.8 ± 19.8** | 149.0 ± 11.2** | 133.7 ± 8.1** |
Statistical significance for a dosed group indicates a significant pairwise test compared to the vehicle control group. Statistical significance for the vehicle control group indicates a significant trend test.
Statistically significant at p ≤ 0.05; **p ≤ 0.01.
Data are displayed as mean ± standard error of the mean.
Statistical analysis performed by the Jonckheere (trend) and Shirley or Dunn (pairwise) tests.
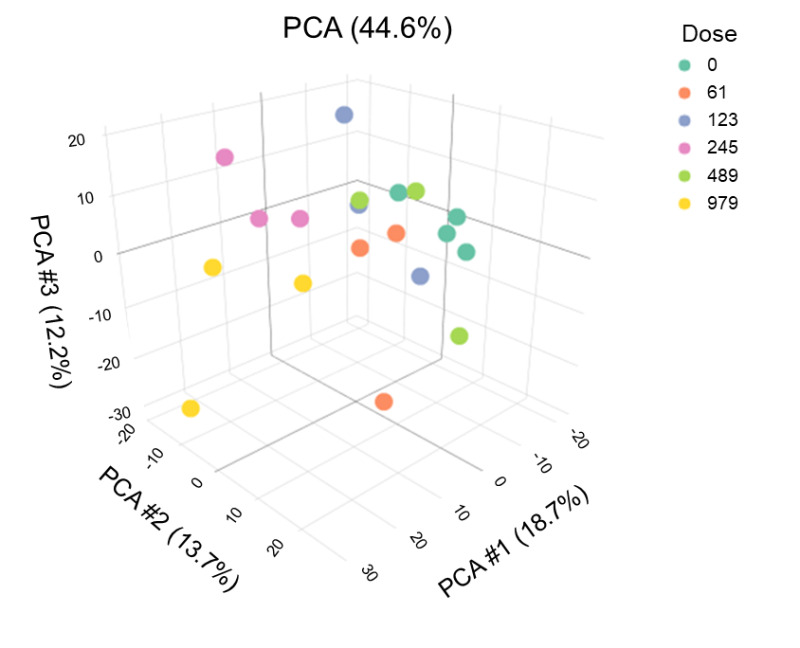
A Principal Component Analysis of the Robust Multi-array Average-normalized Data
The principal component analysis (PCA) plot enables three-dimensional visualization of global transcriptional changes and the divergence of transcript expression from individual animals (dots) within each dose group (designated by color). Dots that are spatially closer to each other indicate more similarity in global expression profiles; dots that are farther apart indicate dissimilarity in global expression profiles for those animals.
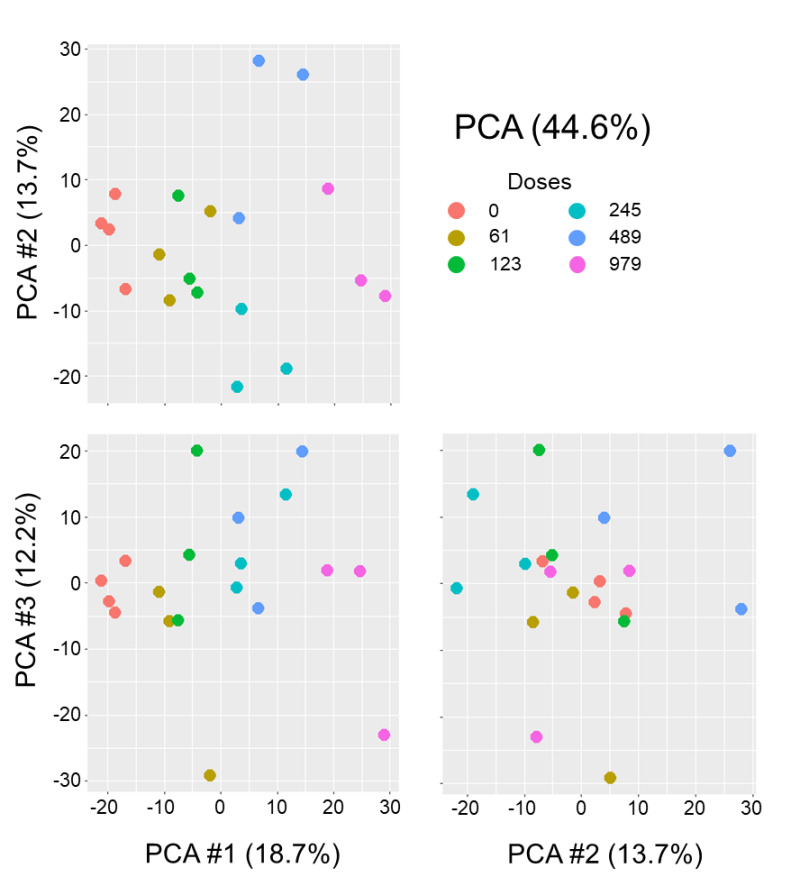
An Alternative View of the Principal Component Analysis of the Robust Multi-array Average-normalized Data
This alternative view of the principal component analysis (PCA) plot enables visualization of global transcriptional changes in two dimensions, with each plot showing a different angle, on the basis of the principal components plotted. Global transcript data are shown for individual animals (dots) within each dose group (designated by color). Dots that are spatially closer to each other indicate more similarity in global expression profiles; dots that are farther apart indicate dissimilarity in global expression profiles for those animals.
| Rule | Criteria for “Viable” | Numerical Threshold (N) | Bin Placement for Rule Failure |
|---|---|---|---|
| BMD Existence | A BMD exists. | N/A | Failure |
| BMDL Existence | A BMDL exists. | N/A | Failure |
| AIC Existence | An AIC exists. | N/A | Failure |
| Residual of Interest Existence | The residual at the dose group closest to the BMD (i.e., the residual of interest) exists. | N/A | Failure |
| Variance Model Fit | The variance model used fits the data. | N/A | Nonviable |
| Variance Model Selection | The variance model is appropriate. | N/A | Nonviable |
| Global Goodness of Fit | The mean model fits the data means sufficiently well (BMDS 2.7.0 Test 4 p value > N). | 0.1 | Nonviable |
| Degrees of Freedom | There is at least one degree of freedom (i.e., more dose-groups than model parameters). | N/A | Nonviable |
| BMD-to-BMDL Ratio | The ratio of BMD to BMDL is not large (BMD/BMDL <N). | 20 | Viable |
| High BMDL | The BMDL is <N times higher than the maximum dose. | 1 | Viable |
| High BMD | The BMD is <N times higher than the maximum dose. | 1 | Viable |
| Low BMD | The BMD is <N times lower than the minimum nonzero dose. | 3 | Nonreportable |
| Control Residual | The residual at control is small (residual < N). | 2 | Nonviable |
| Control Standard Deviation | The modeled standard deviation is similar to the actual (<N times different). | 1.5 | Nonviable |
| Residual of Interest | The residual at the dose group closest to the BMD (i.e., the residual of interest) is small (residual <N). | 2 | Nonviable |
| No Warnings Reported | No warnings in the BMD model system were reported. | N/A | Viable |
BMD = benchmark dose; N/A = not applicable; BMDL = benchmark dose lower confidence limit; AIC = Akaike information criterion; BMDS = Benchmark Dose Software.

Benchmark Dose Model Recommendation/Selection Methodology for Automated Benchmark Dose Execution of Apical Endpoints
Source: Figure adapted from Wignall et al.18
BMD = benchmark dose; BMDL = benchmark dose lower confidence limit; AIC = Akaike information criterion.
Benchmark Dose Model Recommendation/Selection Methodology for Benchmark Dose Execution of Gene Sets with Expression Changes Enacted by Chemical Exposure
Adapted from Thomas et al.28
RMA = Robust Multi-array Average; BMD = benchmark dose; BMDL = benchmark dose lower confidence limit; BMDU = benchmark dose upper confidence limit; AIC = Akaike information criterion; GGOF = global goodness of fit; GO = Gene Ontology.
Brain: As the principal organ responsible for cognition and control of organ systems and bodily functions, the brain is largely shielded from toxic insults sufficiently severe to affect its weight. Because of this resistance to change, brain weight is often used as a denominator in determinations of other organ weight ratio changes. Other than in cases of grossly observable effects in the brain at necropsy, significant differences in brain weight in subacute toxicity studies are unlikely an effect of chemical exposure. More likely, changes in brain weight are the result of randomization (i.e., sorting of animals into groups for which the mean and standard deviation are significantly different at the outset of study, making it appear that there is an exposure-related difference when it is rather a byproduct of natural variation and chance).
Liver: The liver carries out biotransformation and excretion of endogenous and xenobiotic substances, regulation of blood sugar, enzymatic transformation of essential nutrients, generation of blood proteins involved in fluid balance and clotting, and bile production for digestion and absorption of fats. Liver weight changes can be an indication of chemical-induced stress. Specifically, in subacute studies, increases in liver weight in response to low doses of toxicants typically stem from increases in xenobiotic metabolizing enzymes and associated hepatocyte hypertrophy or peroxisome proliferation. Increased liver weight, particularly when accompanied by evidence of leakage of liver-specific enzymes into blood, likely reflects hemodynamic changes related to severe hepatotoxicity. Higher liver weight relative to body weight may also occur at any dose level that causes a slowed rate of body growth and does not necessarily indicate liver toxicity. Decreased liver weight in subacute studies is typically of unknown toxicological significance but in rare cases may be related to glycogen depletion.
The following supplemental files are available at https://doi.org/10.22427/NIEHS-DATA-NIEHS-02.21
BMD Apical Endpoints Model Fits (MS Word, 1.3M)
BMD Model Recommendation Selection Rules (MS Word, 21K)
Read Me (MS Word, 21K)
Model Parameters (MS Excel, 241K)
BMDs Code Package (ZIP, 26M)
BMDExpress Project File (bm2 format) (BM2, 12M)
Gene Description (CSV, 24M)
Top 10 GO Biological Process Gene Sets (MS Word, 73K)
Top 10 Genes Ranked by Potency of Perturbation (MS Word, 75K)
BMDExpress Project File (JSON format) (JSON, 39M)
GO Biological Process Description (TSV, 9.6M)
BMDExpress Expression Data (Text, 4.7M)
BMDExpress GO Biological Process Deduplicated BMD Results (Text, 4.7M)
BMDExpress Individual Probe Set BMD Results (Text, 1.0M)
BMDExpress Individual Gene BMD Results (Text, 166K)
BMDExpress Prefilter Results (Text, 183K)
Animal and Microarray Metadata (ZIP, 115K)
Array Platform Gene and GO Term Annotation File (ZIP, 2.6M)
BMDExpress Software (ZIP, 63M)
Batch Correction Documentation (ZIP, 21M)
Individual Gene BMD Analysis Results File (ZIP, 260K)
Principal Components Analysis Files (ZIP, 2.1M)
Raw Data CEL Files (ZIP, 46M)
I04 – Mean Body Weight Summary (PDF, 51K)
I05 – Clinical Observations Summary (PDF, 32K)
PA06 – Organ Weights Summary (PDF, 44K)
PA41 – Clinical Chemistry Summary (PDF, 130K)
R07 – Hormone Summary (PDF, 35K)
Individual Animal Body Weight Data (MS Excel, 22K)
Individual Animal Clinical Chemistry Data (MS Excel, 40K)
Individual Animal Clinical Observations Data (MS Excel, 18K)
Individual Animal Hormone Data (MS Excel, 16K)
Individual Animal Organ Weight Data (MS Excel, 19K)
This is a work of the US government and distributed under the terms of the Public Domain
Your browsing activity is empty.
Activity recording is turned off.
See more...