NCBI Bookshelf. A service of the National Library of Medicine, National Institutes of Health.
Fink HA, Hemmy LS, Linskens EJ, et al. Diagnosis and Treatment of Clinical Alzheimer’s-Type Dementia: A Systematic Review [Internet]. Rockville (MD): Agency for Healthcare Research and Quality (US); 2020 Apr. (Comparative Effectiveness Review, No. 223.)

Diagnosis and Treatment of Clinical Alzheimer’s-Type Dementia: A Systematic Review [Internet].
Show detailsSelection Bias
Definition
Systematic differences between baseline characteristics of the groups that arise from self-selection of treatments, physician-directed selection of treatments, or association of treatment assignments with demographic, clinical, or social characteristics. Good randomization produces study groups that are likely comparable for known and unknown risk factors, removes investigator bias in allocation, and allow the most valid statistical inference in comparing outcomes between groups. In randomized studies, whether there is bias in allocation of study participants to treatment groups is a function both of whether the methods of randomization are good AND whether randomization successfully achieved a balance between treatment groups in risk factors or prognostic covariates.
Assessment Guidance
OPTION 1: The study reports that it was randomized.
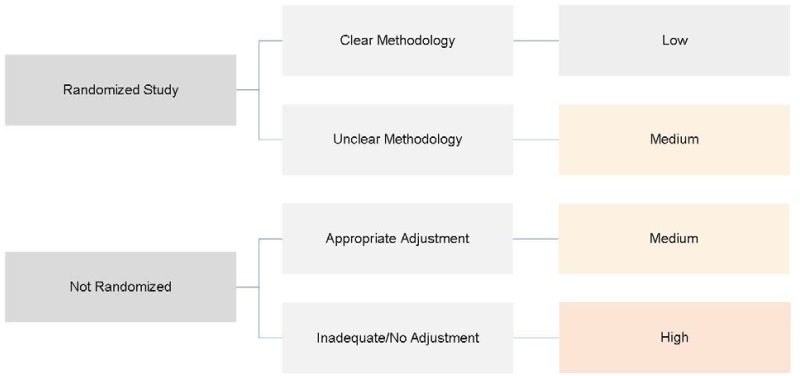
Clear Methodology: The study used a randomization method such as random numbers table, computer-generated random number producing algorithm, blocked randomization, stratified randomization, adaptive randomization (e.g., minimization).
Unclear Methodology: Study reports that allocation/assignment was randomized but gives no further detail.
OPTION 2: Study is not randomized (for treatment efficacy outcomes, CCTs are the only eligible nonrandomized study design).
Study uses systematic allocation of treatment by investigator: Systematic and predictable investigator allocation of treatment assignment (e.g., alternation, based on day of week, based on the month of birthday).
Study should use an appropriate statistical adjustment (propensity score, instrumental variable, multivariate).
Figure B.1 shows decision options for selection bias.
Attrition
Definition
Loss of participants from the study, potential systematic differences in that loss to follow-up, and how losses were accounted for in the results (e.g., incomplete follow-up, differential attrition). Those who drop out of the study or who are lost to follow-up may be systematically different from those who remain in the study. Attrition bias can potentially change the collective (group) characteristics of the relevant groups and their observed outcomes in ways that affect study results by confounding and spurious associations. Overall attrition refers to attrition in all groups combined for a given outcome comparison and timepoint. Differential attrition refers to the absolute difference between groups in attrition for a given outcome comparison and timepoint.
Assessment Guidance
*Studies that have long-term outcomes that are 5 years and longer should be assessed on a case-by-case basis.
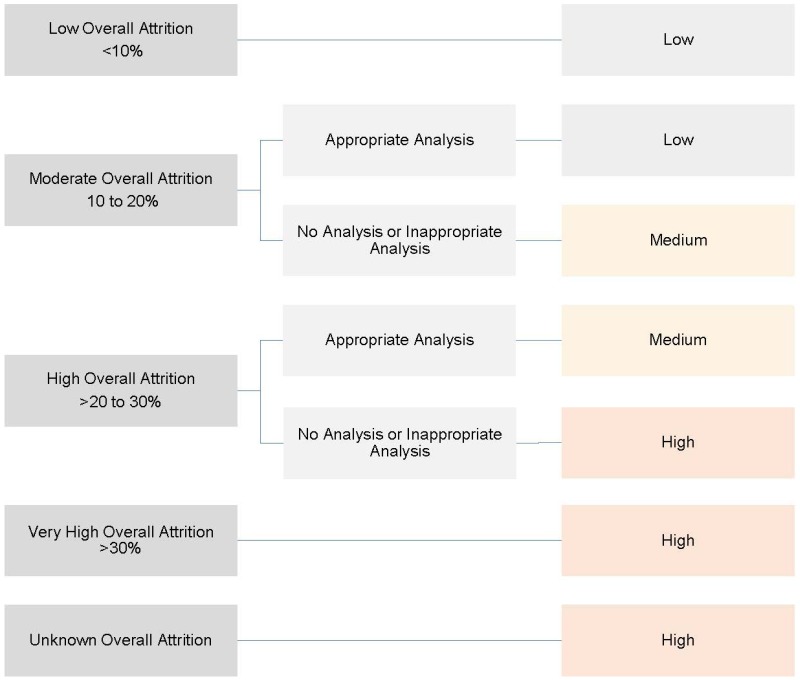
OPTION 1: Study has low overall attrition (<10%). Reasons for incomplete/missing data should be adequately explained.
OPTION 2: Study has moderate overall attrition (10 to 20%). Reasons for incomplete/missing data should be adequately explained and authors should attempt to address attrition in their analysis. Analysis should be done with appropriate method, noting that this may help explain the size and direction of the potential bias, but they don’t eliminate the bias. Last valued carried forward is not an appropriate adjustment. Some imputation methods might be appropriate (to be evaluated on a case-by-case basis).
OPTION 3: Study has high overall attrition (>20 to 30%) Reasons for incomplete/missing data should be adequately explained and authors should to address attrition in their analysis with an appropriate method. This reduces, but does not eliminate, the risk of attrition bias. Last valued carried forward is not an appropriate adjustment. Some imputation methods might be appropriate (to be evaluated on a case-by-case basis).
OPTION 4: Study has very high overall attrition (>30%) Authors may attempt to address attrition in their analysis, but the risk of attrition bias is high.
OPTION 5: Reporting of attrition by study arm is inadequate. It is unclear how many participants have been lost in each group. Risk of attrition bias is high.
Figure B.2 shows decision options for attrition bias.
Performance Bias
Definition
Systematic differences in the care provided to participants and protocol deviation. Examples include contamination of the control group with the exposure or intervention, unbalanced provision of additional interventions or co-interventions, difference in co-interventions, and inadequate blinding of providers and participants. Intention-to-Treat Principle (ITT) is when the study counts events in all randomized participants according to their treatment assignment, regardless of whether they received assigned treatment. It does not exclude participants from analysis for nonadherence, protocol deviations, withdrawal, or anything else that happens after randomization. To exclude such participants undercuts the benefit of randomization in minimizing selection bias. Modified ITT (mITT) is where analyses exclude randomized participants who did not receive any of their assigned treatment. This is not strictly ITT, but is accepted as such by the FDA in evaluating drug trials for approval.
Assessment Guidance
Guidelines for assessing performance bias are detailed in Appendix Tables B.1 and B.2.
Appendix Table B.1Assessment guidance for performance bias
| Domain | Assessment | Options |
|---|---|---|
| 1. ITT/Adjustment of Known Confounders | OPTION 1A: Study is an RCT. Check if study uses ITT or modified ITT. |
|
OPTION 1B: Study is a CCT. Check for adjustment of known confounders. Adequate adjustment includes adjustment for at least age, sex, and baseline cognition. Partially adequate adjustment adjusts for 1 or 2 of these potential confounder categories. Inadequate adjustment does not adjust for any of these potential confounder categories. |
| |
| 2. Participant Blinding | For all studies, check to see if participant blinding is described in text. | Yes |
| No | ||
| Unclear |
Appendix Table B.2Overall performance rating for performance bias assessment
| Overall Performance Rating | Low = ITT or adequate adjustment of confounders. Participants are blinded. | Medium = Unclear ITT or partially adequate adjustment of confounders. Participant blinding is unclear or not described. | High = No ITT or inadequate adjustment of known confounders. |
|---|
Detection Bias
Definition
Systematic differences in outcomes assessment among groups being compared, including systematic misclassification of the exposure or intervention, covariates, or outcomes because of variable definitions and timings, diagnostic thresholds, recall from memory, inadequate assessor blinding, and faulty measurement techniques. Erroneous statistical analysis might also affect the validity of effect estimates.
Assessment Guidance
Guidelines for assessing detection bias are detailed in Appendix Tables B.3 and B.4.
Appendix Table B.3Assessment guidance for detection bias
| Assessment | Options |
|---|---|
| 1. Check if outcome assessors were blinded to treatment assignment. |
|
| 2. Check if studies used validated, reliable, outcomes measure and that the groups assessed using comparable outcome measures. Please flag the test for the team if you are unsure if a test is validated or think that the measure is based on unconfirmed self-report. |
|
Appendix Table B.4Overall performance rating for detection bias assessment
| Overall Performance Rating | Low = 2 Yes OR 1 Yes, 1 Unclear | Medium = All unclear | High = At least 1 No |
|---|
Reporting Bias
Definition
Systematic differences between reported and unreported findings (e.g., differential reporting of outcomes or harms, incomplete reporting of study findings). Reporting bias includes selective analysis (e.g., study combines intervention groups or adjusts planned analysis without explanation).
Assessment Guidance
- Check if all outcomes reported in the methods section reported in the result section and vice versa (Appendix Table B.5).
- If study indicates that additional information is available in a separate protocol, protocol papers should be checked to ensure no relevant information is missed.
Appendix Table B.5Assessment guidance for reporting bias
| Assessment | Options | Rating |
|---|---|---|
| Check if all outcomes are reported without selective analysis? | Yes | Low |
| No | High | |
| Unclear | Medium |
Overall Risk of Bias Assessment
Assessment Guidance
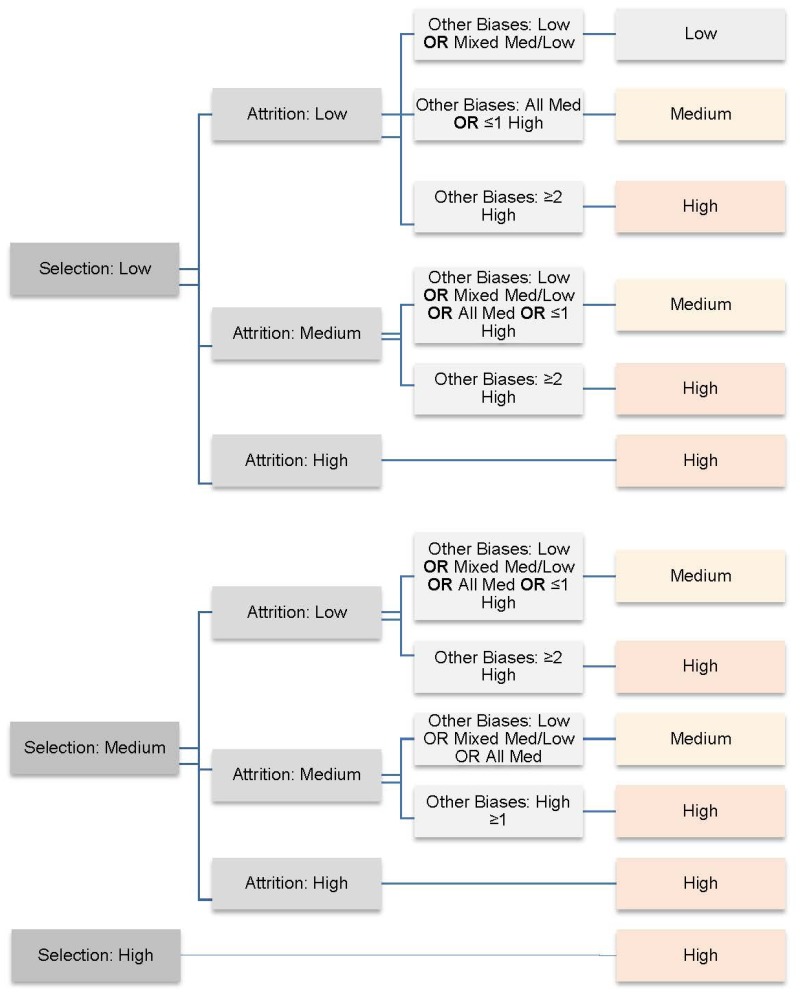
Overall risk of bias is determined by reviewer, or team, consensus. Figure B.3 provides a guide for how to rate overall risk of bias, based on the assessment of each individual domain. Reviewers should use this guide when making judgements about overall risk of bias. However, there may be cases where deviation from this guide is necessary and appropriate. For clarification and transparency, reviewers should provide a brief written justification for these deviations.
- Risk of Bias Assessment Decision Aid - Diagnosis and Treatment of Clinical Alzhe...Risk of Bias Assessment Decision Aid - Diagnosis and Treatment of Clinical Alzheimer’s-Type Dementia: A Systematic Review
Your browsing activity is empty.
Activity recording is turned off.
See more...


