Association Analysis
In this section, we describe the power profiles that result by applying the models described in to the data generated according to the four different experiments in . We focus on detecting the associations between the combined genotype-environmental factors on phenotype outcome (disease diagnosis). We assess the importance of model specification in predicting the presence of association with a phenotype of interest and to what degree the gene model and genotype environment interactions influence power. In the following section, Genotype Associations (p. 14), we assess the role of the genotype alone in predicting association while controlling for the environmental influence.
Note that in calculating all power results in this section we assumed that the Type I error rate was 10 −8 .
However, since all combined environmental exposure and genetic inheritance risk values are greater than 1.0 in all of our experiments, only Type II errors were possible.
shows the data generated using the protocol for Experiment 1. Note that for this and all subsequent tables in this section, the highest power value for each risk profile within the three MOI categories is bolded to highlight the optimal model. For each genetic inheritance (GI) risk level (Φ) there is an environmental exposure (EE)risk level (Π) equal to 1.0, indicating no EE risk.
Power values, by statistical model, Φ, and Π: Experiment 1—all gene models.
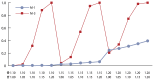
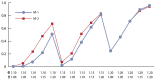
shows the data generated using the protocol for Experiment 1 for the additive gene model. includes the optimal model (Model M-3, identified by the bolded cells in ) and the model that does not include an EE variable in its specification (Model M-1). The results presented in and indicate that there is little difference in performance between models when the risk of EE is not present.
Power curves, by statistical model, Φ, and Π: Experiment 1—additive gene model. Φ = genetic inheritance (GI) risk level; Π = environmental exposure (EE) risk level. Note: The statistical models (M-1 and M-3) are (more...)
The results shown in and indicate the following:
The power profile of model M-1 is substantially below that of models M-2 and M-3. M-1 represents a typical single locus method used in a GWAS that ignores environmental influences. We conclude that not including an EE reduces the likelihood of the locus being associated with the phenotype.
Model M-3 is the most powerful of the three models. This is expected since the Experiment 1 protocol should generate data consistent with the M-3 model formulation.
The difference between the profiles of models M-2 and M-3 is a result of the manner used to characterize the EE functional form. Because the data was generated in a manner compatible with the e1 variable used in model M-3, it generated more accurate power predictions.
Note that in the full M-3 model, the overall intercept is the log of the intercept for the line that relates EE to the log-odds risk among those subjects with the non-disease genotype AA. The coefficient associated with the g1 main effect is testing for the difference between intercepts for the subjects with genotype aA and those with genotype AA. Similarly, the g2 main effect coefficient is testing for the difference between the intercepts for subjects with the aa genotype and those with the AA genotype.
The EE main effect coefficient is the height of the step in the step function relating EE to log-odds-risk for subjects with the AA genotype and, it therefore, tests for a common EE step height across all three genotypes. The g1*E interaction coefficient is the difference between the step heights for the aA subjects and the AA subjects. Similarly, the g2*E coefficient is the difference between the step heights for the aa subjects and the AA subjects. Since the AA, aA, and aa step heights/slopes associated with the EE environmental effect are all equal in Experiments 1 and 3, only the common main effect (ME) associated with EE contributes to association prediction in those data sets, and the interaction terms are superfluous.
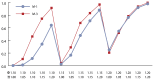
and show the results of applying the three models described in to the data generated according to the Experiment 2 protocol (see ). Experiment 2’s results indicate that
Even though model M-1 does not adjust for EE, the observed (relatively) high power profiles for high EE risk levels suggest that the GI-EE interaction effect is embedded in the M-1 power values, and the high power profiles are credited as a genotype main effect.
As in Experiment 1, model M-3 outperforms all other models because the variable e1 properly characterizes EE behavior. This clearly demonstrates the value of preprocessing (i.e., mining) the data before committing to a specific association model.
Power values, by statistical model, Φ, and Π: Experiment 2—all gene models.
Power curves, by statistical model, Φ, and Π: Experiment 2—additive gene model. Φ = genetic inheritance (GI) risk level; Π = environmental exposure (EE) risk level. Note: The statistical models (M-1 and M-3) are (more...)
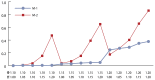
and show the results of applying the three statistical models described in to the data generated according to the Experiment 3 protocol (see ).
Power values, by statistical model, Φ, and Π: Experiment 3—all gene models.
Power curves, by statistical model, Φ, and Π: Experiment 3—additive gene model. Φ = genetic inheritance (GI) risk level; Π = environmental exposure (EE) risk level. Note: The statistical models (M-1 and M-2) are (more...)
For Experiment 3, the results shown in and indicate that
Model M-1 consistently performs below M-2 and M-3, indicating that not including an EE term limits the association assessment.
In general, model M-2 produces better power profiles than M-3. This is expected given that the EE incremental risk is linearly related to the log of EE. Thus, model M-2 is more consistent with the protocol used to generate the data in Experiment 3.
The results for Experiment 4 are shown in and . They indicate the results of applying the three models described in to the data generated according to the Experiment 4 protocol (see ).
Power values, by statistical model, Φ, and Π: Experiment 4—all gene models.
Power curves, by statistical model, Φ, and Π: Experiment 4—additive gene model. Φ = genetic inheritance (GI) risk level; Π = environmental exposure (EE) risk level. Note: The statistical models (M-1 and M-2) are (more...)
The results shown in and indicate that
Consistent with Experiment 2’s results, model M-1 does not adjust for EE, but because of the influence of GI-EE interaction effects, M-1 displays higher power profiles for large EE risk levels.
As in Experiment 3, model M-2 outperforms M-3 because it better characterizes the EE by using the variable E (age) and further demonstrates the value of preprocessing (i.e., mining) the data before committing to a specific association model.
In the presence of GI-EE interaction effects, the genetic-only model (M-1) performs better than anticipated.
Genotype Associations
The analysis in the previous section focused exclusively on composite associations, that is, whether a specific gene plus an environmental factor associates with a phenotype. As we noted earlier, our main interest was separating main genetic effects from environmental effects and their interactions. To accomplish this, we defined a total effect test (TOT) that adjusts for EE where:
is the test we applied to the data generated by Experiments 1 and 2 protocols and
is the test that we applied to the data generated by Experiments 3 and 4 protocols.
TOT is the association test that measures genetic effects (main and interactive) and is adjusted for the environmental effect.30 TOT simultaneously measures whether the aA and aa intercepts are different from the AA intercept and whether the aA and aa slopes are non-zero, given that the AA slope on EE is zero. This test was used to test for association from all causes.
We also define two additional tests for genotype-environment interactions, INT, as follows:
and
The INT test subtracts the main effects for g1, g2, and EE from the TOT and tests whether the EE steps (or slopes) for the aA and aa genotypes are different from the corresponding EE step (slope) for genotype AA.
The final test measures the influence of the genetic main effects (ME).
is the test applied to the data generated by Experiments 1 and 2 protocols and
is the corresponding test for data from Experiments 3 and 4 protocols.
The ME tests check whether the estimated aA and aa intercepts differ from the AA intercept, conditioned on the EE step sizes (e1 in experiments 1 and 2) or the EE slopes (E in experiments 3 and 4) being equal for all three genotypes.
Note that for Experiments 2 and 4, both the AA step (coefficient of e1) and slope (coefficient of E) on EE are zero, and therefore the coefficient for the EE main effect (assuming that the M-3 is operating) is estimating zero; the two interaction columns are estimating the aA step/slope minus zero and the aa step/slope minus zero, respectively.
Typically, these three tests would be applied sequentially: TOT followed by INT, then ME. Assessing whether an interactive or non-interactive genetic association is obtained would depend on the result of the preceding test.
For example, if TOT is non-significant, the process stops and we conclude that there is no connection between the genetic locus and the phenotype. Otherwise, we would apply the INT test. If INT was significant, we could conclude that the locus and the phenotype are significantly related, with the caveat that the strength of the genotype effect varies by the EE risk level. The ME test would only be applied if the TOT is significant and INT test is not significant. In this case, the ME test would be applied to affirm that the genetic and environmental effects are operating independently of each other and to assert that a common genotype main effect exists that applies to all EE levels. The results of running the three tests (TOT, INT, and ME) are shown in through .
Total effects test (TOT) power values, by risk profile, Φ, and Π—all experiments and gene models,N= 200,000.
Genotype-environment interactions (INT) power values, by risk profile (Φ and Π)—all experiments and gene models,N= 10,000.
Main effects (ME) power values, by risk profile (Φ and Π)—all gene models,N = 10,000.
Genotype-environment interactions (INT) power values, by risk profile (Φ and Π)—all gene models,N= 200,000.
Main effects (ME) power values, by risk profile (Φ and Π)—all gene models,N = 200,0000.
Consider that every replicate in every cell produced by the simulation experiments is designed to generate a genotype-phenotype association (albeit at low risk). Some of these replicates influenced by an EE also contribute toward association. However, in a perfect statistical world, all are generated to predict an association with the phenotype. The fact that they do not is an indication of the limitations of the GWAS process.
In addition, suggests that
Association detection involving recessive genes is difficult to identify (and accordingly requires a larger sample size than we used in our experiments.
Scenarios involving gene-environment interactions (Experiments 2 and 4) greatly influence whether genetic influences can be detected by a gene-only model.
The type of EE process influences the ability to detect an association, whether the effect is due to a chemical-type exposure (Experiments 1 and 2) or is due to aging (Experiments 3 and 4).
presents the results of applying the INT test to all experiments and all gene models. Not shown are the results for Experiments 1 and 3, which generated data without interaction effects. They estimate no interaction between GI and EE (as they should), so those results are not shown. Note that the Type 1 α thresholds in for generating power estimates for all cells are ≤10 −2.
reaffirms the results of , namely, that
Power values for recessive genes are very low and accordingly were more difficult to identify than other gene models.
Gene-environment interactions influence association outcomes. This is evidenced by all cells of the no-interaction experiments (1 and 3) having power values <.004.
The type of EE process influences the detection of an association, whether the effect is due to an exposure (Experiments 1 and 2) or is due to an aging mechanism (Experiments 3 and 4).
Interaction effects achieve significant levels in Experiment 2 for risk values of EE ≥ 1.2 only.
presents the results of the ME test for Experiments 1 and 3. ME results for Experiments 2 and 4 are not shown because they were generated by a protocol that produced EE and GI interactions, and if the INT test demonstrated significance (as it should have), the ME tests would have been unnecessary. In all cases the alpha threshold was set to 10−2.
reaffirms the results of and : namely, that
Associations involving recessive genes are more difficult to identify,
Gene-environment interactions influence association outcomes,
The type of process influences the detection of an association, as shown by differences between power values for exposure mechanisms such as those resembling chemical spills (Experiments 1 and 2) and those recognizing aging mechanisms (Experiments 3 and 4), and
Main effects are only ascribed significant for larger risk values of genetic inheritance, those with a risk of 1.2 or above.
Note that the power threshold values are set to low (α ≤ 10−2) for the interaction and main effects tables. To investigate the effect of a very large N, we repeated the simulation process with N = 200,000 and reduced the threshold to (α ≤ 10−8 ). The results are shown in and .
The results shown in suggest that the GI-EE interactions are very sensitive to low EE levels (Π < 1.10). They also accurately estimate an interaction power value of zero when Π = 1.00, that is, no EE risk.
These results suggest that for very large studies it is possible to predict positive associations between recessive genes linked to phenotypes with low to moderate risk.