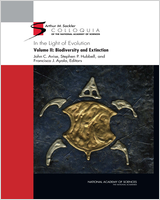
![FIGURE 4.2 Relative abundance of different taxa, and the proportion of parasitic species in those taxa [data from Rohde (1982)]. Taxa are numbered along the x axis as follows: 1, Mastigophora; 2, Opalinata; 3, Sarcodina; 4, Apicomplexa/Microspora; 5, Ciliophora; 6, Mesozoa; 7, Porifera; 8, Cnidaria; 9, Ctenophora; 10, Platyhelminthes; 11, Priapulida; 12, Entoprocta; 13, Nemertina; 14, Nemathelminthes; 15, Annelida; 16, Pentastomida; 17, Arthropoda; 18, Tentaculata; 19, Mollusca; 20, Echiurida; 21, Sipunculida; 22, Hemichordata; 23, Echinodermata; 24, Pogonophora; 25, Chaetognatha; 26, Chordata. The area of a circle corresponds to the natural log of the total number of species in a taxon, and the center of the circle corresponds to the proportion of parasitic species in that taxon.](/books/NBK214895/bin/p200168f1g66001.jpg)
From: 4, Homage to Linnaeus: How Many Parasites? How Many Hosts?
In the Light of Evolution: Volume II: Biodiversity and Extinction.
National Research Council (US); Avise JC, Hubbell SP, Ayala FJ, editors.
Washington (DC): National Academies Press (US); 2008.
Copyright 2008 by the National Academy of Sciences. All rights reserved.
NCBI Bookshelf. A service of the National Library of Medicine, National Institutes of Health.