

NCBI Bookshelf. A service of the National Library of Medicine, National Institutes of Health.
Feingold KR, Anawalt B, Blackman MR, et al., editors. Endotext [Internet]. South Dartmouth (MA): MDText.com, Inc.; 2000-.

ABSTRACT
Insulin is an anabolic peptide hormone secreted by the b cells of the pancreas acting through a receptor located in the membrane of target cells - major ones being liver (where it promotes glucose storage into glycogen and decreases glucose output), as well as skeletal muscle and fat (where it stimulates glucose transport through translocation of GLUT4), but also b cells, brain cells and in fact most cells, where it has pleiotropic effects.
The receptor belongs to the receptor tyrosine kinase superfamily and has orthologues in all metazoans. The structure of the unbound extracellular domain ("apo-receptor") has been solved. Insulin binds to two distinct sites on each a subunit of the receptor, crosslinking the two receptor halves to create high affinity. The structure of the site 1 interface has also been solved, as well as the structure of the inactive and activated tyrosine kinase, revealing the activation by phosphorylation of an autoinhibitory loop.
The receptor activates a complex intracellular signaling network through IRS proteins and the canonical PI3K and ERK cascades. Overall and tissue-specific targeted gene disruption in mice has explored the role of many of the signaling proteins in creating the type 2 diabetes phenotype, with some surprising results. Insulin signaling in the liver and b cell is emerging as the major determinant in preventing type 2 diabetes, through the integrative role of molecules like IRS2 and FOXO, preventing b cell dedifferentiation. The emerging new biology of diabetes opens novel therapeutic opportunities for the 442 million type 2 diabetics worldwide. For complete coverage of this and all related areas of Endocrinology, please visit our FREE on-line web-textbook, www.endotext.org.
INTRODUCTION
Insulin is an anabolic peptide hormone secreted by the b-cells of the pancreas that plays a critical role in the regulation of human metabolism (Fig. 1) (1). Its biosynthesis, secretion, structure and structure-activity relationships are thoroughly reviewed by Michel Weiss and colleagues in Endotext (2).
Although insulin is widely viewed as a glucose homeostasis regulating hormone, it is now known to have a much broader pleiotropic role. An insulin-like signaling system exists in all metazoans (1), and regulates evolutionarily conserved processes including reproduction and lifespan (3-7).

Figure 1
Pleiotropic actions of insulin through the insulin receptor. Insulin through its receptor affects multiple physiological processes in the organism (left) by increasing (green arrows) or decreasing (red arrows) various intracellular metabolic pathways (right). Inspired by figure 2-1 of reference 1.
The concept that insulin acts by promoting glucose transport across the membrane of target cells (rather than acting directly on enzymes of intermediary metabolism of glucose) was established in 1949 by the iconic experiment of Rachmiel Levine and colleagues (8), who showed that insulin markedly increased the volume of distribution of non-metabolisable galactose in eviscerated nephrectomized dogs from 45-47% of body weight to 75%, a figure close to that of total body water. From this finding they proposed the following working hypothesis: "Insulin acts upon the cell membrane of certain tissues (skeletal muscle, etc.) in such a manner that the transfer of hexoses (and perhaps other substances) from the extracellular fluid into the cell is facilitated. The intracellular fate of the hexoses depends upon the availability of metabolic systems for their transformation. In the case of glucose, dissimilation, glycogen storage, and transformation to fat are secondarily stimulated by the rapidity of its entry into the cell".
This major conceptual advance paved the way to the notion that insulin acts on a specific cell membrane receptor. The receptor was first characterized by radioligand binding studies in the early 70's (9-12), and by detailed biochemical studies in the early 80's that established the glycoprotein nature and subunit structure of the receptor. I have reviewed the early steps in insulin receptor research elsewhere (13). Following the demonstration in 1982 by Ora Rosen's group that a tyrosine kinase was closely associated with the insulin receptor (14), several groups showed that the insulin receptor itself is a tyrosine kinase, an enzyme that catalyses the transfer of the g phosphate of ATP to tyrosine residues on protein substrates, the first being the receptor itself. The cloning of the insulin receptor cDNA in 1985 by the groups of Axel Ullrich and Bill Rutter (15, 16) established that the insulin receptor indeed belongs to the superfamily of receptor tyrosine kinases (RTKs).
THE RECEPTOR TYROSINE KINASE SUPERFAMILY
The RTKs regulate a diverse array of cellular functions in multicellular organisms, including cell proliferation, survival, differentiation, migration and metabolism. The human genome encodes 55 RTKs that fall into 19 subfamilies (Fig. 2) based on which polypeptide ligands they bind, their sequence homology and the modular structure of their extracellular domains. For recent reviews of the structural biology of this superfamily see references 17-22. A detailed analysis of the properties of each subfamily is compiled in reference 18.
The RTKs are in general single transmembrane polypeptide chains that cross the cell membrane once. The intracellular part of the receptor contains a tyrosine kinase domain, inactive in the absence of ligand. In the presence of ligand bound to the extracellular domain, the RTK becomes an activated dimer, in essence an allosteric dimeric enzyme (23). There is debate as to whether the activation is due to ligand-induced dimerization or to ligand stabilization of a pre-existing monomer-dimer equilibrium (21, 23, 24). The insulin receptor subfamily (number 2 in Fig. 2), which comprizes the insulin receptor, the type 1 IGF receptor (also called IGF-I receptor) which binds insulin-like growth factors I and II, and the orphan insulin receptor-related receptor (IRRR), is an exception in the RTK superfamily in that it exists as a covalent disulfide-linked dimer (with a low basal activity kinase) in the absence of ligand. This suggests that the activation of a pre-formed dimer is a more plausible model for the superfamily. Upon ligand activation of the dimerized RTK, the kinase domains come in contact and are activated by transphosphorylation, resulting in phosphorylation of specific Tyr residues in the intracellular part of the receptor outside the kinase domain. These phosphorylated residues become binding sites for signaling partner proteins that contain SH2 (Src homology 2) domains that also become phosphorylated by the kinase or are activated by conformational changes, and start the intracellular signal transduction cascade.

Figure 2
The human receptor tyrosine kinase superfamily. This shows the modular structure of the various subfamilies of RTKs encoded in the human genome. Note that the AATYK family of three kinases is now considered a serine/threonine kinase (17), which leaves 55 RTKs grouped into 19 families. The various modules that constitute the architecture of the extracellular and intracellular domains are shown below. A detailed description of the structure of these modules can be found in reference 22. From reference 22, used with permission.
MODULAR STRUCTURE OF THE INSULIN RECEPTOR
The insulin receptor has a modular structure (for review see ref. 25) encoded by a gene (located on chromosome 19) with 22 exons and 21 introns (26, Fig. 3). The short exon 11 that encodes a 12-amino acid sequence is alternatively spliced, resulting in two receptor isoforms (A and B) that differ slightly in affinity for insulin (27-29). The B isoform binds the IGFs with at least 100 times lower affinity than insulin, while the A isoform has significantly higher affinity than the B isoform for IGF-I and especially IGF-II (30) and may play a role in tumorigenesis. The IGF-I receptor binds IGF-II with a lower affinity than IGF-I and insulin with a 500-fold lower affinity. The receptors are synthesized as single chain preproreceptors that are processed by a furin-like proteolytic enzyme, glycosylated, folded and dimerized to yield the mature a2b2 receptor. In cells expressing both insulin and IGF-I receptors, hybrid receptors are formed consisting of one half of each (31). Their physiological role is unknown. Comparative sequence analysis of the insulin/IGF-I receptors and the related EGF receptor (32) had led Bajaj et al. to suggest (Fig. 3) that the N-terminal half consists of two large homologous globular domains, L1 and L2, separated by a cysteine-rich region later predicted to consist of a series of disulfide-linked modules similar to those found in the tumor-necrosis factor (TNF) receptor and laminin. The C-terminal half of the receptors was predicted to consist of three fibronectin type III (FnIII) domains. The second FnIII domain contains a large insert domain (120 residues) of unknown structure containing the site of cleavage between a- and b-subunits. The disulfide bond between each a- and b- subunit involves the cysteins C647 and C860. In addition there are a-a disulfide bonds at C524 in the FnIII-1 domains and between the triplet C682-C683 and C685 in the insert domain (Fig. 3). The intracellular portion of the a-subunit contains the kinase domain flanked by two regulatory regions, a juxtamembrane region involved in docking insulin receptor substrates (IRS) 1-4 and Shc as well as in receptor internalization, and a C-terminal tail. The IGF-I receptor has a similar modular organization (33). The recent progress in the X-ray crystallographic structures of whole ectodomains or fragments of the insulin and IGF-I receptors (see below) has largely validated the structural predictions shown in Fig. 3.

Figure 3
Modular structure of the insulin receptor. Cartoon of the α2β2 structure of the insulin receptor, drawn to scale. On the left half of the receptor, spans of the 22 exon-encoded sequences. On the right half, spans of predicted protein modules. Module boundaries mostly correspond to exon boundaries. L1 and L2: Large domains 1 and 2 (leucine-rich repeats); CR: Cys-rich domain. FnIII-1, FnIII-2, FnIII-3: Fibronectin III domains. ID: insert in FnIII-2. TM: transmembrane domain. JM: juxtamembrane domain. TK: tyrosine kinase domain. C: C-terminal tail. Black rectangle near FnIII-1: major immunogenic region. Orange dots: N-glycosylation sites. Black dots: ligand binding ”hotspots” identified by single amino acids site-directed mutagenesis. The two α-subunits are linked by a disulfide bond between the two Cys 524 in the first FnIII domain. One to three of the triplet Cys at 682, 683 and 685 in the insert within the second FnIII domain are also involved in α-α disulfide bridges. There is a single disulfide bridge between α and β subunits between Cys 647 in the insert domain and Cys 872 (nomenclature of the B isoform) . Exon 11 is highlighted. Adapted from reference 25.
STRUCTURE OF THE UNBOUND INSULIN RECEPTOR ECTODOMAIN (apo-RECEPTOR)
The stepwise progress over the past 10 years in solving the structure of the human insulin receptor ectodomain (34-38) has been recently reviewed (39, 40) and I will focus here on the most salient features, based on the most recent higher-resolution (3.3 Å) structure of the ectodomain bound to four monoclonal antibodies (41) Fab fragments (not shown here), aided by a novel interactive molecular dynamics strategy (38, Fig. 4). The ectodomain homodimer has a two-fold symmetric inverted "V" conformation, with the FnIII-1,-2,-3 modules sticking like a linear stem from the cell membrane and the L1-CR-L2 module folding over downwards. The L1 and L2 domains are leucine-rich repeat domains. The L1-CR-L2 module of one receptor monomer packs against the FnIII-1,-2,-3 modules of the alternate receptor monomer. Of utmost importance for insulin binding, the aCT 16--amino acid C-terminal helical segment of the insert domain of one monomer packs against the central b-sheet of the L1 domain of the alternate receptor monomer. This tandem L1/ aCT element (36) forms the major insulin binding site (site 1, see below). This structure does not contain bound insulin.

Figure 4
Architectural assembly of the unbound insulin receptor ectodomain. This figure is based on the latest higher resolution structure of the apo-receptor at 3.3 Å resolution (38). A. The α subunit. Domains are labeled as in Figure 3. FnIII-2α is the α subunit component of the FnIII-2 domain. B. The β subunit. Domains are labeled as in Figure 3. FnIII-2β is the β subunit component of the FnIII-2 domain. C. The αβ monomer. The monomer shows an inverted V-shaped structure. The arrow denotes the site of proteolytic cleavage of the proreceptor. This structure is the A-isoform of the insulin receptor. Twelve amino acids at the end of the insert domain of the β subunit are missing from the structure. The B-isoform would have 12 more amino acids encoded by exon 11 at the end of the αCT domain of the α subunit..D. The α2β2 dimer. The arrow indicates the location of the triplet of disulfide bonds between Cys 682, 683 and 685 of the two α subunits. E. The tandem insulin binding site 1 made of the αCT helical segment of one α subunit binding in trans to the beta sheet surface of the L1 domain of the second α subunit. The rest of the α subunit insert (ID), which is not part of the binding site, is also shown for orientation. F. Idem, rotated 90 degrees. Drawn using DSViewerPro from PDB file Model-S1 2, kindly provided by Mike Lawrence, based on PDB file 4ZXB complemented using IMDFF (38).
DEFINITION OF THE RECEPTOR BINDING SURFACES ON THE INSULIN AND RECEPTOR MOLECULES
The mechanism and kinetics of insulin binding to its receptor have been extensively studied for over 40 years using radioligands (13). Insulin binding is complex and shows negative cooperativity, as shown by curvilinear Scatchard plots and acceleration of the dissociation of a pre-bound insulin tracer in an "infinite" dilution in the presence of cold insulin (42). Only one insulin molecule binds to the receptor dimer with high affinity; additional insulin binding is of lower affinity, presumably due to ligand-induced asymmetry. IGF-I binding to the IGF-I receptor shows similar properties.
It was proposed 20 years ago that high-affinity insulin receptor binding results from insulin having two binding sites 1 and 2 that crosslink two binding sites (1 and 2') located on the two separate receptor a subunits (43, 44). In order to explain the negative cooperativity, I postulated that the two a subunits of the receptor should have an antiparallel symmetry in order for sites 1 and 2' and 1' and 2 to be approximated (44), so that alternative crosslinking at each subsite pair may occur upon ligand binding, with ligand-induced asymmetry.
Attempts to map the receptor-binding residues on the insulin molecule date back more than four decades (45-47). Blundell and colleagues hypothesized that a largely invariant region on the surface of the insulin monomer was a good candidate for the receptor-binding region (now referred to as the "classical binding surface" or site 1), including both A-chain residues A1 Gly, A5 Gln, A19 Tyr, A21 Asn as well as B-chain residues B24 Phe, B25 Phe, B26 Tyr, B12 Val and B16 Tyr, many of which are also involved in insulin dimerization. Alanine scanning mutagenesis of the insulin molecule has largely confirmed the role of the previously postulated site 1 residues in binding affinity but also identified new residues mapping to the hexamerization surface of insulin (site 2): Ser A12, Leu A13, Glu A17, His B10, Glu B13 and Glu B17 (13,48,49). Ile A10, which had not been included in the alanine scan, was also identified as important for binding affinity by substitution with the homologous IGF residue Ser (50). The central helix of insulin's B chain appears to be a major binding motif and a "hinge" between sites 1 and 2 (51, 52). An updated mapping of insulin's binding sites 1 and 2 is shown in Fig. 5 Two binding sites equivalent to insulin's sites 1 and 2 have also been identified on IGF-I and II by site-directed mutagenesis (25,, 53), with site 1 extending into the C-domain.

Figure 5
Receptor binding sites 1 and 2 on the insulin molecule. The residues in site 1 are mapped in yellow, site 2 in red, backbone in blue. Spheres and tube shown at 0.7 Van der Waals radius. Site 1: Gly A1, Ile A2, Val A3, Glu A4, Tyr A19, Asn 21, Gly B8, Ser B9, Leu B11, Val B12, Tyr B16, Phe B24, Phe B25, Tyr B26. Site 2: Thr A8, Ile A10, Ser A12, Leu A13, Glu A17, His B10, Glu B13, Leu B17. PDB file 9INS. Modelled using DSViewerPro from Accelrys.
Putative identification of sites 1 and 2 on the insulin receptor a-subunits has been achieved by a variety of biochemical approaches including chimeric receptors, site-directed mutagenesis and photoaffinity crosslinking (for review see refs. 25 and 13). Residues involved in site 1 binding affinity were mapped by alanine scanning to the L1 domain and to the distant aCT domain at the C-terminus of the insert in the a subunit. These locations were supported by photoaffinity crosslinking experiments (for review see refs. 25 and 13). The most remarkable result of such expriments was the finding that contiguous residues Phe B24 and Phe B25 of insulin crosslinked to very distant epitopes of the receptor a subunit, B24 to the N-terminal L1 and B25 to the C-terminal aCT, suggesting that these two domains somehow came close together in the folded receptor structure (54,55). Complementation experiments showed that this interaction between L1 and aCT happens in trans between the two a subunits rather than in cis within the same subunit (56), constituting a tandem binding element that was resolved by X-ray crystallography (36). Finally, the critical insulin A3 residue was shown also to crosslink to aCT (57).
Receptor site 2 was mapped by alanine scanning mutagenesis to the loop regions near the junction of the FnIII1-FnIII2 regions of the a subunit (58)..
STRUCTURE OF THE SITE 1 INSULIN-RECEPTOR COMPLEX
Four crystal structures of insulin bound to truncated insulin receptor constructs at 3.9-4.4 Å resolution, in the presence of exogenous aCT peptide and monoclonal antibodies Fab fragments were solved in 2013 (59). The major surprise of the four new structures was that, contrary to predictions, insulin is barely bound to L1. Most of the residues from the L1 b sheet surface that had been mapped by alanine scanning are in fact bound to aCT, not insulin (Fig.5). Most of the site 1 residues of insulin are in intimate contact with aCT, except Val B12 and Tyr B16; these latter contacts are, however, essential for high affinity. See Table 1 of ref. 40 for a detailed description of insulin residues contacts with the receptor residues, as well as the impact of alanine scanning of those residues on binding affinity. Overwhelming evidence supported a critical role of some of the C-terminal residues (B24-B26) of insulin's B chain in binding affinity, as well as the occurrence of negative cooperativity; the second surprise was that the B22 to B30 segment was invisible in the structures. It is clear, however, that if it kept the same conformation as in native insulin, there would be a steric clash with aCT, which supports the earlier concept that the B-chain C-terminal must "detach" to uncover A2 and A3 (60, 61).
Another important conclusion of this study was that when the L1 domain from the apo receptor is superimposed on the L1 domain from the insulin-bound structure, it is clear that the other receptor half must undergo a conformational change in order for the insulin molecule to fit between site 1 and the site 2 in the FnIII1-2 region and to avoid a major steric clash (39, 59). The precise nature of this conformational change and its relevance to tyrosine kinase activation is still unresolved.
The last missing piece of the site 1 complex puzzle fell into place in a recent publication (62, reviewed in 40), reporting a refinement in one of the 2013 structures that now reveals the position of insulin B-chain's C-terminal B20-B27 (the residues B28-B30 are unimportant for binding). As expected, residues B24-B26 had to rotate away by 50 degrees from the core of the molecule in order to make room for the aCT segment and to insert itself between the first strand of the L1-b2 sheet and aCT residues 715-718, supporting the partial detachment model. Opening of this "hinge" enables conserved nonpolar side chains (Ile A2, Val A3, Val B12, Phe B24 and Phe B25) to engage the receptor. Phe B24 and Tyr B26 are primarily directed toward L1, while Phe B25 and Thr B27 are oriented toward aCT. Contacts with Phe B25 stabilize residues 716-719.
The current structure (Fig. 6) generally supports previous mappings of site 1 and 2 on the insulin molecule (Fig. 5).
The crystal structure of IGF-I bound to a hybrid microreceptor site 1 complex (insulin receptor L1-CR fragment with the IGF-I receptor aCT peptide) was also recently solved (63), proving congruent to the insulin bound site 1 complex shown in Fig. 5; interestingly the IGF-I aCT peptide is threading through the polypeptide loop formed by the C domain of IGF-I.

Figure 6
Structure of the site 1 insulin-receptor complex. Detailed view of insulin's site 1 and site 2 residues in the ternary complex between insulin, L1 and αCT that includes insulin's B-chain C-terminus. The figure shows the structural relationship of insulin's site 1 (in magenta) and site 2 (in red) residues with the receptor's αCT and L1 surfaces. See table 1 of reference 40 for more detailed description of the contacts. Drawn by Marek Brzozowski using the CCP4MG programme. PDB file: 4OGA. From reference 40, used with permission.
QUANTITATIVE ANALYSIS OF THE INSULIN-RECEPTOR BINDING PARAMETERS: THE HARMONIC OSCILLATOR MODEL
The complexity of the ligand binding kinetics to the insulin and IGF-I receptors (negative cooperativity and ligand concentration dependence of the dissociation rate), in the absence of a precise understanding of the molecular mechanisms involved, had precluded for many years the development of a reliable mathematical model, although computer programs were available to approximate "high and low" affinity constants. The alternative crosslinking model proposed by De Meyts in 1994 (44), together with progress in the structural analysis of the receptors, resulted in a physically plausible, structure-based model, proposed by Vladislav Kiselyov et al. in 2009 (64), based on the concept of a harmonic oscillator. This model postulates that the tetrade of sites 1 and 2 on each a-subunit, disposed as proposed (44) in an antiparallel fashion, spontaneusly oscillate between the open and closed conformations. This allows the ligand, bound either to site 1 or site 2, to crosslink the oscillator, creating high affinity and slowing down the dissociation rate. Alternative crosslinking to the second set of sites will result in acceleration of ligand dissociation from the first crosslinked pair. This allows for a simplification of the number of intermediary states involved (Fig. 7). The system can be described with only 5 parameters: a1 and a2, the association rate constants to receptor sites 1 and 2, d1 and d2, the respective dissociation rates, and kcr, a crosslinking constant that is the reciprocal of the time it takes the oscillator to close. The overall reaction scheme can be described by 33 differential equations (plus two to account for the small degree of endocytosis and exocytosis in the cells), which can be easily fitted by computer software like Mathematica. A detailed description of the method is beyond the scope of this chapter, but suffices to say that it allows a robust estimation of the equilibrium and kinetic parameters for both insulin and IGF-I receptors (Table 1), that we have applied to evaluate the binding properties of a variety of insulin analogues, as well as to the kinetic parameters of the two insulin receptor isoforms (65). The take home message here is that the insulin receptor binding mechanism creates a high affinity site with a Kd of about 0.2 nM by crosslinking two partial binding sites with Kds of 6.0 and 400 nM (with similar values for the IGF-I receptor).

Figure 7
Simplified scheme of the intermediary binding reactions in the harmonic oscillator model. The circles marked S1 and S2 symbolize the two insulin receptor binding sites, in a symmetrical antiparallel disposition. The insulin molecule is symbolized by a black dot. a1 and a2: association rate constants for sites 1 and 2 respectively. d1 and d2: dissociation rate constants for sites 1 and 2 respectively. kcr: crosslinking constant. see text for explanations. From reference 64, used with permission.

From reference 64, used with permission.
STRUCTURE OF THE INSULIN RECEPTOR TYROSINE KINASE
The crystal structure of the insulin receptor tyrosine kinase domain was solved by Stevan Hubbard and colleagues, both in the inactive state (66) and in the activated state (in the presence of a peptide substrate, a stable ATP analogue and Mg2+ (67) (Fig. 8). The corresponding structures for the IGF-I receptor kinase were subsequently solved (68, 69).
Like in all kinases, the architecture features two structurally distinct lobes, the N-terminal lobe and the C-terminal lobe (Fig. 8), which form the catalytic site of the kinase where ATP, bivalent cations and the substrate tyrosine residue get together. The two lobes are linked by a linker region that forms a hinge which enables the relative motion of the two lobes. The structures revealed a novel autoinhibition mechanism (described in Fig. 8) whereby an "activation loop" behaves as a pseudosubstrate that blocks the active site in the basal state (closed configuration) and is stabilised in the open position after transphosphorylation of three tyrosines. More recent data (70) have shown that the activated insulin and IGF-I receptor kinases are functional dimers, and that, in addition to the activation loop phosphorylation, an allosteric stabilization takes place involving an exchange of the juxtamembrane regions proximal to the kinase domain. For review of the structural aspects of the insulin receptor and other kinases, see references 19 and 71, 72.
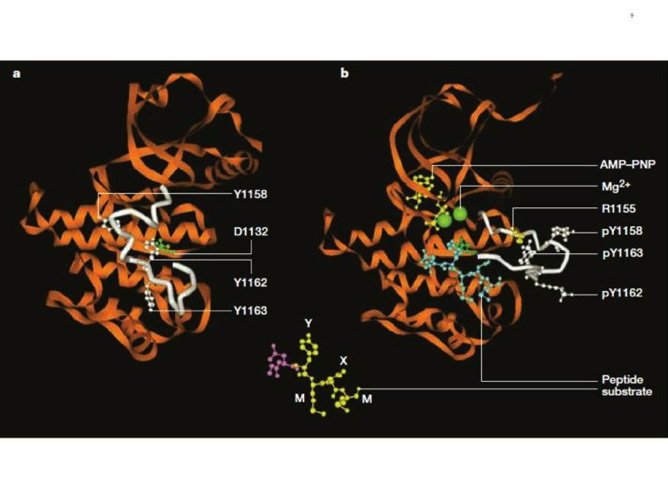
Figure 8
Structure of the inactive and activated insulin receptor tyrosine kinase (with bound ATP analogue AMP-PNP, peptide substrate and Mg2+). This figure illustrates the autoinhibition mechanism whereby Tyr 1162, one of the three tyrosines that are autophosphorylated in the activation loop (shown in white) in response to insulin (1158, 1162, 1163) is bound in the active site, hydrogen bonded to a conserved Asp 1132 in the catalytic loop (left). Tyr 1162 in effect competes with protein substrates before autophosphorylation. In the activated state (right), the activation loop is tris-phosphorylated and moves out of the active site. Tyr 1163 becomes hydrogen-bonded to a conserved Arg 1155 in the beginning of the activation loop, which stabilizes the repositioned loop. Also shown is the peptide substrate with the WMXM motif. From reference 25.
MECHANISM OF INSULIN RECEPTOR ACTIVATION BY LIGAND BINDING
Despite the considerable recent progress in the structures of the extracellular and kinase domains of the insulin (and to a lesser extent IGF-I) receptors, no structure of the complete unliganded and liganded receptors is available, and therefore we lack the details of the precise mechanism whereby extracellular ligand binding results in approximation and activation of the kinase domains.
The distance between the membrane insertions of the stems of the extracellular domain of the insulin apo receptor is ~120 Å. This is too far away for the kinase domains to be approximated if they are held close to the stems and the distance is maintained in the activated receptor. Ward et al. have speculated (32) that a ligand-induced conformational change causes the descent of the kinase domains (like a yo yo) from a constrained position where they are partially wrapped up by the juxtamembrane region and lie near the membrane. This release allows the kinases to approximate and transphosphorylate (Fig. 9A). This model is partially supported by the 3D structure of a juxtamembrane inhibited kinase domain (73).
In contrast with this model, Lee et al. (74) suggested that insulin binding prises apart the transmembrane domains in a receptor where they are held close together in the inactive receptor (Fig. 9B). This is based on the finding that a 24-residue peptide having the IR transmembrane domain sequence (but not the IGF-IR sequence) activated the IR tyrosine kinase. There were no structural studies to back up this claim.
A mechanism quite different from the above that is backed up by convincing structural and biochemical data, was proposed by Kavran et al (75). They concluded that the molecular mechanism for IR/IGF1R activation involves separation of the transmembrane domains enforced by the unliganded extracellular domains, which maintains the receptors in an inhibited state (i.e. the opposite of the mechanism proposed by Lee et al .(74)). Ligand binding relieves the inhibition by disrupting the L1-FnIII2'-3' interaction that stabilizes the transmembrane domain separation, freeing the transmembrane domains to associate, and allowing autophosphorylation of the kinase domains [Fig. 9C). In their view, ligand binding does not stimulate the kinase activity of the phosphorylated receptor. In other words, the role of the IR/IGF1R extracellular domain is to inhibit activity in the absence of ligand rather than promote activity in the presence of ligand.
Finally, Maruyama (24) has recently proposed a common mechanism for all dimeric transmembrane receptors whereby ligand binding to the extracellular domain of receptor dimers induces a rotation of transmembrane domains, followed by rearrangement and/or activation of intracellular domains (the "rotation model", Fig. 9D)

Figure 9
Models of the mechanism of ligand activation of the insulin receptor tyrosine kinase. A: The "yo-yo" model. From ref. 14. B: The TM domain ligand-induced separation model. From ref. 74. C: The TM domain ligand-induced approximation model. From ref. 75. D. The "rotation model". From reference 24, used with permission. Figure adapted from reference 40, used with permission.
See text for explanation.
THE INTRACELLULAR INSULIN RECEPTOR SIGNAL TRANSDUCTION NETWORK
Following the activation of the insulin receptor tyrosine kinase by triphosphorylation of its activation loop, the kinase phosphorylates tyrosine residues outside the kinase domain of the receptor which creates binding sites for signaling protein partners containing SH2 (src-homology 2) domains (76) or PTB (phosphotyrosine- binding) domains. Unlike other RTKs, the insulin (and IGF-I) receptors do not bind signaling proteins directly, but instead bind to the phosphorylated juxtamembrane domain residue Tyr 960 (IR--A numbering) a family of large docking proteins called IRS (Insulin receptor substrate)1-6, the first of which was cloned in 1991 (77, 78), as well as the adapter Shc (Src homology 2 domain containing) (79). These form the nucleus for the assembly of a signal transduction particle that is the starting hub of the various intracellular signaling cascades. A detailed inventory of all the signaling proteins involved in insulin signal transduction pathways (Fig. 10) is beyond the scope of this review. For more detailed reviews see refs. 1, 80-84.

Figure 10
The canonical insulin receptor signal transduction network. The two major canonical insulin receptor signaling cascades (PI3K and ERK) are shown. The critical nodes (IR/IRS, PI3K, AKT) are boxed. Crosstalk from IGF-I receptor, cytokine receptors and TNFα is indicated. Negative regulation by PTP1B and PTEN is shown. See text and reference 83 for detailed explanation. From reference 82, used with permission.
In order to apprehend the organisation of the complex insulin signaling network, a useful concept is that of "critical nodes" (82). The three best studied nodes are the insulin receptor/IRS complex, PI3 kinase (PI3K) and AKT/PKB.
Most insulin effects appear to be mediated through the interaction of IRS-1 and -2, and Shc, with the insulin receptor (81, 82, 85). Other docking proteins like CBL, APS, SH2B, GAB1 and-2 and DOCK1 and-2 have been less extensively studied (81). IRS proteins contain an N-terminal pleckstrin homology (PH) domain (which attaches to the plasma membrane phospholipids) adjacent to a PTB domain that binds to a phosphorylated NPXY (Y 960) motif in the receptor's juxtamembrane domain. The central and C-terminal parts of the IRS proteins contain up to 20 potential phosphorylation sites that when phosphorylated by the insulin receptor bind to signaling proteins that contain SH2 domains.
The two main pathways of insulin signaling emanating from the insulin receptor-IRS node are the phosphatidylinositol 3-kinase (PI3K, a lipid kinase)/AKT (also known as PKB or protein kinase B) pathway (86,87) and the Raf/Ras/MEK/ MAPK (mitogen activated protein kinase, also known as ERK or extracellular signal regulated kinase) pathway (88). The PI3K pathway is responsible for most metabolic effects of insulin, and is connected exclusively through IRS, while the MAPK pathway emanates from both IRS and Shc and is involved in the regulation of gene expression and, in cooperation with the PI3K pathway, in the control of cell growth ("mitogenesis") and differentiation (82).
The PI3K Signaling Pathway
Activation of the PI3K pathway is triggered by the binding of the p85 or p55 regulatory subunit of PI3K (an adapter which has 8 isoforms) to IRS1 and-2, resulting in activation of the p110 catalytic subunit (which has three isoforms) and generation of phosphatidylinositol-3,4,5-triphosphate (PIP3), which leads to activation of the three isoforms of AKT/PKB by PDK (phosphoinositide-dependent protein kinase) 1 and -2 (Fig. 10). PDKs bind to PIP3 in the cell membrane and become thereby activated (82, 86, 87).
Four of the critical downstream substrates of AKT/PKB are mTOR, mammalian target of rapamycin, involved in the regulation of protein synthesis (89); GSK3 (glycogen synthase kinase 3), involved in the regulation of glycogen synthesis (90); FoxO (forkhead box-containing protein, O subfamily) transcription factors, especially FoxO1, involved in the regulation of gluconeogenic and adipogenic genes (91) and AS160 (AKT substrate of 160kDa), involved in glucose transport (92) (Figs.10 and 11). mTOR is a serine/threonine kinase that acts as a nutrient sensor; it is the catalytic subunit of two structurally distinct complexes,mTORC1 and mTORC2. It stimulates protein synthesis by phosphorylating eukaryotic translation initiation factor 4E-binding protein 1 (4EBP1) and p70 ribosomal protein S6 kinase (p70S6K).
GSK3 is a serine/ threonine protein kinase that inhibits glycogen synthase (but is also involved in other cellular processes); it is inhibited when phosphorylated by AKT/PKB.
FoxO1 is a transcription factor that translocates to the nucleus in the absence of insulin signal, and stimulates the expression of genes such as PEPCK (phosphoenolpyruvate carboxykinase), the key enzyme in gluconeogenesis (82), as well as cyclin G2, an atypical cyclin that blocks the cell cycle and is inhibited by insulin (93), and appears to play a key role in insulin (and IGF-I)-induced mitogenesis. FoxO1 is sequestered in the cytoplasm when phosphorylated by AKT. FoxO1 is highly conserved in evolution and, under the name daf16, plays a major role in metabolism and longevity in C. elegans (91).
AS 160 is a 160-kD AKT substrate that plays a key role in insulin-stimulated glucose transport (1, 92). This is discussed in some detail in the next section.
The MAPK-ERK Signaling Pathway
Grb2 is an adapter protein that binds to IRS and Shc, and exists in a complex with SOS (son of sevenless), a guanyl nucleotide exchange factor that promotes GDP/GTP exchange on the small G protein p21 ras (94). This in turn activates the cascade of serine/threonine kinases Raf/MEK/ ERK1-2. Phosphorylated ERK 1-2 translocate to the nucleus if the signal is of sufficient duration and phosphorylates there an array of transcription factors and mitogen- and stress- activated protein kinases (1, 88).
INSULIN REGULATION OF GLUT4 TRANSLOCATION
The prototypical metabolic effect of insulin is the stimulation of glucose transport in adipose tissue and skeletal and cardiac muscle (1, 8, 83). Glucose disposal into muscle is the major component of insulin action that prevents postprandial hyperglycemia. This is accomplished through the translocation by exocytosis of the insulin-sensitive glucose transporter GLUT4 from intracellular vesicles to the plasma membrane, by a mechanism that is still far from completely understood (for review see 95, 96).
GLUT4 is one of 13 human glucose transporter isoforms (GLUTs) with 12 membrane-spanning domains, and is highly expressed in adipose tissue and skeletal muscle. GLUTs catalyze hexose transport across cell membranes through an ATP-independent, facilitative diffusion mechanism. GLUT4 has the unique characteristic of a mostly intracellular disposition in the unstimulated state, in storage vesicles called GSVs that are acutely redistributed in the plasma membrane in response to insulin and other stimuli like exercise (96).
The major insulin signaling pathway involved in GSVs translocation is the PI3K/PDK1/AKT2 pathway, through phosphorylation of the AS160 substrate (Fig. 11). AS160 is a GTPase-activating protein that when phosphorylated activates small G proteins called RAB that are involved in membrane traficking, by blocking the exchange of GTP for GDP. Atypical Protein kinases C (PKCs) isoforms appear to be also involved downstream of PDK1 but not through AKT.
A parallel signaling pathway (95) in 3T3L1 adipocytes, emanating from caveolae and lipid rafts has been proposed, that involves the phosphorylation of the adaptor protein Cbl by the insulin receptor, and results in the activation of a small G protein, TC10, a member of the Rho family which modulates actin structure. This has not been supported by siRNA-mediated gene silencing experiments (96).
Besides insulin, exercise also stimulates glucose transport and GLUT4 translocation through an insulin-independent, AMK -dependent mechanism (83, 96).
A much more detailed description of the mechanism of GLUT4 translocation can be found in ref. 83.

Figure 11
Mechanism of insulin-stimulated glucose transport and GLUT4 translocation. This cartoon illustrates the stimulation of GLUT4 translocation from intracellular storage vesicles (GSVs) to the plasma membrane by the IRS/PDK1/AKT2/ signaling cascade, acting on the GTPase-activating protein AS160 which activates the small G protein RAB. Atypical PKCs are also involved. From reference 1, used with permission.
NEGATIVE REGULATION OF INSULIN RECEPTOR SIGNALING, SIGNAL TERMINATION
A multitude of mechanisms are in place to attenuate or terminate the signal induced by insulin, both at the receptor and post-receptor level (82). The insulin receptor and IRS proteins are negatively regulated by ligand-induced downregulation, by tyrosine protein phosphatases and by serine phosphorylation. Subsequent steps in the protein kinase cascades are also modulated by phosphatases. Negative feedback loops are important in the fine tuning of the network.
Insulin Receptor and IRS Proteins Downregulation
The inverse dependence between insulin receptor concentration at the cell membrane and ambient insulin concentration after long-term exposure was first demonstrated in vitro in human cultured cells by Gavin et al. in 1974 (97). This was shown to be due to clathrin-dependent endocytosis, a mechanism that involves a dileucine motif in the receptor juxtamembrane domain (98). Receptors are then sorted in endosomes for recycling or degradation in the lysosomes (for a more detailed review of the mechanisms involved, see ref. 99). This regulatory mechanism has subsequently been extended to the whole class of RTKs (100). In a systems perspective, receptor endocytosis is seen as a major negative feedback circuit acting on the input signaling layer (101).
Insulin internalization is however not just a mechanism of signal termination since it has been shown that signal transduction continues from the internalized receptor until stopped by phosphatases (99), and it may be essential for Shc activation of the Ras-ERK cascade (102, see reference 104 for review).
Hyperinsulinemia also decreases the expression of IRS1 and IRS2 in both cultured cells and in the tissues of mice, which has been linked to insulin resistance in animal models (82). This is due both to increased degradation (by ubiquitination) and decreased synthesis (82).
Serine phosphorylation of IRS Proteins
IRS1 has over 70 potential serine phosphorylation sites, the phosphorylation of which in general seems to negatively regulate IRS signaling (82, 104). Many of the IRS kinases such as ERK, S6 kinase and c-Jun-N-terminal kinase (JNK) are activated by insulin, suggesting that IRS serine phosphorylation is a negative feedback mechanism in the insulin signaling network (82). The TNFa receptor, involved primarily in apoptosis and inflammation, induces the serine phosphorylation of IRS1 through JNK (82, Fig. 10) and induces insulin resistance in humans, animals and in vitro (105).
Dephosphorylation of Insulin Signaling Proteins by Protein Phosphatases and Phospholipid Phosphatases
Constitutively active phosphatases induce a major attenuation of signals within the processing core of RTK signaling networks (101).
Vanadate and related compounds inhibit protein tyrosine phosphatases and increase the tyrosyl phosphorylation of the insulin receptor and intracellular substrates, and act as insulin mimetics (106).
The major and most studied protein tyrosine phosphatase acting on the insulin receptor is PTP1B. It resides in the endoplasmic reticulum and dephosphorylates the insulin receptor during internalization and recycling to the plasma membrane (107, 108). Mice lacking PTP1B show increased insulin sensitivity and improved glucose tolerance (109, 110).
The dephosphorylation of downstream substrates is done by serine/threonine phosphatases (111) and in the case of ERK/MAPK by dual specificity phosphatases (112).
The activity of the PI3K pathway is also negatively regulated at the level of PIP3 by phospholipid phosphatases such as the phosphatase and tensin homologue (PTEN, a tumour suppressor) and SH2-containing inositol 5'-phosphatase-2 (SHIP2), which dephosphorylate and inactivate PIP3. PTEN dephosphorylates phosphoinositides on the 3'-position whereas SHIP2 does it on the 5'-position (82, 113).
Other attenuators of insulin receptor signaling: suppressor of cytokine signaling (SOCS) proteins, growth-factor-receptor-bound protein 10/14 (Grb10/14) and plasma-cell membrane glycoprotein-1 (PC-1)
Insulin receptor signaling is also attenuated by suppressor of cytokine signaling (SOCS) proteins, which are mediators of cytokine receptor signaling (like leptin and IL-6 receptors) through Janus kinases (JAK) and signal transduction and activation of transcription (STAT) proteins (114, 115, Fig 10). SOCS 1, -3, -6 and -7 disrupt insulin signaling through binding to the insulin receptor and/or by targeting IRS-1 and IRS-2 for proteasomal degradation (115).
The adaptors Grb10/Grb14, which bind to the insulin (and IGF-I) receptor kinase activation loop, also attenuate receptor signaling (116). Interestingly the related adaptors SH2B1/B2 have the opposite effect (116).
Finally, insulin receptor signaling is inhibited by PC-1, also known as the enzyme ectonucleotide pyrophosphatase/phosphodiesterase (ENPP1), and this was shown to be dependent on its enzymatic activity (117).
Negative Regulation of PI3K and Insulin Action by the PI3K Regulatory Subunit
In addition to its role as a positive regulator of PI3K function, the regulatory subunit paradoxically also has a role as a negative regulator since knockouts of this subunit can improve insulin sensitivity. The putative mechanisms are discussed in ref.83.
CLINICAL IMPLICATIONS OF THE INSULIN RECEPTOR AND SIGNAL TRANSDUCTION NETWORK
Type 2 diabetes has in recent years reached epidemic proportions, with a total number recently revised upwards by WHO to 422 million type 2 diabetic adults worldwide, driven by the obesity epidemics, surpassing the most pessimistic earlier predictions.
Type 2 diabetes is a complex and heterogeneous syndrome, with combinatorial effects of various genetic determinants ("diabetogenes") and lifestyle and environmental factors (118, 119). It combines alterations in overall insulin sensitivity (the so-called insulin resistance) and alterations in beta cell production and secretion of insulin in response to elevated glucose. There is no consensus as to the relative impact of both defects in "causing" type 2 diabetes, nor in the precise succession of molecular events at the tissue and cellular level leading to the development of full-blown diabetes.
With the considerable progress in unravelling the insulin receptor signaling network in recent years, numerous studies have addressed the possible dysregulation of this network in causing insulin resistance both in vivo and in vitro, in cell lines, animal models as well as in humans. In particular, gene invalidation and transgenic approaches in mice have been used extensively to explore the role of individual players in the signaling network, alone or in combination, in the maintenance of normal insulin sensitivity, as well as, for some, in normal beta cell function. It is fair to say that although through these studies we have learned a lot about the role of individual signaling pathways and molecules in cell function and overall metabolic regulation in rodents, a clear picture has not emerged as to what molecular defect(s) precisely causes insulin resistance in human obese and type 2 diabetic patients, nor as to what is the relative impact of insulin resistance versus beta cell dysfunction in humans. I will therefore not attempt here to provide an encyclopedic description of the extensive gene knockout and transgenic studies, but only stress a few salient and intriguing features; see ref. 120 for a more detailed review of early studies and the excellent and detailed up-to-date chapter by Morris White (83).
The importance of the insulin receptor in metabolic homeostasis was clearly demonstrated by the finding of various compound heterozygous insulin receptor mutations (about 60 so far) in human syndromes associated with extreme insulin resistance: type A insulin resistance with acanthosis nigricans, leprechaunism, Rabson Mendenhall syndrome (121) and in two siblings with congenital fiber-type dysproportion myopathy (122). Depending on the location of the mutation in the receptor structure, the functional consequences have been ranked in 5 categories (121): 1) impaired synthesis, 2) impaired transport to the plasma membrane, 3) impaired insulin binding, 4) impaired transmembrane signaling and 5) impaired endocytosis, recycling and degradation.
The complete knockout of the two alleles of the insulin receptor in mice led to major metabolic alterations soon after suckling. They were born with moderate growth impairment (-5%). They developed a marked postnatal growth retardation and skeletal muscle hypotrophy and died within a week after birth of acute diabetic ketoacidosis (120, 123, 124).
Reported cases of human patients with homozygous insulin receptor deletion are exceptional, likely due to embryonic lethality. Interestingly though, the four cases reported over 20 years ago (125-128) showed a milder phenotype (leprechaunism) than the mice double knockouts and lived several months to a year after birth like most leprechauns, showing that in humans life is compatible with lack of insulin receptors. This points to the fact that one has to be careful in extrapolating findings with rodent genetic manipulations to conclusions regarding pathophysiology in humans.
Following the demonstration in cell culture of insulin receptor downregulation in the presence of increased insulin concentrations in the culture medium in vitro in 1974 (97), studies showed that the insulin receptor was also downregulated in vivo in hyperinsulinemic resistant states in animal models (ob/hob mice, db/db mice, mice treated with gold thioglucose, or the Koletsky rat) (129 - 131) as well as in circulating monocytes (132) or adipocytes (133) of obese humans, although some human studies dissented (134, 135). This led to the notion that receptor downregulation in vivo was a major determinant of insulin resistance. However, it was later shown that heterozygous null mutants (IR +/-) for the insulin receptor that had only half the normal complement of receptors did not present with any major metabolic abnormalities and had normal glucose tolerance following an intraperitoneal glucose tolerance test, and had normal insulin levels (123), strongly suggesting that downregulation of the insulin receptor alone is not sufficient to cause insulin resistance, and that postreceptor defects may be required, as had been previously suggested (136).
Obvious candidates for a postreceptor defect in insulin resistance are the IRS proteins, considering the critical role of this node in both insulin and IGF-I signal transduction (82). Defects in muscle IRS1 expression and function have been reported in insulin-resistant states such as obesity and type 2 diabetes (reviewed in 137). Surprisingly, the homozygous deletion of IRS1 in mice by two different groups (138, 139) induced a rather moderate metabolic phenotype with no type 2 diabetes, normal fasting glycemia, and normal glucose tolerance in one case (138) but significant hyperglycemia after intraperitoneal glucose load in the other (139). A mild degree of insulin (and IGF-I) resistance was found in both studies. Both showed marked intra-uterine and postnatal growth retardation.
In contrast, mice with homologous deletion of IRS2 (140) were 10% smaller and mildly insulin resistant at birth, but developed a marked glucose intolerance and had full-blown diabetes at 10 weeks with both marked insulin resistance and beta cell deficiency.(more than two-fold decrease in beta cell mass as early as 4 weeks) with decreased insulin secretion in response to glucose. These and further data demonstrated that IRS2 plays a critical integrative role in pancreatic beta cell plasticity and function (for review see references 1, 83), and support the concept that the beta cell is not only the source of insulin, but an important target of its actions (141). Tissue-specific knockout of the insulin receptor gene in the b cell caused a defect in their early secretory response similar to that in type 2 diabetes (142).
Among the numerous total or tissue-specific knockouts of insulin pathway components, I will just stress a few of the unexpected results that challenged our current wisdom regarding diabetes pathophysiology:
As already mentioned, the targeted disruption of the p85 regulatory subunit of PI3K paradoxically caused hypoglycemia due to increased sensitivity and increased basal and insulin-stimulated glucose disposal in peripheral tissues with a preferential localization of GLUT4 in the plasma membrane (143, 144, see reference 82 for review).
Surprisingly, homozygous deletion of GLUT4 did not produce a diabetic phenotype (145), Females had normal glucose levels in fasted and fed state while males had a 34% lower fasting glucose and 20% increase in fed glycemia. Both sexes were insulin resistant and hyperinsulinemic, showed growth retardation and had disturbed lipid metabolism. They had a shorter life span linked to significant cardiac hypertrophy.
70% of insulin-induced glucose disposal goes to skeletal muscle. Tissue-specific knockout of the insulin receptor in skeletal muscle (MIRKO, 146) resulted as expected in a marked reduction of insulin-stimulated glucose transport in skeletal muscle. Surprisingly, the animals showed no hyperglycemia, hyperinsulinemia or evidence for any impairment of glucose homeostasis. They had disturbed lipid metabolism.
Also somewhat counter-intuitively, mice with tissue-specific insulin receptor knockout in adipose tissue (FIRKO, 147) showed a markedly reduced fat mass and whole-body triglyceride stores and were protected from gold thioglucose-induced and age related obesity as well as from the obesity associated glucose intolerance.
Finally, the third major target tissue for insulin, the liver, was also targeted by tissue-specific knockout of the insulin receptor (148). The liver accounts for 30% of the disposal of an oral glucose load through glucose uptake (insulin independent) and storage into glycogen, and accounts for the major part of insulin clearance through receptor-mediated endocytosis. The knockout mice showed severe primary insulin resistance and a defect in insulin clearance. Thus isolated liver insulin resistance is sufficient to cause severe defects in glucose homeostasis. The mice also developed alterations in liver function and cellular morphology.
I will not review here the extensive work done in knocking out the insulin receptor in non-classical target tissues (the beta cell has been discussed above), except to mention the critical finding based on neuron-specific knockout mice that the insulin receptor in the brain (the presence of which was reported years earlier (149.150)) plays an important role in the control of body weight and reproduction (151).
Thus from all these studies, the hepatocyte and the b cell have emerged as the major insulin-responsive cells where loss of insulin signaling induces the major phenotypic alterations in glucose homeostasis found in type 2 diabetes.
Major efforts have been devoted in recent years by large consortia to pick potential human diabetogenes in human type 2 diabetes by genome-wide association scans (GWAS). So far at least 70 established susceptibility loci have been defined that account for at most 10% of the familial aggregation, most of which pointing to b cell dysfunction rather than insulin resistance (for review see reference 152). No smoking gun has been detected in insulin signalling with the recent exception of Grb14 discussed above as a negative regulator of insulin signaling (153).
CONCLUSIONS AND PERSPECTIVES
Much progress has occurred in the past decade in solving the structure of the insulin receptor extracellular domain, and, a decade earlier, the structure of the tyrosine kinase domain. The structure of the major binding interface between insulin and the receptor (site 1) has also been resolved. We are still lacking critical structural information regarding the architecture of site 2, as well as to the mechanistic aspects of the allosteric change that links ligand binding to tyrosine kinase activation.
Also, since the cloning of IRS1 25 years ago, a detailed picture of the intracellular signal transduction network has emerged and some of the critical nodes defined. A major conundrum remains, the molecular basis of signaling specificity when different ligands, like insulin, insulin mimetic peptides, IGF-I and IGF-II, utilise pretty much the same signaling pathways through their respective receptors to induce different biological effects, and even sometimes while binding to the same receptor (103, 154). Progress in the systems biology of signal transduction is needed to fully understand the combinatorial nature of signaling specificity.
Another conundrum resides in the still unresolved classical dichotomy between insulin resistance and b cell dysregulation as the major cause of the metabolic alterations of type 2 diabetes. As mentioned above, both massive insulin resistance and glucose intolerance are associated with loss of insulin signaling in the liver and an insulin secretion defect results from loss of insulin signaling in the b cell. New concepts are emerging that both may result from common mechanisms, the loss of powerful signal integrators that are IRS2 (1) and FOXO1 in both the beta cell and the liver (155). In his aptly called "new biology of diabetes", Mimmo Accili has recently proposed a plausible liver- and b cell-centric hypothesis of diabetes pathophysiology linked to progressive loss of FOXO function. FOXO integrates a surprisingly diverse array of biological functions in both the liver and the b cell. In the liver, FOXO prevents excessive glucose production and increased lipid synthesis and secretion. In the b cell, FOXO is required to maintain b cell differentiation. Diabetes progression involves a gradual loss of FOXO function that results in b cell dedifferentiation (156, 157), which is proposed to be the principal cause of b cell failure and conversion to non b endocrine cells. This unifying hypothesis will be exciting to follow-up on since it has major implications for the design of new therapies for the 442 million people who suffer from type 2 diabetes.
ACKNOWLEDGEMENTS
I am grateful to Mike Lawrence for providing the PDB file Model-S1 2, and to him and Colin Ward for many enlightening discussions; to Marek Brzozowski for drawing Figure 6 and for fruitful collaboration; to Mike Weiss for many productive interactions and for suggesting me as writer of this chapter; to many of the authors and collaborators cited in the reference list for networking and friendships over 43 years of work on the insulin receptor; and to Jesse Roth for starting it all and for his unwavering support.
REFERENCES
- White MF. Mechanisms of insulin action. In J.S. Skyler (ed.). Atlas of Diabetes: Fourth Edition. DOI 10.1007/978-1-4614-1028-7_2@Springer Science+Business Media. LLC 2012
- Weiss MA, Steiner DF and Philipson LH. Insulin biosynthesis, secretion, structure, and structure-activity relationships. In: De Groot LJ, Beck-Peccoz P, Chrousos G, Dungan K, Grossman A, Hershman JM, Koch C, McLachlan R, New M, Rebar R, Singer F, Vinik A, Weickert MO, editors. Endotext [Internet]. South Dartmouth (MA): MDText.com, Inc.; 2000-2014 Feb 1.
- Kimura KD, Tissenbaum HA, Liu Y and Ruvkun G. daf-2, an insulin receptor-like gene that regulates longevity and diapause in Caenorhabditis elegans. Science. 277:942-6, 1977
- Tatar M, Bartke A and Antebi A. The endocrine regulation of aging by insulin-like ligands. Science 299:1346-51, 2003
- Kenyon C. The plasticity of aging. insights from long-lived mutants. Cell 120:499-460, 2005
- Taguchi A and White MF. Insulin-like signaling, nutrient homeostasis, and life span. Annu Rev Physiol 70:191-212, 2008
- White MF. Longevity. Mapping the path to a longer life. Nature 524:170-171, 2015
- Levine R, Goldstein M, Klein S and Huddelston B. The action of insulin on the distribution of galactose in eviscerated and nephrectomized dogs. J Biol Chem 179:985-986, 1949
- House PD and Weidemann MJ. Characterization of a [125-I]-insulin binding plasma membrane fraction from rat liver. Biochem Biophys Res Comm 41:541-548, 1970
- Freychet P, Roth J and Neville DM Jr. Insulin receptors in the liver: speciific binding of [125-I]-insulin to the plasma membrane and its relation to insulin bioactivity. Proc Natl Acad Sci USA 68:1833-1837, 1971
- Cuatrecasas P, Desbuquois B and Krug F. Insulin receptor interactions in liver cell membranes. Biochem Biophys Res Comm 44:333-339, 1971
- Gammeltoft S and Gliemann J. Binding and degradation of 125I-labelled insulin by isolated rat fat cells. Biochem Biophys Acta 320:16-32, 1973
- De Meyts P. Insulin and its receptor: structure, function and evolution. BioEssays 26:1351-1362, 2004
- Petruzzelli LM, Ganguly S, Smith CJ, Cobb MH, Rubin CS and Rosen OM: Insulin activates a tyrosine-specific protein kinase in extracts of 3T3-L1 adipocytes and human placenta. Proc Natl Acad Sci USA 79:6792-6796, 1982
- Ullrich A, Bell JR, Chen EY, Herrera R, Petruzelli LM, Dull TJ, Gray A, Coussens L, Liao YC, Tsubokawa M, Mason A, Seeburg PH, Grunfeld C, Rosen M and Ramachandran J. Human insulin receptor and its relationship to the tyrosine kinase family of oncogenes. Nature 313:765-761, 1985
- Ebina Y, Ellis L, Jamagin K, Edery M, Graf L, Clauser E, Ou J-H, Masiarz F, Kan YW, Goldfine ID, Roth RA and Rutter WJ. The human insulin receptor cDNA: the structural basis for hormone-activated transmembrane signalling. Cell 40:747-758, 1985
- Wheeler DL and Yarden Y, editors. Receptor tyrosine kinases: structure, functions and role in human disease. Humana Press, Springer New York Heidelberg Dordrecht London, 440 pp, 2015
- Wheeler DL and Yarden Y, ediitors. Receptor tyrosine kinases: family and subfamilies.. Humana Press, Springer New York Heidelberg Dordrecht London, 878 pp, 2015
- Hubbard SR and Miller WT. Receptor tyrosine kinases: mechanisms of activation and signalling. Curr Opin Cell Biol 19:117-123, 2007
- Lemmon MA and Schlessinger J. Cell signalling by receptor tyrosine kinases. Cell 141: 1117-1134, 2010
- De Meyts P. Receptor tyrosine kinase signal transduction and the molecular basis of signalling specificity. In Wheeler DL and Yarden Y, ediitors. Receptor tyrosine kinases: structure, functions and role in human disease. Humana Press, Springer New York Heidelberg Dordrecht London, pp 51-76, 2015
- Lawrence MC and Ward CW. Structural features of the receptor tyrosine kinase ectodomains. Wheeler DL and Yarden Y, ediitors. Receptor tyrosine kinases: structure, functions and role in human disease. Humana Press, Springer New York Heidelberg Dordrecht London, pp 163-193, 2015
- De Meyts P. The insulin receptor: a prototype for dimeric, allosteric membrane receptors. Trends Biochem Sci 33:376-384, 2008
- Maruyama IN. Activation of transmembrane cell-surface receptors via a common mechanism? The "rotation model". Bioessays 37:959-967, 2015
- De Meyts P and Whittaker J. Structural biology of insulin and IGF1 receptors: implications for drug design. Nat Rev Drug Disc 1: 769-783, 2002
- Seino S, Seino M, Nishi S and Bell GI. Structure of the human insulin receptor gene and characterisation of its promoter. Proc Natl Acad Sci USA 86:114-118, 1989
- Seino S and Bell GI. Alternative splicing of human insulin receptor messenger RNA. Biochem Biophys Res Comm 159:312-316, 1989
- Mosthaf L, Giako K, Dull TJ, Coussens L, Ullrich A and McClain DA. Functionally distinct insulin receptors generated by tissue specific alternative splicing. EMBO J 9.2409-2413, 1990
- Knudsen L, De Meyts P and Kiselyov VV. Insight into the molecular basis for the kinetic differences between the two insulin receptor isoforms. Biochem J 440:297-403, 2011
- Belfiore A, Frasca F, Pandini G, Sciacca L, Vigneri R. Insulin receptor isoforms and insulin receptor/insulin-like growth factor receptor hybrids in physiology and disease. Endocr Rev 30:586-623, 2009
- Soos M, Field CE and Siddle K. Purified hybrid insulin/insulin-like growth factor-I receptors bind insulin-like growth factor-I, but not insulin, with high affinity. Biochem J 290:419-426, 1993
- Bajaj M, Waterfield MD, Schlessinger J, Taylor WR and Blundell TL. on the tertiary structure of the extracellular domains of the epidermal growth factor and insulin receptors. Biochim Biophys Acta 916:220-226, 1987
- Adams TE, Epa VC, Garrett TPJ and Ward CW. Structure and function of the type 1 insulin-like growth factor receptor. Cell Mol Life Sci 57:1050-1093, 2000
- Lou M, Garrett TP, McKern NM, Hoyne PA, Epa VC, Bentley JD, Lovrecz GO, Cosgrove LJ, Frenkel MJ and Ward CW. Crystal structure of the first three domains of the human insulin receptor reveals major differences from the IGF-1 receptor in the regions governing ligand specificity. Proc Natl Acad Sci USA 103.12429-12434, 2006
- McKern NM, Lawrence MC, Streltsov VA, Lou M-Z, Adams TE, Lovrecz GO, Elieman TC, Richards KM, Bentley JD, Pilling PA, Hoyne PA, Cartledge KA, Pham TM, Lewis JL, sankovich SE, Stoichevska V, Da Silva E, Robinson CP, Frenkel MJ, Sparrow LG, Fernley RT, Epa VC and Ward CW. Structure of the insulin receptor ectodaomain reveals a folded-over conformation. Nature 443218-221, 2006
- Smith BJ, Huang K, Kong G, Chan SJ, Nakagawa S, Menting JG, Hu S-Q, Whittaker J, Steiner DF, Katsoyannis PG, Ward CW, Weiss MA and Lawrence MC. structural resolution of a tandem hormone-binding element in the insulin receptor and its implications for design of peptide agonists. Proc Natl Acad Sci USA 107:6771-6776, 2010
- Whittaker J, Whittaker LJ, Roberts CT Jr, Phillips NB, Ismail-Belgi F, Lawrence MC and Weiss MA. a-helical element at the hormone-binding surface of the insulin receptor functions as a signaling element to activate its tyrosine kinase. Proc Natl Acad Sci USA 109:11166-11171, 2012
- Croll TI, Smith BJ, Margetts MB, Whittaker J, Weiss MA, Ward CW and Lawrence MC. Higher-resolution structure of the human insulin receptor ectodomain: multi-modal inclusion of the insert domain. Structure 24:469-476, 2016
- Ward CW, Menting JG and Lawrence MC. The insulin receptor changes conformation in unforeseen ways on ligand binding: sharpening the picture of insulin receptor activation. Bioessays 35:945-954, 2013
- De Meyts P. Insulin/receptor binding: the last piece of the puzzle? Bioessays 37:389-397, 2015
- Soos MA, Siddle K, Baron MD, Heward JM, Luzio JP, Bellatin J and Lennox ES. Monoclonal antibodies reacting with multiple epitopes of the insulin receptor. Biochem J 235:199-208, 1986
- De Meyts P, Roth J, Neville DM Jr, Gavin JR III and Lesniak MA. Insulin interactions with its receptors. experimental evidence for negative cooperativity. Biochem Biophys Res Commun 55:154-161, 1973
- Schäffer L. A model for insulin binding to the insulin receptor. Eur J Biochem 221:1127-1132, 1994
- De Meyts P. The structural basis of insulin and insulin-like growth factor-I (IGF-I) receptor binding and negative cooperativity, and its relevance to mitogenic versus metabolic signaling. Diabetologia 37:S135-S148, 1994
- Blundell TL, Dodson GG, Hodgin DC and Mercola DA. Insulin: the structure in the crystal and its reflexion in chemistry and biology. Adv Protein Chem 26.279-402, 1972
- Blundell TL and Wood SP. Is the evolution of insulin Darwinian or due to selectively neutral mutations? Nature 257:197-203
- Pullen RA, Lindsay DG, Wood SP, Tickle IJ, Blundell TL, Wollmer A, Krail G, Brandenburg D, Zahn H, Gliemann J and Gammeltoft S. The receptor-binding region of insulin. Nature 259:369-373, 1976
- Kristensen C, Kjeldsen T, Wiberg FC, Schäffer L, Hach M, Havelund S, Bass J, Steiner DF, Andersen AS. Alanine scanning mutagenesis of insulin. J Biol Chem 272: 12978-12983, 1997
- Jensen AM. Analysis of structure-function relationships of the insulin molecule by alanine-scanning mutagenesis. Master's thesis, Copenhagen, Denmark, Copenhagen University, 2000
- Gauguin L, Klaproth B, Sajid W, Andersen AS, McNeil K, Forbes BE and De Meyts P. Structural basis for the lower affinity of the insulin-like growth factors for the insulin receptor. J Biol Chem 283:2604-2613, 2008
- Huang K, Xu B, Hu SQ, Chu YC, Hua QX, Qu Y, Li B, Wang S, Wang RY, Nakagawa SH, Theede AM, Whittaker J, De Meyts P, Katsoyannis PG and Weiss MA. How insulin binds: the central B-chain a-helix contacts the N-terminal domain of the insulin receptor a-subunit. J Mol Biol 341.529-550, 2004
- Glendorf T, Sørensen AR, Nishimura E, Pettersson I and Kjeldsen T. Importance of the solvent-exposed residues of the insulin B-chain alpha-helix for receptor binding. Biochemistry 47:4743-4751, 2008
- Gauguin L, Delaine C, Alvino CL, McNeil KA, Wallace JC, Forbes B and De Meyts P. Alanine scanning of a putative receptor binding surface of insulin-like growth factor-I. J Biol Chem 283:20821-20829, 2008
- Kurose T, Pashmforoush M, Yoshimasa Y, Carroll R, Schwartz GP, Burke GT, Katsoyannis PG, Steiner DF. Crosslinking of a B25 azidophenylalanine insulin derivative to the carboxy-terminal region of the a-subunit of the insulin receptor. Biochemistry 43:8356-8372, 1994
- Xu B, Hu SQ, Chu YC, Huang K, Natagawa SH, Whittaker J, Katsoyannis PG and Weiss MA. Diabetes-associated mutations in insulin: consecutive residues in the B-chain contact distinct domains of the insulin receptor. Biochemistry 43:8356-8372, 2004
- Chan SJ, Natagawa S and Steiner DF. Complementation analysis demonstrates that insulin crosslinks both a subunits in a truncated receptor dimer. J Biol Chem 282:13754-13758, 2007
- Huang K, Chan SJ, Hua QX, Chu YC, Wang RY, Klaproth B, Jia W, Whittaker J, De Meyts P, Nakagawa SH, Steiner DF, Katsoyannis PG and Weiss MA. The A-chain of insulin contacts the insert domain of the insulin receptor: photocrosslinking and mutagenesis of a diabetes-related crevice. J Biol Chem 282.35337-35349, 2007.
- Whittaker L, Hao C, Fu W, Whittaker J. High affinity insulin binding: insulin interacts with two receptor ligand binding sites. Biochemistry 47: 12900-12909, 2008
- Menting JG, Whittaker J, Margetts MB, Whittaker L , Kong GK, Smith BJ, Watson CJ, Zakova L, Kletvikova E, Jiracek J, Chan SJ, Steiner DF, Dodson GG, Brzozowski AM, Weiss MA, Ward CW and Lawrence MC. How insulin engages its primary binding site on the insulin receptor. Nature 493:241-245, 2013
- Hua QX, Shoelson SE, Kochoyan M and Weiss MA. Receptor binding redefined by a structural switch in a mutant human insulin. Nature 354:238-241, 1991
- Ludvigsen S, Olsen HB and Kaarsholm NC. A structural switch in a mutant insulin exposes key residues for receptor binding. J Mol Biol 279:1-7, 1998
- Menting JG, Yang Y, Chan SJ, Phillips NB, Smith BJ, Whittaker J, Wickramasinghe NP, Whittaker LJ, Pandyarajan V, Wan Z-l, Yadav SP, Carroll JM, Strokes N, Roberts CT Jr, Ismail-Belgi F, Milewski W, Steiner DF, Chauhan VS, Ward CW, Weiss MA and Lawrence MC. Protective hinge in insulin opens to enable its receptor engagement. Proc Natl Acad Sci USA 111: E3395-E3404, 2014.
- Menting JG, Lawrence CF, Kong GK-W, Margetts MB, Ward CW and Lawrence MC. Structural congruency of ligand binding to the insulin and insulin/type 1 insulin-like growth factor hybrid receptors. Structure 23:1-12, 2015.
- Kiselyov VV, Versteyhe S, Gauguin L and De Meyts P. Harmonic oscillator model of the insulin and IGF1 receptor's allosteric binding and activation. Mol Sys Bio 5:243, 2009
- Knudsen L, De Meyts P and Kiselyov VV. Insight into the kinetic differences between the two insulin receptor isoforms. Biochem J 440:397-403, 2011
- Hubbard SR, Wei L, Ellis L and Hendrickson WA. Crystal structure of the tyrosine kinase domain of the human insulin receptor: Nature 372:746-754, 1994
- Hubbard SR. Crystal structure of the activated insulin receptor tyrosine kinase in complex with peptide substrate and ATP analog. EMBO J 16:5572-5581, 1997.
- Favelyukis S, Til JH, Hubbard SR and Miller WT. Structure and autoregulation of the insulin-like growth factor-I receptor kinase. Nature Struct Biol 8:1058-1062, 2001.
- Pautsch A, Zoephel A, Ahorn H, Spevak W, Hauptmann R and Nar H. Crystal structure of bis-phosphorylated IGF-I receptor kinase: insight into domain movements upon kinase activation. Structure 9, 955-965, 2001.
- Cabail MZ, Li S, Lemmon E, Bowen ME, Hubbard SR and Miller WT. The tyrosine kinase domain of the insulin and IGF1 receptors are functional dimers in the activated state. Nat Commun 6:6406, 2015
- Hubbard SR. The insulin receptor: both a prototypical and atypical receptor tyrosine kinase. Cold Spring Harbor Perspect Biol 5:a008946, 2013
- Süveges D and Jura N. Structural features of the kinase domain. In Wheeler DL and Yarden Y, ed itors. Receptor tyrosine kinases: structure, functions and role in human disease. Humana Press, Springer New York Heidelberg Dordrecht London, pp 195-223, 2015
- Li S, Covino ND, Stein EG, Till VH and Hubbard SR. Structural and biochemical evidence for an autoinhibitory role for tyrosine 984 in the juxtamembrane region of the insulin receptor. J Biol Chem 278:26007-26014, 2003
- Lee J, Miyazaki M, Romeo GR and Shoelson SE. Insulin receptor activation with transmembrane domain ligands. J Biol Chem 289: 19769-19777 (2014)
- Kavran JM, McCabe JM, Byrne PO, Connacher MK, Wang Z, Ramek A, Sarabipour S, Shan Y, Shaw DE, Hristova K, Cole PA and Leahy D. How IGF-1 activates its receptor. eLife 10.7554/eLife 03772, 2014
- Pawson T. Specificity in signal transduction: from phosphotyrosine-SH2 domain interactions to complex cellular systems. Cell 116:191-203, 2004
- 77.
Sun XJ, Rothenberg P, Kahn CR, Backer JM, Araki E, Wilden PA, Cahill DA, Goldstein BJ and White MF. Structure of the insulin receptor substrate IRS-1 defines a unique signal transduction protein. Nature 352:73-77, 1991
- 78.
White MF. The IRS signaling system: a network of docking proteins that mediate insulin action. Mol Cell Biochem 182.3-11, 1998
- 79.
Ravishandran KS. Signaling via Shc family adapter proteins. Oncogene 20:6322-6330, 2001
- 80.
Avruch J. insulin signal transduction through protein kinase cascades. Mol Cell Biochem 182:31-48, 1998
- 81.
White MF. Insulin signaling in health and disease. Science 302:1710-1711, 2003
- 82.
Taniguchi CM, Emanuelli B and Kahn CR. Critical nodes in signalling pathways: insights into insulin action. Nat Rev Mol Cell Biol 7: 85-96, 2006
- 83.
White MF and Copps KD. The mechanisms of insulin action. In Jameson JL, De Groot LJ, de Kretser DM, Giudice LC, Grossman AB, Melmed S, Potts JT Jr, Weir GC, editors. Endocrinology. Adult and pediatric. 7th edition. Elsevier Saunders. Volume 1, pp. 556-585.
- 84.
Boucher J, Kleinridders A and Kahn CR. Insulin receptor signaling in normal and insulin-resistant states. Cold Spring Harb Perspect Biol 6a009191, 2014
- 85.
Versteyhe S, Blanquart C, Hampe C, Mahmood S, Christoff N, De Meyts P, Gray SG and Issad T. IRS-5 and -6 are poor substrates for the insulin receptor. Mol Med Rep 3:189-193, 2010
- 86.
Shepherd P, Whithers DJ and Siddle K. Phosphoinositide 3-kinase: the key switch mechanism in insulin signalling. Biochem J 333:471-490, 1998. Erratum in Biochem J 335:711, 1998
- 87.
Cantley LC. The phosphoinositide 3-kinase pathway. Science 296:1655-1657, 2002
- 88.
Avruch J. MAP kinase pathways: the first twenty years. Biochim Biophys Acta 1773:1150-1160, 2007
- 89.
Harris TE and Lawrence JC Jr. TOR signaling. Sci. STKE 2003, RE 15, 2003
- 90.
Cohen P. The renaissance of GSK3. Nat Rev Mol Cell Biol 2:767-776, 2001
- 91.
Accili D and Arden KC. FoxOs at the crossroads of cellular metabolism, differentiation and transformation. Cell117:421-426, 2004
- 92.
Sano H, Kane S, Sano E, Miiner CP, Asara JM, Lane WS, Garner CW and Lienhard GE. Insulin-stimulated phosphorylation of Rab GTPase-activating protein regulates GLUT4 translocation. J Biol Chem 278:14599-14602, 2003
- 93.
Svendsen AM, Winge SB, Zimmermann M, nLindvig AB, Warzecha CB, Sajid W, Horne MC and De Meyts P. Downregulation of cyclin G2 by insulin, IGF-I (insulin-like growth factor 1) and X10 (Asp B10 insulin):role in mitogenesis. Biochem J 457:69-77, 2014.
- 94.
Skolnik EY, Lee CH, Batzer A, The SH2 SH3 domain containing protein Grb2 interacts with tyrosine phosphorylated IRS1 and Shc - implications for insulin control of Ras signaling. EMBO J 12:1929-1936, 1993
- 95.
Khan AH and Pessin JE. Insulin regulation of glucose uptake: a complex interplay of intracellular signaling pathways. Diabetologia 45:1475-1483, 2002
- 96.
Huang S and Czech MP. The GLUT4 glucose transporter. Cell Metab 5:237-252, 2007
- 97.
Gavin JR III, Roth J, Neville DM Jr, De Meyts P and Buell DN. Insulin-dependent regulation of insulin receptor cocentration: a direct demonstration in cell culture. Proc Natl Acad Sci USA 71:84-88, 1974
- 98.
Carpentier JL. Insulin receptor internalization: molecular mechanisms and pathophysiological implications. Diabetologia 37 Suppl 2: S117-S124, 1994
- 99.
Bergeron JJM, Di Guglielmo GM, Dahan S, Dominguez M and Posner BI. Spatial and temporal regulation of receptor tyrosine kinase activation and intracellular signal transduction. Annu Rev Biochem, 206 Mar 24 (Eprint ahead of print).
- 100.
Sorkin A and Fortian A. Endocytosis and endosomal sorting of receptor tyrosine kinases. In Wheeler DL and Yarden Y, ediitors. Receptor tyrosine kinases: structure, functions and role in human disease. Humana Press, Springer New York Heidelberg Dordrecht London, pp 133-161, 2015
- 101.
Enuka Y, Feldman ME and Yarden Y. Computational and modeling aspects of RTK networks. In Wheeler DL and Yarden Y, ediitors. Receptor tyrosine kinases: structure, functions and role in human disease. Humana Press, Springer New York Heidelberg Dordrecht London, pp 111-132, 2015
- 102.
Jensen M, Hansen BF, De Meyts P, Schäffer L and Ursø B. activation of the insulin receptor by insulin and a synthetic petide leads to divergent metabolic and mitogenic signaling and responses. J Biol Chem 282:35179-35186, 2007
- 103.
Jensen M and De Meyts P. Molecular mechanisms of differential intracellular signaling from the insulin receptor. Vitam Horm 80:51.75, 2009
- 104.
Zick Y. Ser/Thr phosphorylation of IRS proteins: a molecular basis for insulin resistance. Sci STKE 2005, PE4, 2005
- 105.
Hotamisligil GS. Mechanisms of TNFa-induced insulin resistance. Exp Clin Endocrinol Diab 107:119-125, 1999
- 106.
Bevan AI, Drake PG, Yale JF, Shaver A and Posner BI. Peroxyvanadium compounds: biological actions and mechanisms of insulin mimesis. Mol Cell Biochem 153:49-58, 1995
- 107.
Zhang ZY. Protein tyrosine phosphatases. Structure and function, substrate specificity and inhibitor development. Annu Rev Pharmacol Toxicol 42:209-234, 2002
- 108.
Elcheby M, Payette P, Michaliszyn E, Cromlish w, Collins S, Loy AL, Normandin D, Cheng A, Himms-Hagen J, Chan CC, Ramachandran C, Gresser MJ, Tremblay ML and Kennedy BP. Increased insulin sensitivity and obesity resistance in mice lacking the protein tyrosine phosphatase-1B gene. Science 283:1544-1548, 1999
- 109.
Haj FG, Verveer PJ, Squire A, Neel G and Bastiaens PI Imaging sites of receptor dephosphorylation by PTB1B on the surface of the endoplasmic reticulum. Science 295:1708-2002
- 110.
Klaman LG, Boss O, Peroni OD, Kim Jk, Martino JL, Zabolotny JM, Moghal N, Lubkin M, Kim YB, Sharpe AH, Stricker-Krongad A, Shulman GI, Neel BG and Kahn BB. Increase energy expenditure, decreased adiposity and tissue-specific insulin sensitivity in protein-tyrosine phosphatase 1B-deficient mice. Mol Cell Biol 20:5479-5489, 2000
- 111.
Mumbay MC and Walter G. Protein serine/threonine phosphatases: structure, regulation and functions in cell growth. Physiol Rev 73:673-699, 1993
- 112.
Camps M, Nichols A and Arkinstall S.Dual-specificity phosphatases: a gene family for control of MAPK function. FASEB J 14:6-16, 2000
- 113.
Maehama T and Dixon JE. PTEN, a tumour suppressor that functions as a phospholipid phosphatase. Trends Cell Biol 9:125-128, 1999
- 114.
Emmanuelli B, Peraldi P, Filloux C, Sawka - Verhelle D, Hilton D and Van Obberghen E. SOCS3 is an insulin-induced negative regulator of insulin signaling. J Biol Chem 275:15985-15991, 2000
- 115.
Howard JK and Flier JS. Attenuation of leptin and insulin signaling by SOCS proteins. Trends Endocrinol Metab 17:365-371, 2006
- 116.
Desbuquois B, Carré N and Burnol AF. Regulation of insulin and type 1 insulin-like growth factor signaling and action by the Grb10/14 and SH2B1/B2 adaptor proteins. FEBS J. 280:794-816, 2013.
- 117.
Chin CN, Dallas-Yang Q, Liu F, Ho T, Ellsworth K, Fischer P, Natasha T, Ireland C, Lu P, Li C, Wang IM, Strohl W, Berger JP,An Z, Zhong BB and Jiang G. Evidence that inhibition of insulin receptor signaling activity by PC-1/ENPP1 is dependent on its enzyme activity. Eur J. Pharmacol. 606:17-24, 2009
- 118.
De Meyts P. The diabetogenes concept of NIDDM. In "New concepts in the pathogenesis of NIDDM", ed. by C.G. Östenson, S. Efendic and M. Vranic. Adv Exp Med Biol vol. 334, Plenum Press, New York and London, pp 89-100, 1993
- 119.
Kahn CR. Banting lecture. Insulin action, diabetogenes, and the cause of type II diabetes. Diabetes, 43: 1066-1084, 1994.
- 120.
Lamothe B, Baudry A, Desbois P, Lamotte L, Bucchini D, De Meyts P and Joshi RL. Genetic engineering in mice: impact on insulin signaling and action. Biochem J 335:193-204, 1998
- 121.
Taylor SI. Lilly lecture: molecular mechanisms of insulin resistance. lessons from patients with mutations in the insulin receptor gene. Diabetes 41:1473-1490, 1992
- 122.
Vorwerk P, Christoffersen CT, Müller J, Vestergaard H, Pedersen O and De Meyts P. Alternative splicing of exon 17 and a missense mutation in exon 20 of the insulin receptor gene in two siblings with a novel syndrome of insulin resistance (congenital fiber-type disproportion myopathy). Horm Res 52:211-220, 1999
- 123.
Accili D, Drago J, Lee EJ, Johnson MD, Cool Mh, Salvatore P, Asico LD, José PA, Taylor SI and Westphal A. Nat Genet 12:106-109, 1996
- 124.
Joshi RL, Lamothe B, Cordonnier N, Mesbah K, Monthioux E, Jami J and Bucchini D. Targeted disruption in the insulin receptor gene in the mouse results in neonatal lethality. EMBO J 15:1542-1547, 1996
- 125.
Wertheimer E, Lu SP, Backeljauw PF, Davenport ML and Taylor SI. Homozygous deletion of the human insulin receptor gene results in leprechaunism. Nat Genet 5:71-73, 1993
- 126.
Krook A , Brueton L and O'Rahilly S. Homozygous nonsense mutation in the insulin receptor gene in infant with leprechaunism. Lancet 342:277-278, 1993
- 127.
Psiachou H, Mitton S, Alaghband-Zadeh J, Hone J, Taylor SI and Sinclair L. Leprechaunism and homozygous nonsense mutation in the insulin receptor gene. Lancet 342:924, 1993.
- 128.
Jospe N, Kaplowitz PB and Furlanetto RW. Homozygous nonsense mutation in the insulin receptor gene in a patient with severe congenital insulin resistance, leprechaunism and the role of the insulin-like growth factor receptor. Clin Endocrinol 45:229-255, 1996
- 129.
Soll AH, Kahn CR and Neville DM Jr. Insulin binding to liver plasma membranes in the obese hyperglycemic (ob/ob) mouse. demonstration of a decreased number of functionally normal receptors. J Biol Chem 250:4702-4707, 1975
- 130.
Soll AH, Kahn CR, Neville DM Jr and Roth J. Insulin receptor deficiency in genetic and acquired obesity. J Clin Invest 56:769-780, 1975
- 131.
Friedman JE, Ishizuka T, Liu S, Farrell CT, Bedol D, Koletsky RJ, Kung HL and Einsberger P. Reduced insulin receptor signaling in the obese spontaneously hypertensive Koletsky rat. Am J Physiol, 273:E1014-1023, 1997
- 132.
Bar RS, Gorden P, Roth J, Kahn CR and De Meyts P. Fluctuation in the affinity and concentration of insulin receptors on circulating monocytes of obese patients; effects of starvation, refeeding and dieting. J Clin Invest 58:1123-1135, 1976.
- 133.
Olefsky JM. Decreased insulin binding to adipocytes and circulating monocytes from obese subjects. J Clin Invest 57:1165-1172, 1976
- 134.
Misbin RI, O'Leary D and Palkkinen A. Insulin receptor binding in obesity: a reassessment. Science 205:1003-1004, 1979
- 135.
Amatruda JM, Livingston JN and Lockwood DH. Insulin receptor role in the resistance of human obesity to insulin. Science 188:264-266, 1975
- 136.
Kolterman OG, Gray RS and Griffin J Receptor and postreceptor defects contribute to the insulin resistance in non insulin dependent diabetes mellitus. J Clin Invest 68: 957-969, 1981.
- 137.
Sesti G, Federici M, Hribal ML, Lauro D, Sbraccia P and Lauro R. Defects of the insulin receptor substrate (IRS) system in human metabolic disorders. FASEB J 15:2099-2111(20019:
- 138.
Tamimoto H, Kadowaki T, Tobe K, Yagi T, Sakura H, Hayakava T, Terauchi Y, Ueki K, Kaburagi Y, Satoh S, Sekiraha H, Yoshioka S, Horikoshi H, Furuta Y, Ikawa Y, Kasuga M, Yasaki Y and Aizawa S. Insulin resistance and growth retardation in mice lacking insulin receptor substrate 1. Nature 372:182-186, 1994
- 139.
Araki E, Lipes MA, Patti M-E, Brüning JC, Haag B III, Johnson RS and Kahn CR. Alternative pathway of insulin signalling in mice with targeted disruption of the IRS-1 gene. Nature 372:186-190, 1994.
- 140.
Withers D, Guttierez JS, Towery H, Burks DJ, Ren JM, Pravis S, Zhang Y, Bernal D, Pons S, Shulman GI, Bonner-Weir S and White MF. Disruption of IRS-2 causes type 2 diabetes in mice. Nature 391:900-904, 1998
- 141.
Leibiger IB, Leibiger B and Berggren PO. Insulin signaling in the pancreatic beta cell. Annu Rev Nutr 28:233-251, 2008
- 142.
Kulkarni RN, Brüning JC, Winnay JN, Postic C, Magnuson MA and Kahn CR. Tissue-specific knockout of the insulin receptor in pancreatic beta cells creates an insulin secretory defect similar to that in type 2 diabetes. Cell 96:329-339, 1999
- 143.
Tarauchi Y, Satoh S, Minowa H, Murakami K, Okuno A, Inukai K, Asano T, Kaburagi Y, Ueki K, Nakajima H, Hanafusa T, Matsurawa Y, Sekiraha H, Yin Y, Barrett JC, Oda H, Ishikawa T, Akahuma Y, Kimuro I, Suzuki M, Yamamura K, Kodama T, Suzuki H, Koyasu S, Aizawa S, Tobe K, Fukui Y, Yasaki Y and Kadowaki T. Increased insulin sensitivity and hypoglycemia in mice lacking the p85a subunit of phosphoinosiitide-3 kinase. Nature Genet 21:230-235, 1998
- 144.
Mauvais-Jarvis F, Fruman DA, Hirshman MF, Sakamoto K, Goodyear LJ, Iannacone M, Accili D, Cantley LC and Kahn CR. Reduced expression of the murine p85a subunit of phosphoinositide-3 kinase improves insulin signaling and ameliorates diabetes. J Clin Invest 109:141-149, 2002
- 145.
Katz EB, Stenbit AE, Hatton K, DePinho R and Charron MJ. Cardiac and adipose tissue abnormalities but not diabetes in mice deficient in GLUT4. Nature 377:151-155, 1995
- 146.
Brüning JC, Michael MD, Winnay JN, Hayashi T, Horsch D, Accili D, Goodyear LJ and kahn CR. A muscle-specific insulin receptor knockout exhibits features of the metabolic syndrome of NIDDM without altering glucose tolerance. Mol Cell 2:559-569, 1998
- 147.
Blüher M, Michael MD, Peroni OD, Ueki K, Carter N, Kahn BB and Kahn CR. Adipose-tissue selective insulin receptor knockout protects against obesity and obesity-related glucose intolerance. Dev Cell 3:25-38, 2002.
- 148.
Michael MD, Kulkarni RN, Postic C, Previs SF, Shulman GI, Magnuson MA and Kahn CR. Loss of insulin signaling in hepatocytes leads to severe insulin resistance and progressive hepatic dysfunction. Mol Cell 6:87-97, 2000
- 149.
Posner BI, Kelly PA, Shiu RPC and Friesen HG. Studies of insulin, growth hormone and prolctin binding: tissue distribution, species variation and characterization. Endocrinology 95:321-531, 1974
- 150.
Havrankova J, Roth J and Brownstein M. Insulin receptors are widely distributed in the central nervous system of the rat. Nature 272:827-8829, 1978
- 151.
Brüning JC, Gautam D, Burks DJ, Gillette J, Schubert M, Orban PC, Klein R, Krone W, Müller-Wieland D and Kahn CR. Role of brain insulin receptor in control of body weight and reproduction. Science 289:2122-2125.
- 152.
Billings LK and Flores JC. The genetics of type 2 diabetes: what have we learned from GWAS? Ann NY Acad Sci 1212:59-72, 2010
- 153.
Morris AP et al. Large scale association analysis provides insight into the genetic architecture and pathophysiology of type 2 diabetes. Nat Genet 44, 981-990, 2012
- 154.
Versteyhe S, Klaproth B, Borup R, Palsgaard J, Jensen M, Gray S and De Meyts P. IGF-I, IGF-II, and insulin stimulate different gene expression responses through binding to the IGF-I receptor. Front Endocrinol (Lausanne) 4:98, 2013
- 155.
Pajvani UB and Accili D. The new biology of diabetes. Diabetologia 58:2459-2468, 2015
- 156.
Talchai C, Xuan S, Lin HV, Sussel L and Accili D. Pancreatic beta cell dedifferentiation as a mechanism of diabetic beta cell failure. Cell 150:1223-1234, 2012
- 157.
Cinti F, Bouchl R, Kim-Muller JY, Ohmura Y, Sandoval PR, Masini M, Ratner LE, Marchetti P and Accili D. Evidence of beta cell dedifferentiation in human type 2 diabetes. J Clin Endocrinol Metab 101:1044-1054, 2016.
- ABSTRACT
- INTRODUCTION
- THE RECEPTOR TYROSINE KINASE SUPERFAMILY
- MODULAR STRUCTURE OF THE INSULIN RECEPTOR
- STRUCTURE OF THE UNBOUND INSULIN RECEPTOR ECTODOMAIN (apo-RECEPTOR)
- DEFINITION OF THE RECEPTOR BINDING SURFACES ON THE INSULIN AND RECEPTOR MOLECULES
- STRUCTURE OF THE SITE 1 INSULIN-RECEPTOR COMPLEX
- QUANTITATIVE ANALYSIS OF THE INSULIN-RECEPTOR BINDING PARAMETERS: THE HARMONIC OSCILLATOR MODEL
- STRUCTURE OF THE INSULIN RECEPTOR TYROSINE KINASE
- MECHANISM OF INSULIN RECEPTOR ACTIVATION BY LIGAND BINDING
- THE INTRACELLULAR INSULIN RECEPTOR SIGNAL TRANSDUCTION NETWORK
- The PI3K Signaling Pathway
- The MAPK-ERK Signaling Pathway
- INSULIN REGULATION OF GLUT4 TRANSLOCATION
- NEGATIVE REGULATION OF INSULIN RECEPTOR SIGNALING, SIGNAL TERMINATION
- Insulin Receptor and IRS Proteins Downregulation
- Serine phosphorylation of IRS Proteins
- Dephosphorylation of Insulin Signaling Proteins by Protein Phosphatases and Phospholipid Phosphatases
- Other attenuators of insulin receptor signaling: suppressor of cytokine signaling (SOCS) proteins, growth-factor-receptor-bound protein 10/14 (Grb10/14) and plasma-cell membrane glycoprotein-1 (PC-1)
- Negative Regulation of PI3K and Insulin Action by the PI3K Regulatory Subunit
- CLINICAL IMPLICATIONS OF THE INSULIN RECEPTOR AND SIGNAL TRANSDUCTION NETWORK
- CONCLUSIONS AND PERSPECTIVES
- ACKNOWLEDGEMENTS
- REFERENCES
- The Insulin Receptor and Its Signal Transduction Network - EndotextThe Insulin Receptor and Its Signal Transduction Network - Endotext
- Mus musculus RNA-binding region (RNP1, RRM) containing 3, mRNA (cDNA clone MGC:2...Mus musculus RNA-binding region (RNP1, RRM) containing 3, mRNA (cDNA clone MGC:27940 IMAGE:3587176), complete cdsgi|16741597|gb|BC016603.1|Nucleotide
Your browsing activity is empty.
Activity recording is turned off.
See more...