

Comparative Genome Viewer
- What is CGV?
- How do I configure a view?
- What am I looking at in the viewer?
- How do I navigate in the viewer?
- Can I see genes?
- Can I go to a particular gene?
- Can I get additional information?
- How can I analyze sequence differences in the alignment?
- Can I view a simple overview of the alignment, i.e. dotplot?
- Do you take requests?
- Can you add my favorite alignment?
What is CGV?
Comparative Genome Viewer (CGV) visualizes eukaryotic whole genome assembly-assembly alignments. You can choose from a selection of alignments that are provided by NCBI.
- Example of same-species alignment at the whole genome level: Danio rerio Zv7 (GCF_000002035.1) to Danio rerio GRCz11 (GCF_000002035.6)
- Example of cross-species alignment at the chromosome level: Drosophila yakuba Prin_Dyak_Tai18E2_2.1 (GCF_016746365.2) to Drosophila melanogaster Release 6 plus ISO1 MT (GCF_000001215.4)
Check out our YouTube tutorial for an overview of how to compare genomes using this tool.
CGV is developed as part of the Comparative Genomics Resource (CGR), an ecosystem for comparative genomics analysis at the National Library of Medicine.
How do I configure a view?
Fill out the form on the home page to select an assembly pair with available whole genome alignment data. In steps 1 and 2, choose your species of interest, and then select assemblies in steps 3 and 4. You can start typing a species name or a common name and the form will automatically suggest available options.
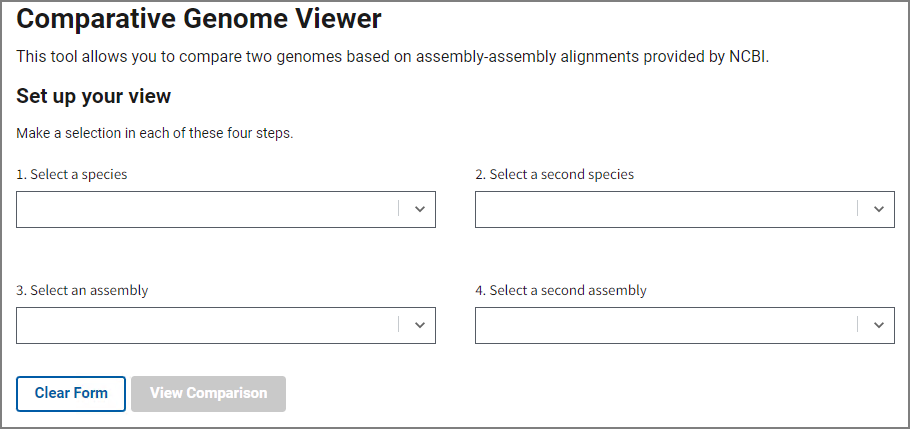
Once you’ve selected an assembly pair, press View Comparison to show the alignment in the graphical Comparative Genome Viewer. Contact us using the link at the bottom if you’d like request additional assembly comparisons.
What am I looking at in the viewer?
You are looking at whole-genome assembly-assembly alignments. Same-species alignments and some closely-related cross-species alignments are generated using the NCBI assembly alignment pipeline. Additional cross-species alignments were generated by the UCSC Genome Browser, The Human Pangenome Research Consortium (HPRC), or by other methods as described in the information popover on the page. The original files from UCSC or HPRC were minimally processed for display by NCBI.
In the main viewer, the two assemblies are laid out horizontally, with bars (“ideograms”) representing the chromosomes. Chromosomes will be striped with cytogenetic banding where available. The colored connector lines or bands represent alignments between the chromosomes in the two assemblies. The forward alignments are colored green, while the reverse alignments are colored purple. Reverse alignments are also rendered with a "twist" shape. If an alignment is selected (by clicking on it), the color will change to blue. Alignments involving scaffolds that are not assembled into chromosomes are not shown. By default, the view only displays reciprocal best-placed alignments ("First Pass") larger than 10000 bases in length.
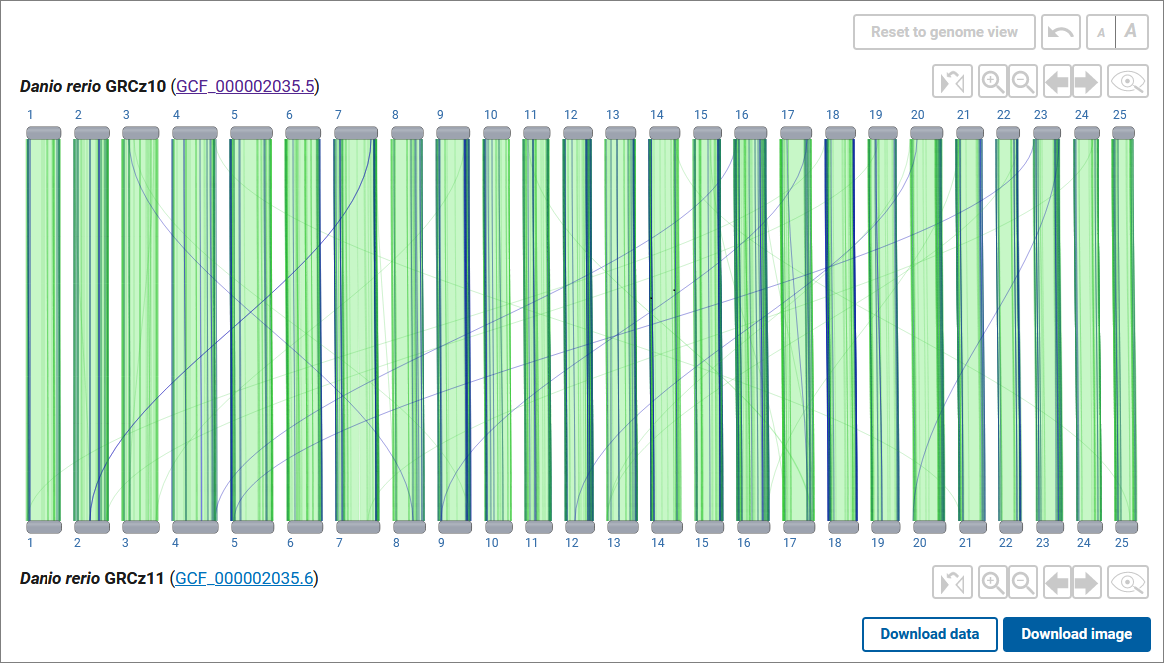
Use the Download image button to download a scalable vector graphics image (SVG) of your current view for use in presentations and publications. Use the Download data button to obtain complete whole genome alignment data including alignment of non-chromosomal scaffolds.
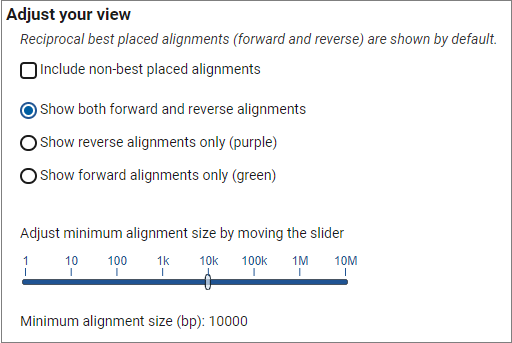
Use the options under the Adjust Your View section to filter alignments in view.
- Check the box "Include non-best placed alignments" to show both "First Pass" (1:1) and "Second Pass" (1:2, 2:1) alignments. "First Pass" alignments are shown by default and are defined as the best reciprocal match; i.e. region A in assembly 1 has its best match at region A' in assembly 2 and vice versa. "Second pass" includes situations where there are two good matches; e.g. region B in assembly 1 matches both region B' and region B'' in assembly 2. "Second pass" alignments may result from highly similar duplications in one assembly relative to another. Note that we currently do not provide alignments past the best and second-best matches. See assembly alignment documentation for more information on how "First Pass" and "Second Pass" alignments are generated and defined.
- Choose among the radio options to view only forward or reverse alignments. Both forward and reverse alignments are shown by default.
- Filter the size of alignments in view using the slider. Move the slider all the way to the left to see all alignments, or to the right to show just alignments at the megabase level.
How do I navigate in the viewer?
Click on a chromosome (or chromosome number) from each assembly to zoom to the chromosome level comparison. From here, you can zoom in or out using the navigation buttons for each assembly (image below, B and C) or by pinch/mouse scroll or dragging your mouse across the coordinate ruler.
Pinch/mouse scroll in the center of the alignment to zoom synchronously on the top and bottom chromosome (image below, area J), or closer to the top or bottom chromosome to zoom more selectively (image below, areas I). Drag with your mouse or use the pan buttons (image below, D and E) to pan the view.
You can zoom to a range on the top or bottom assembly by dragging your cursor across the sequence ruler (image below, area H) or on the chromosome ideogram (image below, area G).
To zoom synchronously to a particular alignment, either double-click on the alignment segment, or use the Zoom to alignment button in the alignment details panel.
Use the flip button (image below, A) to reverse the orientation of a chromosome in order to view alignments in the opposite orientation. This can allow you to view reverse alignments in the forward (left to right) orientation in the viewer.
Use the GDV button (image below, F) to navigate to Genome Data Viewer (GDV) for a particular assembly. GDV will open for the same chromosome sequence coordinate range viewed in CGV and will include the assembly-assembly alignment as a data track. From GDV, you can examine gene and sequence level differences in more detail, as well as add annotation or experimental data as tracks in the browser.
To return to the whole genome view, use the Reset to genome view button above the viewer. To get back to the previous zoom level, use the Undo button.
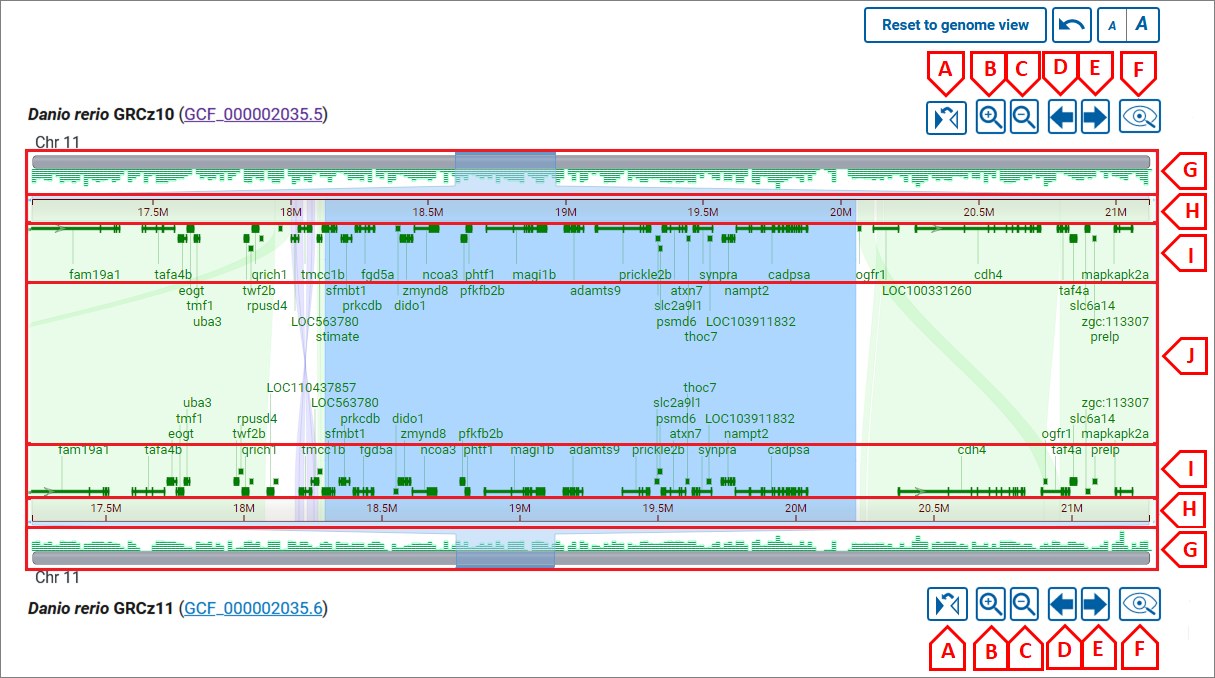
Flip, Zoom, Pan, View in GDV buttons:
- A - flip chromosome;
- B - zoom in;
- C - zoom out (full zoom out shows all chromosomes in an assembly);
- D - pan left;
- E - pan right;
- F - view in GDV;
Zoom/pan with mouse wheel or pinch:
- G - chromosome ideogram area: drag to select and zoom to the selected region;
- H - ruler area: drag to select and zoom to the selected region;
- I - area to zoom in/out or pan on one chromosome: to zoom - use the mouse wheel or pinch; to pan - press left mouse button and drag;
- J - area to zoom in/out or pan on both chromosomes: to zoom - use mouse wheel or pinch; to pan - press the left mouse button and drag;
Can I see genes?
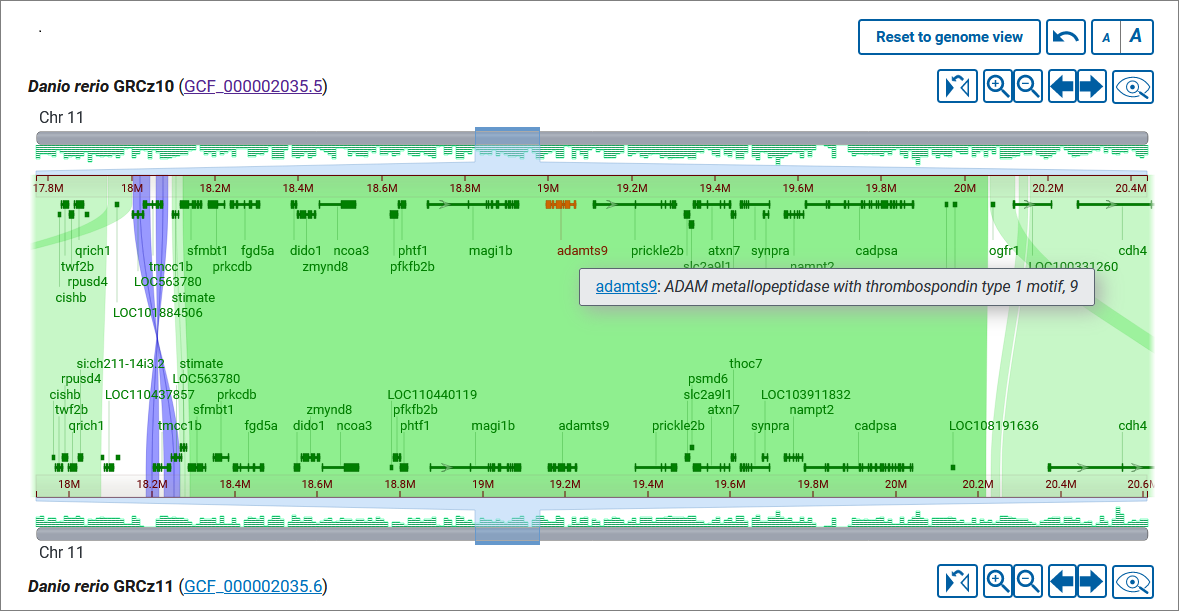
Yes, you can view genes when zoomed to a single chromosome. Gene annotation, where available, is displayed as a density histogram on the chromosome ideogram and as discrete feature boxes. A deeper zooming to the region reveals exon-intron structure of the genes. (Note: the threshold for displaying exons is 0.5 rem (8 px). The shorter genes do not show exons). Hover over a gene feature to view details in a tooltip. If the gene annotation comes from RefSeq, the gene symbol in the tooltip will link to the corresponding record in the NCBI Gene database, where you can get more information about the gene function and transcript variants.
Font size is adjustable for gene symbols, gene tooltips, and the alignment details panel (see below). To change the font size, use the a|A buttons above the viewer.
Can I go to a particular gene?
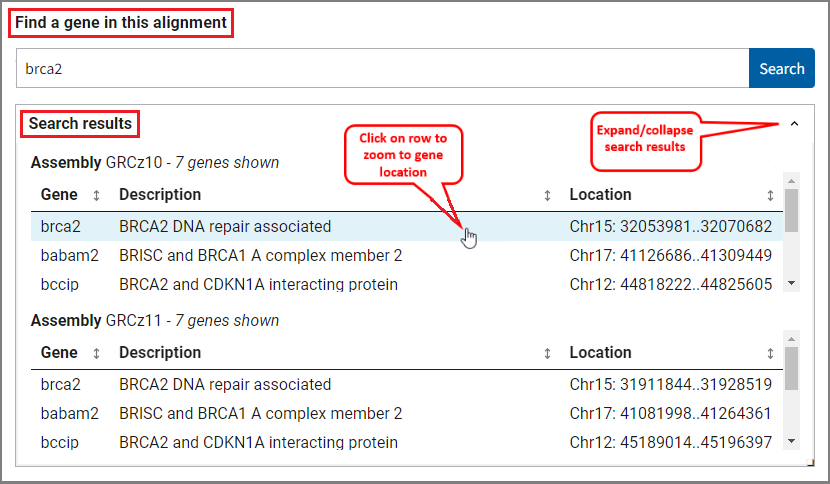
Yes, you can use the search functionality to jump to a specific gene. Simply enter a gene symbol (e.g. brca2, SNAR-A1, LOC101883589) or description (e.g. ribosomal protein L10, indolamine 2,3-dioxygenase, phosphatase Mg2+/Mn2+ dependent) in the search box and click the Search button. Matches for the search term will appear in the search results table. The results are sorted for both assemblies separately and include gene name, description and location.
If there's an exact match to your search term, the comparative view will navigate automatically to the region of that gene. If there are multiple matches per assembly, you can hover over and click on a row in the search results table to navigate to a selected gene's location. The viewer will automatically zoom to the selected location on one assembly as well as the location of its one-to-one ortholog, if known, on the other assembly. If no ortholog is detected, or if the other assembly does not have gene annotation, the viewer will zoom within the assembly-assembly alignment to the approximate location of the selected gene's alignment.
You can also click on a gene feature in the viewer to zoom directly on its location. If the gene is part of an assembly-assembly alignment, both assemblies will be zoomed to the region of the gene on one assembly and its alignment on the other assembly.
Can I get additional information?
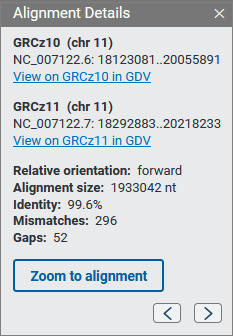
When you click on an alignment band you’ll see a panel with additional information about the alignment, including the sequence accession and coordinates, relative orientation, alignment size, percent identity, and number of mismatches and gaps. You can hold and drag this panel to another position on the page if you wish. The panel will remain open while the mouse cursor is inside the panel; you can close the panel using the x button.
Use the Zoom to alignment button to zoom the selected alignment segment to the center of the view. The arrow icons in the panel allow you to navigate between alignments in the current view of the chromosome. Note: the arrow icons are shown only if there are two or more alignment in the view for a particular chromosome.
If the assembly is available in the GDV genome browser, you’ll be able to navigate to GDV from the alignment details panel. GDV will be zoomed to the selected alignment with the assembly-assembly alignment data shown as a track in the browser.
How can I analyze sequence differences in the alignment?
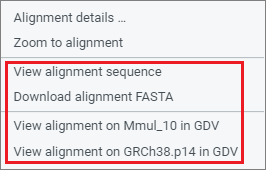
There are several ways to examine assembly alignments in more detail, including at the sequence base level. These options are available in the right-click context menu.
Genome Data Viewer (GDV)
If one or both assemblies are available in NCBI's Genome Data Viewer (GDV) genome browser, you will have the option to navigate to GDV for further analysis. GDV will open in a new tab and will be zoomed to the same region you are zoomed within CGV (see GDV view for the Macaca mulata HCRT gene region). The assembly-assembly alignment that you were viewing in CGV will be shown as a track in the GDV browser. Zoom to sequence level in GDV to examine sequence level differences in the assembly-assembly alignment track relative to the genome assembly you are viewing. You can also analyze sequence differences in the context of additional biological information displayed as tracks in GDV, including transcript and CDS annotation, variation, repeats, or your own custom data mapped to the genome assembly. Refer to the GDV documentation for more information about the genome browser.
Sequence Panel
Select the option to "View alignment sequence" option in the right-click context menu to open a panel showing the pairwise sequence for an alignment segment. This view provides a quick overview of the amount of sequence difference within an alignment. You can use this view to navigate to a known position in one assembly to see if it differs in the other assembly.
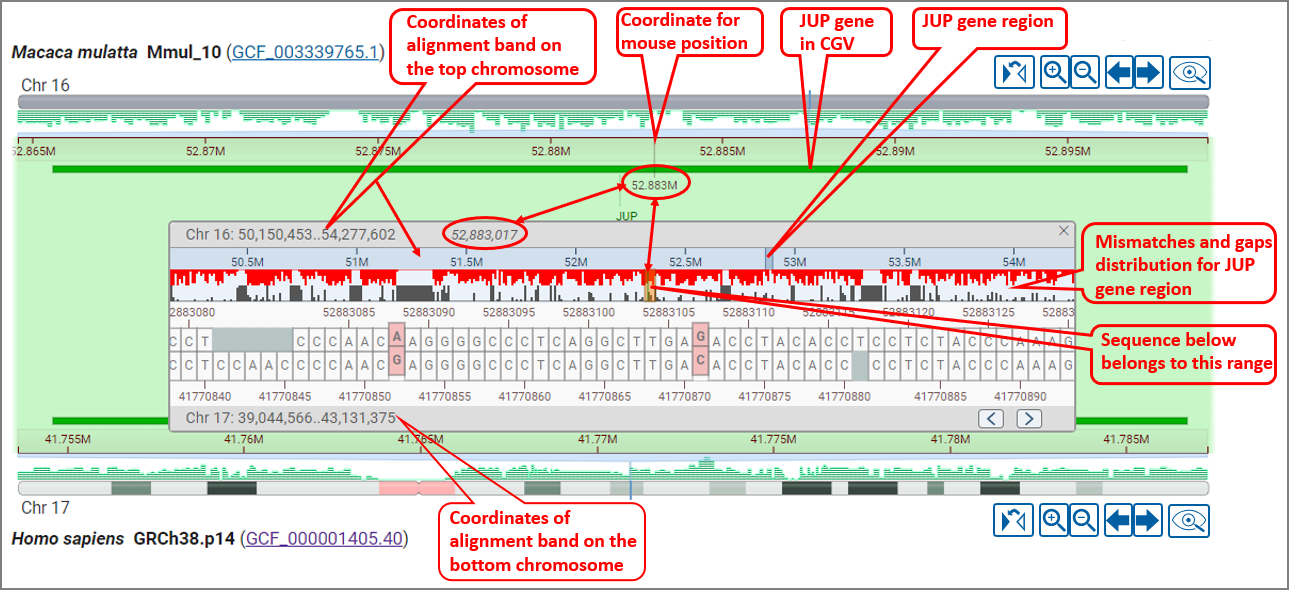
Mismatches are colored pink/red, while gaps are grey. The gaps and mismatches for the entire alignment segment are summarized in a histogram above the sequence. You can pan within the sequence alignment to navigate to a particular location. You can also select a range in the ruler or summary histogram to zoom within a particular region. The arrow buttons on the lower right corner allow you to jump to the next or previous mismatch or gap in the alignment.
Alignment FASTA
Select the option to "Download alignment FASTA" in the right-click context menu to download a FASTA alignment file that includes sequences for both assemblies for an alignment segment. This data can be imported in downstream analysis using your method or tool of choice.
Can I view a simple overview of the alignment, i.e. dotplot?
A genome dotplot provides an alternative high level view of the whole genome assembly-assembly alignment. You can open the dotplot by clicking the Go to dotplot view link in the upper right corner of the main CGV ideogram view. The axes in the dotplot are labeled with the organisms, assembly names and accessions, and chromosome numbers. Each cell in the dotplot represents a pairwise alignment between a chromosome from one assembly and a chromosome from the other assembly. As in the main ideogram viewer, the forward alignments are plotted in green, while the reverse alignments are purple. The data is not filtered in the dotplot view, so non-reciprocal best placed alignments may be visible in this view.
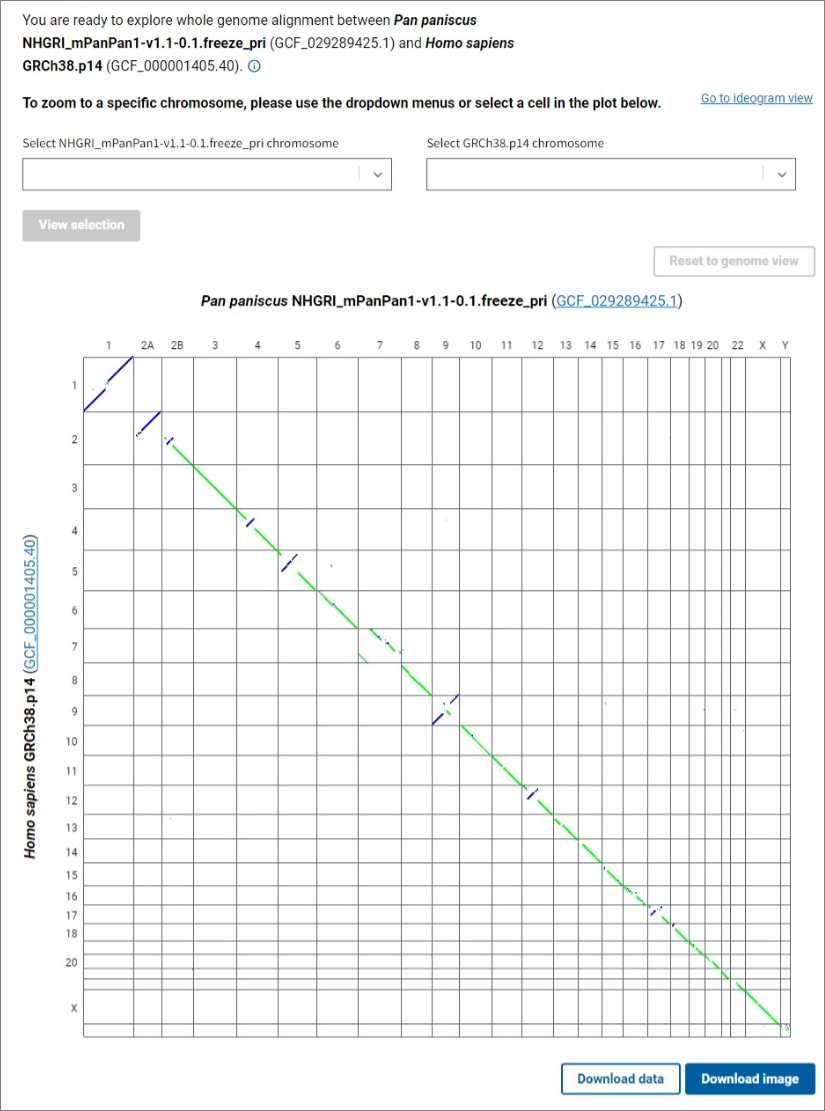
To see a dotplot of the alignments between a pair of chromosomes, select the chromosomes of interest for each assembly using the dropdown lists and click the View selection button, or click on a cell in the genome dotplot view. The Reset to genome view button allows you to return to the whole genome alignment dotplot. Click on the Download image button below the dotplot to export a PNG image of the dotplot for further use in presentations and publications.
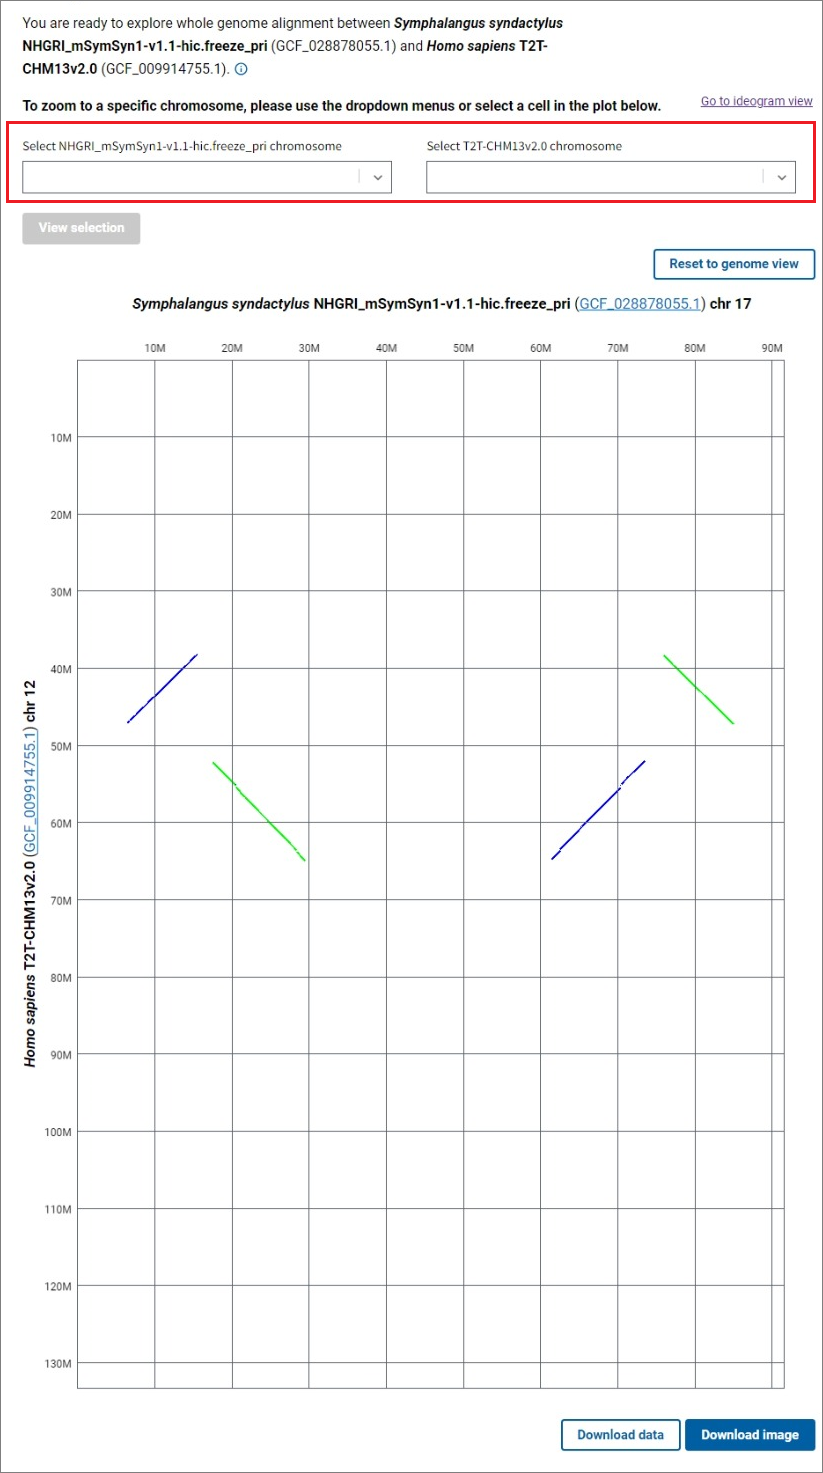
The Go to ideogram view link in the upper right corner will redirect you to the main ideogram view showing the same chromosome or genome comparison you were viewing in the dotplot. You can zoom further in the ideogram view, view gene annotation, and obtain additional information about the alignments.
Do you take requests?
Yes! This tool is in active development, and we’d love to hear how we can further improve to serve you better. Write us to let us know what you think.
Can you add my favorite alignment?
We are planning on adding more whole genome alignments in the future, including more cross-species comparisons. We’d love to hear which ones you’d like. Click on the link near the bottom of the home page to submit a request.
Currently, we only display alignments between complete chromosome-level assemblies that are found in the public INSDC databases. Please submit your assembly to GenBank if you have not already done so.