

Overview of Structural Variation
I. Introduction
II. Accessing dbVar Data
III. dbVar/DGVa/TogoVar-repository Data Model and Data Exchange Policy
IV. How NCBI Displays Variant Data
V. SV detection technology
VI. References
I. Introduction
Structural variation (SV) is generally defined as a region of DNA approximately 1 kb and larger in size [1] and can include inversions and balanced translocations or genomic imbalances (insertions and deletions), commonly referred to as copy number variants (CNVs). These CNVs often overlap with segmental duplications, regions of DNA >1 kb present more than once in the genome, copies of which are >90% identical [2]. If present at >1% in a population a CNV may be referred to as copy number polymorphism (CNP).
In 1991, Charcot-Marie Tooth (CMT) disease was the first autosomal dominant disease associated with a gene dosage effect due to an inherited DNA rearrangement. Most cases of CMT1A are associated with a 1.5-Mb tandem duplication in 17p11.2-p12, mediated by flanking segmental duplications, that encompasses the PMP22 gene (see Figure 1). The disease phenotype results from having three copies of the normal gene. The reciprocal product of the recombination, a single copy of the PMP22 gene, results in the clinically distinct hereditary neuropathy with liability to pressure palsies (HNPP) [3].
 disease")
Figure 1: Charcot-Marie Tooth (CMT) disease. Unequal crossing over between two highly homologous repeats on chromosome 17p12 can result in (A) 3 copies of the PMP22 gene with the CMT1A phenotype or the reciprocal (B) and 1 copy of the PMP22 gene with the HNPP phenotype.
It is now widely accepted that CNVs account for a number of genomic disorders including DiGeorge/velocardiofacial, Smith-Margenis, Williams-Beuren and Prader-Willi syndromes and, with increased genotype-phenotype correlations, an increasing number of new genomic disorders such as the 17q21.31 microdeletion in learning disability [4]\ [5] and most recently with the 16p11.2 microdeletion in autism [6].
Copy number variation among genes is not restricted to a disease phenotype. Many genes that are found to be CNV (both in humans and in mouse) are involved in environmental response, for example sensory perception (olfactory receptors) and immunity (defensins) [7-13]. However, evidence for copy number variation in disease resistance and susceptibility in humans is accumulating with publications on CCL3L1 and susceptibility to HIV/AIDS [14], FCGR3B and risk of systemic lupus erythematosus [15] and several independent studies correlating copy number of the beta defensin genes with predisposition to Crohn’s disease [16], risk of psoriasis [17] and sporadic prostate cancer [18].
Although single nucleotide polymorphisms (SNPs) were initially thought to contribute the majority of human genomic variation [19-20] it is now recognized that structural variation represents a significant, and at present poorly understood, contribution to an individual’s genetic makeup. It is only within the past 5 years, aided by the development of technologies such as high-throughput sequencing and array comparative genome hybridization (aCGH), that the extent of structural variation in phenotypically normal individuals has been investigated.
Estimates for the extent of CNV in the phenotypically normal human genome vary. The Database of Genomic Variants (DGV) has annotated 18.8% of the euchromatic human genome as copy number variable. However, most recently Perry et al. suggest that previous reports are overestimates and that the actual CNV content of the human genome, while still covering Mb of DNA, will be less than 12% [21].
II. Accessing dbVar Data
dbVar contains more than 6 million submitted structural variants from over 185 submitted human studies including large diversity projects such as the 1000 Genomes Project, gnomAD, and the CNV Global Population Survey (Sudmant et al. 2015), and from clinical sources such as ClinVar and ClinGen. A list of available datasets can be found here.
III. dbVar/DGVa/TogoVar-repository Data Model and Data Exchange Policy
Data Model
dbVar accessions three specific objects:
-
Studies (std): All variant regions and variant instances that are submitted as a group are part of a study. Each study typically represents a coherent set of methods and analyses that were performed at around the same time, by the same authors, in the same laboratory (or laboratories). Because these parameters determine to a large extent the variability that exists between datasets, all data in dbVar is organized by study. Typically, a study will correspond to a single publication or community resource. Study ids are prefixed with ‘nstd’ if the data were accessioned at NCBI, 'estd’ if accessioned at EBI, and 'dstd’ if accessioned at DDBJ.
-
Variant regions (sv): Variant regions are regions of the genome that a submitter has defined as containing structural variation. Very little meta-data is contained on these objects, as they are meant to provide a mark on the genome to define regions containing variation. Variant regions point to sets of exemplar variant instances which support the assertion that the region contains variation. Important: Key to understanding dbVar's data model is an awareness that variant regions do not represent reference variants, nor are they idealized representations of individual structural variant events. They are simply markers on the genome to denote regions within which structural variation has been observed. It may be helpful to think of variant regions as similar to ss-IDs used in dbSNP - they are submitters' assertions concerning the location of variation. Variant region ids are prefixed with ‘nsv’ if the data were accessioned at NCBI, 'esv’ if accessioned at EBI, and 'dsv’ if accessioned at DDBJ.
-
Variant calls (ssv): Variant calls are the individual instances of structural variation observed in a study and are based on the output of raw data analyses. dbVar accepts the following Variant call types:
Variant Call and RegionTypes
| Variant Call Type | Sequence Ontology ID | Variant Region Type |
|---|---|---|
|
complex substitution |
|
complex substitution |
|
copy number gain |
|
copy number variation |
|
copy number loss |
|
copy number variation |
|
copy number variation |
|
copy number variation |
|
deletion |
|
copy number variation |
|
duplication |
|
copy number variation |
|
delins |
|
delins |
|
insertion |
|
insertion |
|
interchromosomal translocation |
|
translocation, complex chromosomal rearrangement |
|
intrachromosomal translocation |
|
translocation, complex chromosomal rearrangement |
|
inversion |
|
inversion |
|
mobile element insertion |
|
mobile element insertion |
|
Alu insertion |
|
mobile element insertion |
|
LINE1 insertion |
|
mobile element insertion |
|
SVA insertion |
|
mobile element insertion |
|
HERV insertion |
|
mobile element insertion |
|
novel sequence insertion |
|
novel sequence insertion |
|
mobile element deletion |
|
mobile element deletion |
|
Alu deletion |
|
mobile element deletion |
|
LINE1 deletion |
|
mobile element deletion |
|
SVA deletion |
|
mobile element deletion |
|
HERV deletion |
|
mobile element deletion |
|
sequence alteration |
|
sequence alteration |
|
short tandem repeat variation |
|
short tandem repeat variation |
|
tandem duplication |
|
tandem duplication |
A variant call is associated with only one analysis. Variant calls at or near the same location may represent data from different individuals, or they can represent variant calls derived from the same sample but as a result of different analyses. Variant call ids are prefixed with ‘nssv’ if the data were accessioned at NCBI, 'essv’ if accessioned at EBI, and 'dssv’ if accessioned at DDBJ. For all studies except curated studies, it is expected that all variant regions (SV) should have at least 1 variant call (SSV).*

Figure 2: SV-SSV Relationships. Two examples illustrating possible relationships between SVs and SSVs. SSVs (blue bars = gains, red bars = losses) are individual, experimentally detected structural variant calls. SVs (black bars) represent the authors’ assertions of variant regions, based on the merging of SSVs. Arrows at the ends of variants represent breakpoint ambiguity (click here for more information on breakpoint ambiguity). Decisions about merging SSV data to create SVs will be based on the level of resolution of both the method and the analysis used to define variants.
A Short Glossary:
Variant region (SV) – a location on a genome assembly, marked by start and stop coordinates, representing a submitter's assertion of a region containing observed structural variation. Variant call (SSV) – a variant call, produced by experimental methods and a subsequent analysis, denoting the location, type, and size of a detected structural variant event. Reference variants – Reference variants (analogous to rs identifiers in dbSNP - e.g., rs1872633) do not currently exist for structural variants. Because the systematic detection of structural variation is still a nascent field, it is not possible to define reference variants based on current data. As detection technology and variant-calling algorithms improve, it may become possible to detect precise breakpoints both reliably and unambiguously, making it feasible to establish a reference structural variant set.
Data Exchange Policy
dbVar operates in close cooperation with the Database of Genomic Variants Archive (DGVa), a sister database at the European Bioinformatics Institute (EBI). dbVar and DGVa both accept data submissions, and use similar data models and submission templates. After regular monthly syncing, dbVar and DGVa contain the same data. After the data has been made public at dbVar and DGVa, it may also be imported by the Database of Genomic Variants (DGV) at the Center for Applied Genomics in Toronto.
IV. How NCBI Displays Variant Data
Capturing Variant Information
Structural Variation (SV) can be complex to represent. Current technologies rarely provide base pair resolution for variant breakpoints. However, there is a core set of data that captures all the necessary information on a variant, including the degree of uncertainty present in the location of breakpoints. This data set includes:
start-stop coordinates: used to define events where breakpoints are known to basepair resolution. For insertions, start=stop, indicating the base immediately prior to the inserted sequence.
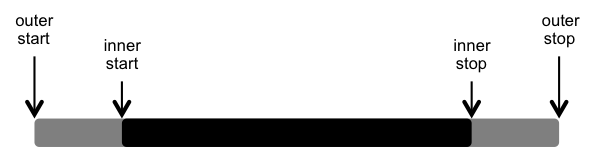
inner start-stop coordinates: used to define regions that are known to be affected by a variant, but do not define the actual breakpoints. The breakpoints lie outside of the defined region.
outer start-stop coordinates: used to define the absolute outer boundary of a variation event but do not define the actual breakpoints. The breakpoints lie inside of the defined region.
allele length: the length of the affected variant. For example, paired-end mapping may identify a 5-kb deletion that is known to reside within a defined 40-kb interval, but its breakpoints are not known. Allele length (in this case, 5 kb) does not have to be exact - approximations are acceptable, depending on the method.
Visual representation of Variants
Displaying uncertainty of breakpoint locations
Displaying the uncertainty in defining the regions depends on the combination of coordinates that are associated with the variant:
Start and stop only: This implies that we have breakpoint resolution and is represented simply:

Inner/outer start/stop: Typical of a probe-based method, but could occur with other methods as well. Inner start/stop define region known to be involved with the event. Outer start/stop define region where breakpoint is likely to occur.
Inner start/stop only: May occur in probe studies, curated studies or historical studies.

Outer start/stop only: Likely to occur with mapping studies, but could show up in other studies as well. Note inward-pointing grey arrows, which indicate that the inner boundaries are not known.
![]()
dbVar Variant rendering
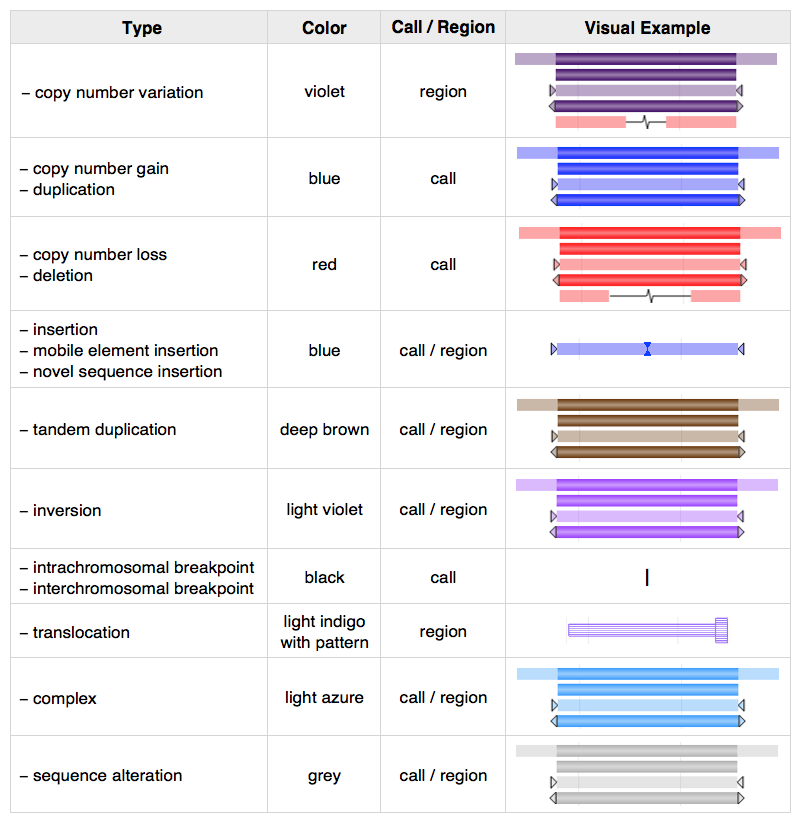
Figure 3: Variant rendering. Variants are visually represented in several places: the Genome View tab of variant pages; the dbVar Genome Browser; and NCBI's Sequence Viewer. Colors distinguish types of structural variant (copy number gain/loss, insertion, inversion, etc.) while breakpoint ambiguity is represented by translucency and/or arrows at variant ends.
V. SV Detection Technology
The first whole genome reports of the extent of structural variation in phenotypically normal humans included those from BAC aCGH [22], representational oligonucleotide microarray analysis (ROMA) [23] and fosmid paired-end mapping (PEM) [24] . Newer technologies include oligo aCGH [7] [25] [26-29], the analysis of SNP genotyping data [7] [12-13] [29-34] , and PEM using next-generation 454 sequencing [27] .
BAC aCGH [35-37], oligo aCGH [37,38] and SNP genotyping analysis [39-41] have also been used to investigate clinical cohorts with unexplained mental retardation and autism.
A number of studies have also used aCGH (see Figure 2) to investigate the copy number of genes in other species, such as mouse [9] [41] , rat [42] and macaque [43] , and between human and other primate species including chimpanzee, bonobo, gorilla, orangutan and macaque in an attempt to define lineage-specific genes that may aid in understanding genome evolution [21] [45-48] .
")
Figure 4: ArrayComparative Genomic Hybridization (aCGH). A test and reference DNA sample are differentially labeled with fluorochromes, commonly Cy3 (green) and Cy5(red), and hybridized to a microarray which can comprise known BAC or oligonucleotide sequences. The ratio of intensities of the two fluorochromes is then analyzed to infer the relative copy numbers of each BAC or oligonucleotide sequence present in each DNA sample.
BAC clone (~150 kb) arrays used for CNV detection include tiling arrays, where overlapping clones cover the majority of the human genome assembly [25][13] [35] [48] , and custom arrays with clones targeted to structural variant regions of the genome that are often not comprehensively represented by the current genome assembly [2] [36] [49] . The major limitation of BAC aCGH is the low resolution (~1 Mb), so the boundaries of the CNVs can not accurately be delineated, the identified region may contain several smaller CNVs and the extent of the CNV is overestimated.
Oligonucleotide (45-85 bp) arrays offer higher resolution than BAC aCGH, and those used for CNV detection include Agilent commercial [21] [50] [26] [28] and CNV-specific custom [21] [26] or targeted to regions of gaps in the human genome assembly [50] , NimbleGen commercial [28-29] and CNV-specific custom[25] [36] , and in house CNV-specific custom arrays [7] . The probe spacing is in the region of 1 probe every 5-6 kb for whole genome arrays and greater than 1 probe every 50 bp for custom arrays.
ROMA aims to reduce the complexity of the genome by PCR of a restriction digest before hybridization and has been used for CNV detection on a NimbleGen custom oligo arrays in human [23] and mouse [51] .
Oligonucleotide SNP arrays used include those from Affymetrix [13] [29-30] [33] [39-41] and Illumina [28] [30-31] [52] with an average probe spacing of 1 probe every 2-6 kb.
Dense SNP genotypes, such as those available for the HapMap samples, can be used to discover segregating deletion variants evident from patterns of null genotypes, Mendelian inconsistencies and Hardy-Weinberg disequilibrium [7] [33] . It is important to note that insertions are not identified by this method. Also, the detection is limited to areas of the genome containing SNPs, while many regions of known structural variation are sparsely covered by SNPs.
Paired-end mapping (PEM) uses the end sequences of BACs, fosmids, and most recently 3kb DNA fragments from the new 454 sequencing technology [25] , to compare to the reference genome (See Figure 3). The advantage of this methodology is that it not only allows identification of insertions and deletions, as seen in aCGH, but also allows detection of balanced translocations and inversions which are not amenable to aCGH, highlighting the importance such sequencing technologies will play in identifying structural variation and facilitating the completion of comprehensive genomes.
")
Figure 5: Paired-end mapping (PEM).
A library of known insert size e.g., 40kb fosmid sequences or 3kb DNA fragments is end sequenced and aligned to a genomic assembly. (A) Ends that map at a similar distance and orientation to the genomic assembly are concordant and do not indicate any structural variation. (B) Ends that map at a distance significantly less than the insert size on the genomic assembly indicate an insertion in the insert relative to the assembly. (C) Ends that map at a distance significantly more than the insert size on the genomic assembly indicate an deletion in the insert relative to the assembly. (D) Ends that map in the same orientation on the genomic assembly indicate an inversion relative to the assembly.
VI. References
- Freeman, J.L. et al. Copy number variation: new insights in genome diversity. Genome Res. 16(8), 949-61 (2006).
- Sharp, A.J. et al. Segmental duplications and copy-number variation in the human genome. Am J Hum Genet 77, 78-88 (2005).
- Lupski, J.R. et al. DNA duplication associated with Charcot-Marie-Tooth disease type 1A. Cell 66, 219-32 (1991).
- Koolen, D.A. et al. A new chromosome 17q21.31 microdeletion syndrome associated with a common inversion polymorphism. Nat Genet 38, 999-1001 (2006).
- Shaw-Smith, C. et al. Microdeletion encompassing MAPT at chromosome 17q21.3 is associated with developmental delay and learning disability. Nat Genet 38, 1032-7 (2006).
- Weiss, L.A. et al. Association between Microdeletion and Microduplication at 16p11.2 and Autism. N Engl J Med (2008).
- Conrad, D.F. et al. A high-resolution survey of deletion polymorphism in the human genome. Nat Genet 38, 75-81 (2006).
- Cooper, G.M. et al. Mutational and selective effects on copy-number variants in the human genome. Nat Genet 39, S22-9 (2007).
- Cutler, G. et al. Significant gene content variation characterizes the genomes of inbred mouse strains. Genome Res 17, 1743-54 (2007).
- Graubert, T.A. et al. A high-resolution map of segmental DNA copy number variation in the mouse genome. PLoS Genet 3, e3 (2007).
- Nguyen, D.Q. et al. Bias of selection on human copy-number variants. PLoS Genet 2, e20 (2006).
- McCarroll, S.A. et al. Common deletion polymorphisms in the human genome. Nat Genet 38, 86-92 (2006).
- Redon, R. et al. Global variation in copy number in the human genome. Nature 444, 444-54 (2006).
- Gonzalez, E. et al. The influence of CCL3L1 gene-containing segmental duplications on HIV-1/AIDS susceptibility. Science 307, 1434-40 (2005).
- Fanciulli, M. et al. FCGR3B copy number variation is associated with susceptibility to systemic, but not organ-specific, autoimmunity. Nat Genet 39, 721-3 (2007).
- Fellermann, K. et al. A chromosome 8 gene-cluster polymorphism with low human beta-defensin 2 gene copy number predisposes to Crohn disease of the colon. Am J Hum Genet 79, 439-48 (2006).
- Hollox, E.J. et al. Psoriasis is associated with increased beta-defensin genomic copy number. Nat Genet 40, 23-5 (2008).
- Huse, K. et al. Genetic Variants of the Copy Number Polymorphic beta-Defensin Locus Are Associated with Sporadic Prostate Cancer. Tumour Biol 29, 83-92 (2008).
- The International HapMap Consortium. The International HapMap Project. Nature 426, 789-96 (2003).
- Sachidanandam, R. et al. A map of human genome sequence variation containing 1.42 million single nucleotide polymorphisms. Nature 409, 928-33 (2001).
- Perry, G.H. et al. Hotspots for copy number variation in chimpanzees and humans. Proc Natl Acad Sci U S A 103, 8006-11 (2006).
- Iafrate, A.J. et al. Detection of large-scale variation in the human genome. Nat Genet 36, 949-51 (2004).
- Sebat, J. et al. Large-scale copy number polymorphism in the human genome. Science 305, 525-8 (2004).
- Tuzun, E. et al. Fine-scale structural variation of the human genome. Nat Genet 37, 727-32 (2005).
- Wong, K.K. et al. A comprehensive analysis of common copy-number variations in the human genome. Am J Hum Genet 80, 91-104 (2007).
- de Smith, A.J. et al. Array CGH analysis of copy number variation identifies 1284 new genes variant in healthy white males: implications for association studies of complex diseases. Hum Mol Genet 16, 2783-94 (2007).
- Korbel, J.O. et al. Paired-end mapping reveals extensive structural variation in the human genome. Science 318, 420-6 (2007).
- Levy, S. et al. The diploid genome sequence of an individual human. PLoS Biol 5, e254 (2007).
- Pinto, D. et al. Copy-number variation in control population cohorts. Hum Mol Genet 16 Spec No. 2, R168-73 (2007).
- Simon-Sanchez, J. et al. Genome-wide SNP assay reveals structural genomic variation, extended homozygosity and cell-line induced alterations in normal individuals. Hum Mol Genet 16, 1-14 (2007).
- Wang, K. et al. PennCNV: an integrated hidden Markov model designed for high-resolution copy number variation detection in whole-genome SNP genotyping data. Genome Res 17, 1665-74 (2007).
- Hinds, D.A. et al. Common deletions and SNPs are in linkage disequilibrium in the human genome. Nat Genet 38, 82-5 (2006).
- Zogopoulos, G. et al. Germ-line DNA copy number variation frequencies in a large North American population. Hum Genet 122, 345-53 (2007).
- Bar-Shira, A. et al. Array-based comparative genome hybridization in clinical genetics. Pediatr Res 60, 353-8 (2006).
- de Vries, B.B. et al. Diagnostic genome profiling in mental retardation. Am J Hum Genet 77, 606-16 (2005).
- Sharp, A.J. et al. Discovery of previously unidentified genomic disorders from the duplication architecture of the human genome. Nat Genet 38, 1038-42 (2006).
- Sharp, A.J. et al. Characterization of a recurrent 15q24 microdeletion syndrome. Hum Mol Genet 16, 567-72 (2007).
- Friedman, J.M. et al. Oligonucleotide microarray analysis of genomic imbalance in children with mental retardation. Am J Hum Genet 79, 500-13 (2006).
- Marshall, C.R. et al. Structural variation of chromosomes in autism spectrum disorder. Am J Hum Genet 82, 477-88 (2008).
- Szatmari, P. et al. Mapping autism risk loci using genetic linkage and chromosomal rearrangements. Nat Genet 39, 319-28 (2007).
- Snijders, A.M. et al. Mapping segmental and sequence variations among laboratory mice using BAC array CGH. Genome Res 15, 302-11 (2005).
- Guryev, V. et al. Distribution and functional impact of DNA copy number variation in the rat. Nat Genet 40, 538-45 (2008).
- Lee, A.S. et al. Analysis of copy number variation in the rhesus macaque genome identifies candidate loci for evolutionary and human disease studies. Hum Mol Genet (2008).
- Fortna, A. et al. Lineage-specific gene duplication and loss in human and great ape evolution. PLoS Biol 2, E207 (2004).
- Goidts, V. et al. Identification of large-scale human-specific copy number differences by inter-species array comparative genomic hybridization. Hum Genet 119, 185-98 (2006).
- Locke, D.P. et al. Large-scale variation among human and great ape genomes determined by array comparative genomic hybridization. Genome Res 13, 347-57 (2003).
- Wilson, G.M. et al. Identification by full-coverage array CGH of human DNA copy number increases relative to chimpanzee and gorilla. Genome Res 16, 173-81 (2006).
- de Stahl, T.D. et al. Profiling of copy number variations (CNVs) in healthy individuals from three ethnic groups using a human genome 32 K BAC-clone-based array. Hum Mutat 29, 398-408 (2007).
- Locke, D.P. et al. Linkage disequilibrium and heritability of copy-number polymorphisms within duplicated regions of the human genome. Am J Hum Genet 79, 275-90 (2006).
- Bovee, D. et al. Closing gaps in the human genome with fosmid resources generated from multiple individuals. Nat Genet 40, 96-101 (2008).
- Egan, C.M. et al. Recurrent DNA copy number variation in the laboratory mouse. Nat Genet 39, 1384-9 (2007).
- Jakobsson, M. et al. Genotype, haplotype and copy-number variation in worldwide human populations. Nature 451, 998-1003 (2008).
- Mills, R.E. et al. An initial map of insertion and deletion (INDEL) variation in the human genome. Genome Res 16, 1182-90 (2006).