A primary economic analysis on the cost-effectiveness of different diagnostic strategies in adults suspected of acute PE will be conducted to address research question 4.
Primary Economic Analysis
A decision-analytic model will be developed to assess the costs and health outcomes associated with diagnostic strategies in patients suspected of acute PE.
In particular, the risk stratification and diagnostic imaging strategies of interest may include the following:
Risk stratification: (i.e., series of clinical decision rules with or without biochemical and/or imaging-based strategies to assign risk of PE)
Clinical decision rule:
Wells score
Geneva rule
If patients are deemed low risk of PE from the clinical decision rules, the following tests may be further conducted:
D-dimer testing
PERC
Diagnostic imaging technologies
CT technologies
MRI technologies
V/Q-based technologies
PET-CT
Thoracic ultrasound (plus echocardiography)
Combinations of the above diagnostic imaging tests
The list above represents the potential diagnostic algorithms that may be compared in the economic analysis. The final diagnostic strategies to be evaluated in the economic analysis will be determined according to the findings of the clinical review.
Model Design
A hybrid model structure will be developed, entailing a decision tree (to capture the implications of the diagnostic strategy) and a subsequent Markov cohort model (to capture the long-term implications of the diagnosis results in terms of initiating and continuing medical treatment).
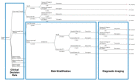
The patient cohort, suspected of PE, will enter the model. The proportion of patients that will subsequently undergo diagnostic imaging will be based on the properties of the risk stratification assessment and the underlying prevalence of PE within the population. Patients who meet the screening criteria will proceed with diagnostic imaging, while patients with a low post-test probability following the risk stratification assessment will not undergo additional imaging. The sensitivity and specificity of each test, or sequence of tests, will affect the diagnosis of PE. Together, the diagnostic accuracy of the risk stratification assessment and diagnostic imaging tests will affect the true- and false-positive and -negative results ().
Sample of Proposed Model Structure on Diagnostic Strategies, Combining Upfront Risk Stratification Strategies and Diagnostic Imaging Test in Adult Patients Suspected of Pulmonary Embolism. PE = pulmonary embolism; PERC = Pulmonary Embolism Rule-Out Criteria. (more...)
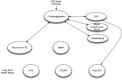
Depending on the outcomes of the diagnostic strategies, patients will enter into a Markov model.67 An existing model that was originally developed to model anticoagulant therapy in patients with VTE will be adapted to reflect PE only. Patients diagnosed with PE will receive treatment, whereas those not diagnosed with PE will receive no treatment.
outlines the structure of the Markov state transition model. Health states in the model included intracranial hemorrhage, severe extracranial or clinically relevant non-major bleeding, recurrent PE, and death.
Conceptual Design of the Markov Component of the Economic Model. CRNM = clinically relevant non-major; CTEPH = chronic thromboembolic pulmonary hypertension; ICH = intracranial hemorrhage, PTS = post-thrombotic syndrome; VTE = venous thromboembolism. (more...)
Based on feedback from the CADTH clinical team and the clinical co-authors, the upfront decision tree for screening will be developed while the downstream pre-existing Markov model for treatment may be further adapted. In addition, clinical experts and members of the Health Technology Expert Review Panel (HTERP) will be consulted as a means of ensuring that the model structure reflects existing clinical literature and Canadian clinical practice. Checks on the internal and external validity of the model will be performed to assess for any logical discrepancies. The decision-analytic model will be constructed in Microsoft Excel 2010.
Perspective
The primary perspective in the model will be that of a publicly funded health care system (i.e., provincial Ministry of Health).
Resource Use and Cost Data
The costs captured will reflect the perspective of the analysis. These costs include those of the diagnostic tests, treatments arising from true or missed diagnosis, and any medical costs related to the treatment of adverse events. Treatment for PE will be based on the patient’s PE diagnosis.
Canadian-specific costs will be used, when available. If unavailable, costs will be estimated from the medical literature and, ideally, from comparable health systems. If necessary, costs will be adjusted to 2016 Canadian dollars, using the health care component of the consumer price index.
Utilities
Utilities associated with each health state will be obtained from the literature and from Canadian sources when possible.
Clinical Parameters
Diagnostic accuracy: The diagnostic accuracy of each strategy (e.g., sensitivity and specificity) will be obtained from the clinical review. Estimates of the rates of adverse events associated with each strategy will similarly be informed from the clinical review.
Natural history: The underlying prevalence of PE will be varied in the analysis. The natural history of patients with PE will be based on an existing economic evaluation.67 The parameters values may be further modified to reflect the findings from the clinical review if they are determined to be more relevant.
Outcomes
The model will estimate the expected costs, quality-adjusted life years (QALYs), correct and missed diagnoses, and the mortality incidences for different combinations of screening and diagnostic strategies for PE over the model time horizon. QALY will be the primary clinical outcome measurement, as this single measure captures the impacts of both morbidity and mortality. The primary results of this model will be the incremental cost-effectiveness ratios (ICERs), measured in terms of the incremental costs per QALY gained, of the diagnostic strategies on the efficiency frontier. A secondary calculation for the ICER, based on the incremental cost per life saved, will also be determined.
Time Horizon and Discounting
As the impact of screening for PE may have long-term treatment consequences depending on a patient’s risk for recurrent events, a lifetime time horizon will be considered. Alternative time horizons will be assessed in sensitivity analyses (e.g., six months).
As per existing guidelines, discounting will be set at 5% per year for both costs and QALYs with sensitivity analysis conducted on this value.68
Sensitivity Analysis
The base-case analysis will represent the probabilistic findings, capturing the impact of parameter uncertainty, with results presented on the cost-effectiveness acceptability curve (CEAC). The CEAC will highlight interventions on the efficiency frontier across different willingness-to-pay thresholds. Uncertainty in the model will be further evaluated in a number of ways. Scenario and subgroup analysis will be performed to evaluate key model assumptions, while retaining the probabilistic element of the model. Potential scenarios and subgroups of interest may include:
Setting: urban, rural or remote communities
Hospital setting: in-patient versus outpatient
Pregnant females
Pretest probability level for PE.
Other analyses to address parameter uncertainty may include varying sets of related inputs (e.g., sensitivity and specificity of diagnostic strategies) or extreme scenarios (e.g., best- and worst-case analysis, threshold scenarios). This may help identify key inputs driving the results of the cost-effectiveness analysis.
Assumptions
During the course of the development of the model, assumptions and limitations will be identified and acknowledged in the report. Where possible, assumptions will be tested through the conduct of appropriate sensitivity analyses.