

NCBI Bookshelf. A service of the National Library of Medicine, National Institutes of Health.
National Guideline Alliance (UK). Cystic Fibrosis: Diagnosis and management. London: National Institute for Health and Care Excellence (NICE); 2017 Oct 25. (NICE Guideline, No. 78.)
I.1. Diagnosis of cystic fibrosis
Not applicable for this review.
I.2. Information and support
Not applicable to this review.
I.3. Service delivery
I.3.1. Service configuration
I.3.1.1. Home-based care
Comparison 1.1: home versus hospital care for the administration of intravenous antibiotics (IV AB) in people with CF experiencing an acute pulmonary exacerbation
.&p=BOOKS&id=535666_appif1.jpg "Click on image to zoom")
Figure 1Lung function: Change in FEV1 % predicted at 21 days follow-up (range of scores: 0–100)
Abbreviations: CI: confidence interval; FEV1: forced expiratory volume in 1 second; IV: inverse variance; SD: standard deviation
.&p=BOOKS&id=535666_appif2.jpg "Click on image to zoom")
Figure 2Lung function: Change in FEV1 % predicted at 18 days follow-up (range of scores: 0–100)
Abbreviations: CI: confidence interval; FEV1: forced expiratory volume in 1 second; IV: inverse variance; SD: standard deviation
.&p=BOOKS&id=535666_appif3.jpg "Click on image to zoom")
Figure 3Lung function: Change in FEV1 % predicted at 15 days follow-up (range of scores: 0–100)
Abbreviations: CI: confidence interval; FEV1: forced expiratory volume in 1 second; IV: inverse variance; SD: standard deviation
%20at%2018%20days%20follow-up.&p=BOOKS&id=535666_appif4.jpg "Click on image to zoom")
Figure 4People starting next course of AB more than 12 weeks after completing the previous course (proxy outcome for time to next exacerbation) at 18 days follow-up
Abbreviations: AB: antibiotics; CI: confidence interval; M-H: Mantel Haenszel;
%20at%2018%20days%20follow-up.&p=BOOKS&id=535666_appif5.jpg "Click on image to zoom")
Figure 5Nutritional status: Change in weight (kg) at 18 days follow-up
Abbreviations: CI: confidence interval; kg: kilograms; IV: inverse variance; SD: standard deviation;
%20at%2010%20days%20post-treatment%20follow-up.&p=BOOKS&id=535666_appif6.jpg "Click on image to zoom")
Figure 6Nutritional status: Change in weight (kg) at 10 days post-treatment follow-up
Abbreviations: CI: confidence interval; kg: kilograms; IV: inverse variance; SD: standard deviation;

Figure 7Nutritional status: Change in BMI at 15 days follow-up
Abbreviations: BMI: body mass index; CI: confidence interval; IV: inverse variance; SD: standard deviation;
%20at%2015%20days%20follow-up%20(range%20of%20scores%3A%200%02013100).&p=BOOKS&id=535666_appif8.jpg "Click on image to zoom")
Figure 8Change in quality of life (CF-QOL) at 15 days follow-up (range of scores: 0–100)
Abbreviations: CI: confidence interval; CF-QOL: cystic fibrosis quality of life questionnaire; IV: inverse variance; SD: standard deviation
Comparison 1.2. Home versus hospital care for the administration of intravenous antibiotics (IV AB) in people with CF and chronic pulmonary infection with P. Aeruginosa
.&p=BOOKS&id=535666_appif9.jpg "Click on image to zoom")
Figure 9Change in FEV1% predicted at 14 days follow-up (range of scores: 0–100)
Abbreviations: CI: confidence interval; FEV1: forced expiratory volume in 1 second; IV: inverse variance; SD: standard deviation
%20at%2014%20days%20follow-up.&p=BOOKS&id=535666_appif10.jpg "Click on image to zoom")
Figure 10Change in weight (kg) at 14 days follow-up
Abbreviations: CI: confidence interval; kg: kilograms; SD: standard deviation; IV: inverse variance
%20at%2014%20days%20follow-up.&p=BOOKS&id=535666_appif11.jpg "Click on image to zoom")
Figure 11Change in weight for height (%) at 14 days follow-up
Abbreviations: CI: confidence interval; IV: inverse variance; SD: standard deviation
I.3.1.2. CF centre care
Comparison 2.1. CF centre care versus shared care
.&p=BOOKS&id=535666_appif12.jpg "Click on image to zoom")
Figure 12Lung function: Change in FEV1 % predicted at 1 year follow-up (range of scores: 0–100)
Abbreviations: CI: confidence interval; FEV1: forced expiratory volume in 1 second; IV: inverse variance; SD: standard deviation
.&p=BOOKS&id=535666_appif13.jpg "Click on image to zoom")
Figure 13Lung function: Change from first to last FEV1 % predicted per year at 3 years follow-up (range of scores: 0–100)
Abbreviations: CI: confidence interval; FEV1: forced expiratory volume in 1 second; IV: inverse variance; SD: standard deviation

Figure 14Lung function: Slope FEV1 % predicted per year at 3 years follow-up
Abbreviations: CI: confidence interval; FEV1: forced expiratory volume in 1 second; IV: inverse variance; SD: standard deviation

Figure 15Nutritional status: Change in BMI at 1 year follow-up
Abbreviations: BMI: body mass index; CI: confidence interval; IV: inverse variance; SD: standard deviation
.&p=BOOKS&id=535666_appif16.jpg "Click on image to zoom")
Figure 16Quality of life: CFQ-R Teen (range of scores: 0–100)
Abbreviations: CI: confidence interval; CFQ-R: cystic fibrosis questionnaire revised; IV: inverse variance; SD: standard deviation.
Note: Cross-sectional study
.&p=BOOKS&id=535666_appif17.jpg "Click on image to zoom")
Figure 17Quality of life: CFQ-R Child (range of scores: 0–100)
Abbreviations: CI: confidence interval; CFQ-R: cystic fibrosis questionnaire revised; IV: inverse variance; SD: standard deviation.
Note: Cross-sectional study
.&p=BOOKS&id=535666_appif18.jpg "Click on image to zoom")
Figure 18Quality of life: CFQ-R Parent (range of scores: 0–100)
Abbreviations: CI: confidence interval; CFQ-R: cystic fibrosis questionnaire revised; IV: inverse variance; SD: standard deviation.
Note: Cross-sectional study
Comparison 2.2. CF centre care versus local care (below CF Trust recommendations)
.&p=BOOKS&id=535666_appif19.jpg "Click on image to zoom")
Figure 19Lung function: Change in FEV1 % predicted at 1 year follow-up (range of scores: 0–100)
Abbreviations: CI: confidence interval; FEV1: forced expiratory volume in 1 second; IV: inverse variance; SD: standard deviation
.&p=BOOKS&id=535666_appif20.jpg "Click on image to zoom")
Figure 20Lung function: Change from first to last FEV1 % predicted per year at 3 years follow-up (range of scores: 0–100)
Abbreviations: CI: confidence interval; FEV1: forced expiratory volume in 1 second; IV: inverse variance; SD: standard deviation
.&p=BOOKS&id=535666_appif21.jpg "Click on image to zoom")
Figure 21Lung function: Slope FEV1 % predicted per year at 3 years follow-up (range of scores: 0–100)
Abbreviations: CI: confidence interval; FEV1: forced expiratory volume in 1 second; IV: inverse variance; SD: standard deviation

Figure 22Nutritional status: Change in BMI at 1 year follow-up
Abbreviations: BMI: body mass index; CI: confidence interval; IV: inverse variance; SD: standard deviation;
Comparison 2.3. CF centre care versus general clinic (non-CF)
Data could not be plotted.
I.3.1.3. Shared care
Comparison 3.1. Local care (below CF Trust Standards) versus shared care (UK equivalent)
.&p=BOOKS&id=535666_appif23.jpg "Click on image to zoom")
Figure 23Lung function: Change in FEV1 % predicted at 1 year follow-up (range of scores: 0–100)
Abbreviations: CI: confidence interval; FEV1: forced expiratory volume in 1 second; IV: inverse variance; SD: standard deviation
.&p=BOOKS&id=535666_appif24.jpg "Click on image to zoom")
Figure 24Lung function: Change from first to last FEV1% predicted per year at 3 years follow-up (range of scores: 0–100)
Abbreviations: CI: confidence interval; FEV1: forced expiratory volume in 1 second; IV: inverse variance; SD: standard deviation

Figure 25Lung function: slope FEV1 % predicted per year at 3 years follow-up
Abbreviations: CI: confidence interval; FEV1: forced expiratory volume in 1 second; IV: inverse variance; SD: standard deviation

Figure 26Nutritional status: Change in BMI at 1 year follow-up
Abbreviations: BMI: body mass index; CI: confidence interval; IV: inverse variance; SD: standard deviation
Comparison 3.2 Shared care (above UK standards) versus shared care (UK equivalent)
.&p=BOOKS&id=535666_appif27.jpg "Click on image to zoom")
Figure 27Lung function: Change from first to last FEV1 % predicted per year at 3 years follow-up (range of scores: 0–100)
Abbreviations: CI: confidence interval; FEV1: forced expiratory volume in 1 second; IV: inverse variance; SD: standard deviation

Figure 28Lung function: slope FEV1 % per year at 3 years follow-up
Abbreviations: CI: confidence interval; FEV1: forced expiratory volume in 1 second; IV: inverse variance; SD: standard deviation
I.3.1.4. Telemedicine
Comparison 4.1. Home monitoring + diary recording versus usual care
.&p=BOOKS&id=535666_appif29.jpg "Click on image to zoom")
Figure 29Lung function: Change in FEV1 % predicted at 4 years follow-up (range of scores: 0–100)
Abbreviations: CI: confidence interval; FEV1: forced expiratory volume in 1 second; IV: inverse variance; SD: standard deviation
Comparison 4.2. Telemedicine versus usual care
Data could not be plotted.
I.3.2. Multidisciplinary teams
Not applicable, as no studies were included in this review.
I.4. Transition
Not applicable to this review.
I.5. Complications of cystic fibrosis
Not applicable to this review.
I.6. Monitoring for pulmonary disease
I.6.1. Review 1. Monitoring for pulmonary disease onset in people with CF without clinical signs or symptoms of lung disease
Comparison 1. Lung function tests versus imaging tests
No forest plots available.
I.6.2. Review 2. Monitoring for evolving pulmonary disease in people with CF with established lung disease
Not applicable, as evidence was found for this review.
I.6.3. Review 3. Monitoring for evolving pulmonary disease in people with CF following an acute pulmonary exacerbation
Comparison 1. Monitoring using bronchoalveolar lavage (BAL) versus standard monitoring
%20at%20age%205%20years.&p=BOOKS&id=535666_appif30.jpg "Click on image to zoom")
Figure 30Lung function – FEV1% predicted (z-scores) at age 5 years
Abbreviations. BAL: bronchoalveolar lavage; CI: confidence interval; FEV1: forced expiratory volume in 1 second; IV: inverse variance; SD: standard deviation. Infants were recruited before age 6 months and followed until age 5 years.

Figure 31Clearance of the organism from the cultures at age 5 years
Abbreviations: BAL: bronchoalveolar lavage; M-H: Mantel-Haenszel; CI: confidence interval. Infants were recruited before age 6 months and followed until age 5 years
%20at%20age%205%20years.&p=BOOKS&id=535666_appif32.jpg "Click on image to zoom")
Figure 32Weight (z-scores) at age 5 years
Abbreviations: BAL: bronchoalveolar lavage; SD: standard deviation; IV: inverse variance; CI: confidence interval. Infants were recruited before age 6 months and followed until age 5 years
%20at%20age%205%20years.&p=BOOKS&id=535666_appif33.jpg "Click on image to zoom")
Figure 33Height (z-scores) at age 5 years
Abbreviations: BAL: bronchoalveolar lavage; CI: confidence interval; IV: inverse variance; SD: standard deviation. Infants were recruited before age 6 months and followed until age 5 years
%20at%20age%205%20years.&p=BOOKS&id=535666_appif34.jpg "Click on image to zoom")
Figure 34BMI (z-scores) at age 5 years
Abbreviations: BAL: bronchoalveolar lavage; BMI: body mass index; CI: confidence interval; IV: inverse variance; SD: standard deviation. Infants were recruited before age 6 months and followed until age 5 years
I.7. Airway clearance techniques
Comparison 1. Manual physiotherapy versus no airway clearance techniques
No evidence was found for this comparison.
Comparison 2. Manual physiotherapy techniques versus oscillating devices
.&p=BOOKS&id=535666_appif35.jpg "Click on image to zoom")
Figure 35Change in FEV1 % predicted after 8.8 days follow-up (range of scores: 0–100)
Abbreviations: CI: confidence interval; FEV1: forced expiratory volume in 1 second; IV: inverse variance; SD: standard deviation
.&p=BOOKS&id=535666_appif36.jpg "Click on image to zoom")
Figure 36Change in FEV1 % predicted at 1 month follow-up (range of scores: 0–100)
Abbreviations: CI: confidence interval; FEV1: forced expiratory volume in 1 second; IV: inverse variance; SD: standard deviation
.&p=BOOKS&id=535666_appif37.jpg "Click on image to zoom")
Figure 37Change in FVC % predicted at 2 weeks follow-up (range of scores: 0–100)
Abbreviations: CI: confidence interval; FVC: forced vital capacity; IV: inverse variance; SD: standard deviation
Comparison 3. Manual physiotherapy versus high frequency chest wall oscillation (HFCWO)
%20at%201%20to%202%20weeks%20follow-up.&p=BOOKS&id=535666_appif38.jpg "Click on image to zoom")
Figure 38Wet sputum weight (g.) at 1 to 2 weeks follow-up
Abbreviations: HFCWO: High Frequency Chest Wall Oscillation; SD: standard deviation; IV: inverse variance; CI: confidence interval
%20at%201%20to%202%20weeks%20follow-up.&p=BOOKS&id=535666_appif39.jpg "Click on image to zoom")
Figure 39Dry sputum weight (g.) at 1 to 2 weeks follow-up
Abbreviations: HFCWO: High Frequency Chest Wall Oscillation; SD: standard deviation; IV: inverse variance; CI: confidence interval
Comparison 4. Positive expiratory pressure mask (PEP) versus no airway clearance technique
%20at%202%20days%20follow-up.&p=BOOKS&id=535666_appif40.jpg "Click on image to zoom")
Figure 40Dry sputum weight (g.) at 2 days follow-up
Abbreviations: SD: standard deviation; IV: inverse variance; CI: confidence interval
%20at%202%20days%20follow-up.&p=BOOKS&id=535666_appif41.jpg "Click on image to zoom")
Figure 41Wet sputum weight (g.) at 2 days follow-up
Abbreviations: SD: standard deviation; IV: inverse variance; CI: confidence interval
.&p=BOOKS&id=535666_appif42.jpg "Click on image to zoom")
Figure 42FEV1 % predicted at 2 days follow-up (range of scores: 0–100)
Abbreviations: CI: confidence interval; FEV1: forced expiratory volume in 1 second; IV: inverse variance; SD: standard deviation
%20at%202%20days%20follow-up.&p=BOOKS&id=535666_appif43.jpg "Click on image to zoom")
Figure 43Change in FEV1 (litres) at 2 days follow-up
Abbreviations: CI: confidence interval; FEV1: forced expiratory volume in 1 second; IV: inverse variance; SD: standard deviation
.&p=BOOKS&id=535666_appif44.jpg "Click on image to zoom")
Figure 44FVC % predicted at 2 days follow-up (range of scores: 0–100)
Abbreviations: CI: confidence interval; FVC: forced vital capacity; IV: inverse variance; SD: standard deviation
%20at%202%20days%20follow-up.&p=BOOKS&id=535666_appif45.jpg "Click on image to zoom")
Figure 45Change in FVC (litres) at 2 days follow-up
Abbreviations: CI: confidence interval; FVC: forced vital capacity; IV: inverse variance; SD: standard deviation
%20at%202%20days%20follow-up.&p=BOOKS&id=535666_appif46.jpg "Click on image to zoom")
Figure 46Oxygen saturation (SpO2) at 2 days follow-up
Abbreviations: SD: standard deviation; IV: inverse variance; CI: confidence interval
Comparison 5. Positive expiratory pressure mask (PEP) versus active cycle of breathing techniques (ACBT)
No evidence was found for this comparison.
Comparison 6. Positive expiratory pressure mask (PEP) versus oscillating devices
%20at%201%20year%20follow-up.&p=BOOKS&id=535666_appif47.jpg "Click on image to zoom")
Figure 47Patient preference (measured as self-withdrawal due to lack of perceived effectiveness) at 1 year follow-up
Abbreviations: PEP: positive expiratory pressure mask; M-H: Mantel-Haenszel; CI: confidence interval
%20at%2013%20months%20follow-up.&p=BOOKS&id=535666_appif48.jpg "Click on image to zoom")
Figure 48Hospitalisations due to respiratory exacerbations (mean number per participant) at 13 months follow-up
Abbreviations: PEP: positive expiratory pressure mask; SD: standard deviation; IV: inverse variance; CI: confidence interval
.&p=BOOKS&id=535666_appif49.jpg "Click on image to zoom")
Figure 49Change in FEV1 % predicted at up to 2 years follow-up (range of scores: 0–100)
Abbreviations: CI: confidence interval; df: degrees of freedom; FEV1: forced expiratory volume in 1 second; IV: inverse variance; PEP: positive expiratory pressure mask; SD: standard deviation
.&p=BOOKS&id=535666_appif50.jpg "Click on image to zoom")
Figure 50FVC % predicted at 2 to 4 weeks follow-up (range of scores: 0–100)
Abbreviations: CI: confidence interval; FVC: forced vital capacity; IV: inverse variance; PEP: positive expiratory pressure mask; SD: standard deviation
.&p=BOOKS&id=535666_appif51.jpg "Click on image to zoom")
Figure 51Change in FVC % predicted at 1 year follow-up (range of scores: 0–100)
Abbreviations: CI: confidence interval; FVC: forced vital capacity; IV: inverse variance; PEP: positive expiratory pressure mask; SD: standard deviation
%20at%201%20year%20follow-up%20(range%20of%20scores%3A%200%02013100).&p=BOOKS&id=535666_appif52.jpg "Click on image to zoom")
Figure 52Change in quality of life (measured with CF-QOL) at 1 year follow-up (range of scores: 0–100)
Abbreviations: CI: confidence interval; CF-QOL: cystic fibrosis quality of life questionnaire; IV: inverse variance; PEP: positive expiratory pressure mask; SD: standard deviation
Comparison 7. Positive expiratory pressure mask (PEP) versus high frequency chest wall oscillation (HFCWO)
%20at%201%20week%20follow-up.&p=BOOKS&id=535666_appif53.jpg "Click on image to zoom")
Figure 53Sputum volume (ml.) at 1 week follow-up
Abbreviations: PEP: positive expiratory pressure mask; HFCWO: high frequency chest wall oscillation; SD: standard deviation; IV: inverse variance; CI: confidence interval
%20at%201%20year%20follow-up.&p=BOOKS&id=535666_appif54.jpg "Click on image to zoom")
Figure 54Pulmonary exacerbations (number of patients) at 1 year follow-up
Abbreviations: PEP: positive expiratory pressure mask; HFCWO: high frequency chest wall oscillation; M-H: Mantel-Haenszel; CI: confidence interval
%20at%201%20year%20follow-up.&p=BOOKS&id=535666_appif55.jpg "Click on image to zoom")
Figure 55Pulmonary exacerbations (patients requiring antibiotics) at 1 year follow-up
Abbreviations: PEP: positive expiratory pressure mask; HFCWO: high frequency chest wall oscillation; M-H: Mantel-Haenszel; CI: confidence interval
.&p=BOOKS&id=535666_appif56.jpg "Click on image to zoom")
Figure 56FEV1 % predicted at 1 week follow-up (range of scores: 0–100)
Abbreviations: CI: confidence interval; df: degrees of freedom; FEV1: forced expiratory volume in 1 second; HFCWO: high frequency chest wall oscillation; IV: inverse variance; PEP: positive expiratory pressure mask; SD: standard deviation
.&p=BOOKS&id=535666_appif57.jpg "Click on image to zoom")
Figure 57FEV1 % predicted at 1 to 2 weeks follow-up (range of scores: 0–100)
Abbreviations: CI: confidence interval; FEV1: forced expiratory volume in 1 second; HFCWO: high frequency chest wall oscillation; IV: inverse variance; PEP: positive expiratory pressure mask; SD: standard deviation
.&p=BOOKS&id=535666_appif58.jpg "Click on image to zoom")
Figure 58Change in FEV1 % predicted at 1 year follow-up (range of scores: 0–100)
Abbreviations: CI: confidence interval; FEV1: forced expiratory volume in 1 second; HFCWO: high frequency chest wall oscillation; IV: inverse variance; PEP: positive expiratory pressure mask; SD: standard deviation
.&p=BOOKS&id=535666_appif59.jpg "Click on image to zoom")
Figure 59FVC % predicted at 1 week follow-up (range of scores: 0–100)
Abbreviations: CI: confidence interval; df: degrees of freedom; FVC: forced vital capacity; HFCWO: high frequency chest wall oscillation; IV: inverse variance; PEP: positive expiratory pressure mask; SD: standard deviation
.&p=BOOKS&id=535666_appif60.jpg "Click on image to zoom")
Figure 60FVC % predicted at 1 to 2 weeks follow-up (range of scores: 0–100)
Abbreviations: CI: confidence interval; FVC: forced vital capacity; HFCWO: high frequency chest wall oscillation; IV: inverse variance; PEP: positive expiratory pressure mask; SD: standard deviation
.&p=BOOKS&id=535666_appif61.jpg "Click on image to zoom")
Figure 61Change in FVC % predicted at 1 year follow-up (range of scores: 0–100)
Abbreviations: CI: confidence interval; FVC: forced vital capacity; HFCWO: high frequency chest wall oscillation; IV: inverse variance; PEP: positive expiratory pressure mask; SD: standard deviation
Comparison 8. Active cycle of breathing technique (ACBT) versus no airway clearance technique
No evidence was retrieved for this comparison.
Comparison 9. Active cycle breathing technique (ACBT) versus autogenic drainage (AD)
No evidence was retrieved for this comparison.
Comparison 10. Autogenic drainage (AD) versus no airway clearance technique
No evidence was retrieved for this comparison.
Comparison 11. Oscillating device versus no airway clearance technique
No evidence was retrieved for this comparison.
Comparison 12. Oscillating device versus high frequency chest wall oscillation (HFCWO)
.&p=BOOKS&id=535666_appif62.jpg "Click on image to zoom")
Figure 62FEV1 % predicted at 2 to 4 weeks follow-up (range of scores: 0–100)
Abbreviations: CI: confidence interval; FEV1: forced expiratory volume in 1 second; HFCWO: high frequency chest wall oscillation; IV: inverse variance; SD: standard deviation
.&p=BOOKS&id=535666_appif63.jpg "Click on image to zoom")
Figure 63FVC % predicted at 2 to 4 weeks follow-up (range of scores: 0–100)
Abbreviations: CI: confidence interval; FVC: forced vital capacity; HFCWO: high frequency chest wall oscillation; IV: inverse variance; SD: standard deviation
Comparison 13. High frequency chest wall oscillation (HFCWO) versus no airway clearance technique
No evidence was found for this comparison.
Comparison 14. Non-invasive ventilation (NIV) versus no airway clearance technique
.&p=BOOKS&id=535666_appif64.jpg "Click on image to zoom")
Figure 64FEV1 % predicted at 6 weeks follow-up (range of scores: 0–100)
Abbreviations: CI: confidence interval; FEV1: forced expiratory volume in 1 second; IV: inverse variance; NIV: non-invasive ventilation; SD: standard deviation;
.&p=BOOKS&id=535666_appif65.jpg "Click on image to zoom")
Figure 65FVC % predicted at 6 weeks follow-up (range of scores: 0–100)
Abbreviations: CI: confidence interval; FVC: forced vital capacity; IV: inverse variance; NIV: non-invasive ventilation; SD: standard deviation

Figure 66Nocturnal oxygen saturation at 6 weeks follow-up
Abbreviations: CI: confidence interval; IV: inverse variance; NIV: non-invasive ventilation; SD: standard deviation
%20at%206%20weeks%20follow-up%20(range%20of%20scores%3A%200%02013100).&p=BOOKS&id=535666_appif67.jpg "Click on image to zoom")
Figure 67Quality of life (CF-QOL questionnaire) at 6 weeks follow-up (range of scores: 0–100)
Abbreviations: CI: confidence interval; CF-QOL: cystic fibrosis quality of life questionnaire; IV: inverse variance; NIV: non-invasive ventilation; SD: standard deviation
I.8. Mucoactive agents
I.8.1. Mannitol
Comparison 1.1. Mannitol versus placebo
.&p=BOOKS&id=535666_appif68.jpg "Click on image to zoom")
Figure 68Lung function: change in FEV1 % predicted at 2 weeks and 2, 4 & 6 months follow-up (range of scores: 0–100)
Abbreviations: CI: confidence interval; FEV1: forced expiratory volume in 1 second; IV: inverse variance; SE: standard error
.&p=BOOKS&id=535666_appif69.jpg "Click on image to zoom")
Figure 69Lung function: change in FEV1 % predicted in children and young people at 2, 4 & 6 months follow-up (range of scores 0–100)
Abbreviations: CI: confidence interval; FEV1: forced expiratory volume in 1 second; IV: inverse variance; SE: standard error
Data was extracted from Cochrane SR Nolan 2015. Data was already pooled for Aitken 2012 and Bilton 2011 studies
.&p=BOOKS&id=535666_appif70.jpg "Click on image to zoom")
Figure 70Lung function: change in FEV1 % predicted in adults at 2, 4 & 6 months follow-up (range of scores 0–100)
Abbreviations: CI: confidence interval; FEV1: forced expiratory volume in 1 second; IV: inverse variance; SE: standard error
Data was extracted from Cochrane SR Nolan 2015. Data was already pooled for Aitken 2012 and Bilton 2011 studies

Figure 71Time to first pulmonary exacerbation at 6 months follow-up
Abbreviations: CI: confidence interval; IV: inverse variance; SE: standard error

Figure 72Number of children and young people with protocol defined exacerbations at 6 months follow-up
Abbreviations: IV: inverse variance; SE: standard error
Data was extracted from Cochrane SR Nolan 2015. Data was already pooled for Aitken 2012 and Bilton 2011 studies

Figure 73Number of adults with protocol defined exacerbations at 6 months follow-up
Abbreviations: IV: inverse variance; SE: standard error
Data was extracted from Cochrane SR Nolan 2015. Data was already pooled for Aitken 2012 and Bilton 2011 studies

Figure 74Number of patients needing additional IV antibiotics at 6 months follow-up
Abbreviations: CI: confidence interval; IV: intravenous; M-H: Mantel-Haenszel
.&p=BOOKS&id=535666_appif75.jpg "Click on image to zoom")
Figure 75Quality of life: change in CFQ-R respiratory at 4 & 6 months follow-up (range of scores: 0–100)
Abbreviations: CI: confidence interval; CFQ-R: cystic fibrosis questionnaire revised; df: degrees of freedom; IV: inverse variance; SD: standard deviation
.&p=BOOKS&id=535666_appif76.jpg "Click on image to zoom")
Figure 76Quality of life: change in CFQ-R vitality at 4 & 6 months follow-up (range of scores: 0–100)
Abbreviations: CI: confidence interval; CFQ-R: cystic fibrosis questionnaire revised; df: degrees of freedom; IV: inverse variance; SD: standard deviation
.&p=BOOKS&id=535666_appif77.jpg "Click on image to zoom")
Figure 77Quality of life: change in CFQ-R physical at 4 & 6 months follow-up (range of scores: 0–100)
Abbreviations: CI: confidence interval; CFQ-R: cystic fibrosis questionnaire revised; df: degrees of freedom; IV: inverse variance; SD: standard deviation
.&p=BOOKS&id=535666_appif78.jpg "Click on image to zoom")
Figure 78Quality of life: change in CFQ-R emotion at 4 & 6 months follow-up (range of scores: 0–100)
Abbreviations: CI: confidence interval; CFQ-R: cystic fibrosis questionnaire revised; df: degrees of freedom; IV: inverse variance; SD: standard deviation
.&p=BOOKS&id=535666_appif79.jpg "Click on image to zoom")
Figure 79Quality of life: change in CFQ-R eating at 4 & 6 months follow-up (range of scores: 0–100)
Abbreviations: CI: confidence interval; CFQ-R: cystic fibrosis questionnaire revised; df: degrees of freedom; IV: inverse variance; SD: standard deviation
.&p=BOOKS&id=535666_appif80.jpg "Click on image to zoom")
Figure 80Quality of life: change in CFQ-R health at 4 & 6 months follow-up (range of scores: 0–100)
Abbreviations: CI: confidence interval; CFQ-R: cystic fibrosis questionnaire revised; df: degrees of freedom; IV: inverse variance; SD: standard deviation
.&p=BOOKS&id=535666_appif81.jpg "Click on image to zoom")
Figure 81Quality of life: change in CFQ-R social at 4 & 6 months follow-up (range of scores: 0–100)
Abbreviations: CI: confidence interval; CFQ-R: cystic fibrosis questionnaire revised; df: degrees of freedom; IV: inverse variance; SD: standard deviation
.&p=BOOKS&id=535666_appif82.jpg "Click on image to zoom")
Figure 82Quality of life: change in CFQ-R body at 4 & 6 months follow-up (range of scores: 0–100)
Abbreviations: CI: confidence interval; CFQ-R: cystic fibrosis questionnaire revised; df: degrees of freedom; IV: inverse variance; SD: standard deviation
.&p=BOOKS&id=535666_appif83.jpg "Click on image to zoom")
Figure 83Quality of life: change in CFQ-R role at 4 & 6 months follow-up (range of scores: 0–100)
Abbreviations: CI: confidence interval; CFQ-R: cystic fibrosis questionnaire revised; df: degrees of freedom; IV: inverse variance; SD: standard deviation
.&p=BOOKS&id=535666_appif84.jpg "Click on image to zoom")
Figure 84Quality of life: change in CFQ-R digestion at 4 & 6 months follow-up (range of scores: 0–100)
Abbreviations: CI: confidence interval; CFQ-R: cystic fibrosis questionnaire revised; df: degrees of freedom; IV: inverse variance; SD: standard deviation
.&p=BOOKS&id=535666_appif85.jpg "Click on image to zoom")
Figure 85Quality of life: change in CFQ-R weight at 4 & 6 months follow-up (range of scores: 0–100)
Abbreviations: CI: confidence interval; CFQ-R: cystic fibrosis questionnaire revised; df: degrees of freedom; IV: inverse variance; SD: standard deviation

Figure 86Adverse events at 2 weeks follow-up
Abbreviations: CI: confidence interval; M-H: Mantel-Haenszel

Figure 87Adverse events at up to 6 months follow-up
Abbreviations: CI: confidence interval; M-H: Mantel-Haenszel

Figure 88Adverse events in children and young people at up to 6 months followup
Abbreviations: IV: inverse variance; SE: standard error
Data was extracted from Cochrane SR Nolan 2015. Data was already pooled for Aitken 2012 and Bilton 2011 studies

Figure 89Adverse events in adults at up to 6 months follow-up
Abbreviations: IV: inverse variance; SE: standard error
Data was extracted from Cochrane SR Nolan 2015. Data was already pooled for Aitken 2012 and Bilton 2011 studies for haemoptysis
Comparison 1.2.1. Mannitol versus Dornase alfa
.&p=BOOKS&id=535666_appif90.jpg "Click on image to zoom")
Figure 90Lung function – FEV1 % change from baseline up to 3 months (range of scores: 0–100)
Abbreviations: CI: confidence interval; FEV1: forced expiratory volume in 1 second; IV: inverse variance; SE: standard error
Comparison 1.2.2. Mannitol + Dornase alfa versus Dornase alfa alone
.&p=BOOKS&id=535666_appif91.jpg "Click on image to zoom")
Figure 91Lung function – FEV1 % change from baseline up to 3 months (range of scores: 0–100)
Abbreviations: CI: confidence interval; FEV1: forced expiratory volume in 1 second; IV: inverse variance; SE: standard error
Comparison 1.3: Mannitol versus nebulised sodium chloride
No evidence was found for this comparison.
Comparison 1.4. Mannitol versus acetylcysteine
No evidence was found for this comparison.
I.8.2. Dornase alfa
Comparison 2.1. Dornase alfa versus placebo
.&p=BOOKS&id=535666_appif92.jpg "Click on image to zoom")
Figure 92Lung function: relative mean % change in FEV1 at 10 days; and at 1, 3 & 6 months follow-up (range of scores: 0–100)
Abbreviations: CI: confidence interval; df: degrees of freedom; FEV1: forced expiratory volume in 1 second; IV: inverse variance; SD: standard deviation.
Note: See sensitivity analysis
%20(subgroup%20analysis%20based%20on%20disease%20severity).&p=BOOKS&id=535666_appif93.jpg "Click on image to zoom")
Figure 93Lung function: relative mean % change in FEV1 at 1 month follow-up (range of scores: 0–100) (subgroup analysis based on disease severity)
Abbreviations: CI: confidence interval; df: degrees of freedom; FEV1: forced expiratory volume in 1 second; IV: inverse variance; SD: standard deviation
%20(subgroup%20analysis%3A%20participants%20with%20acute%20exacerbation).&p=BOOKS&id=535666_appif94.jpg "Click on image to zoom")
Figure 94Lung function: mean % change in FEV1 at 1 month follow-up (range of scores: 0–100) (subgroup analysis: participants with acute exacerbation)
Abbreviations: CI: confidence interval; FEV1: forced expiratory volume in 1 second; IV: inverse variance; SD: standard deviation
.&p=BOOKS&id=535666_appif95.jpg "Click on image to zoom")
Figure 95Lung function: absolute mean % change in FEV1 at 2 years (range of scores: 0–100)
Abbreviations: CI: confidence interval; FEV1: forced expiratory volume in 1 second; IV: inverse variance; SD: standard deviation

Figure 96Number of people experiencing exacerbations at 6 months & 2 years follow-up
Abbreviations: CI: confidence interval; M-H: Mantel-Haenszel

Figure 97Number of days of IV antibiotics use at 1 month follow-up
Abbreviations: CI: confidence interval; IV antibiotics: intravenous antibiotics; IV: inverse variance; SD: standard deviation

Figure 98Adverse events: haemoptysis at 1 & 6 months follow-up
Abbreviations: CI: confidence interval; M-H: Mantel-Haenszel

Figure 99Adverse events: voice alteration at 1, 3, 6 months and 2 years follow-up
Abbreviations: CI: confidence interval; M-H: Mantel-Haenszel
%20at%203%20months%20(range%20of%20scores%3A%200%02013100).&p=BOOKS&id=535666_appif100.jpg "Click on image to zoom")
Figure 100Quality of life (measured with CFQ-R) at 3 months (range of scores: 0–100)
Abbreviations: CI: confidence interval; CFQ-R: cystic fibrosis questionnaire revised; IV: inverse variance; SD: standard deviation
Comparison 2.2. Dornase alfa versus nebulized sodium chloride

Figure 101Lung function: mean % change in FEV1 at 3 weeks and 3 months followup
Abbreviations: CI: confidence interval; CFQ-R: cystic fibrosis questionnaire revised; IV: inverse variance; NaCl (HS): sodium chloride (hypertonic saline); SE: standard error

Figure 102Number of days of inpatient treatment at 3 months follow-up
Abbreviations: CI: confidence interval; IV: inverse variance; NaCl (HS): sodium chloride (hypertonic saline); SE: standard error
Comparison 2.3. Dornase alfa versus acetylcysteine
No evidence was found for this comparison.
I.8.3. Nebulised sodium chloride
Comparison 3.1. Nebulised sodium chloride (> 3% concentration) versus placebo (0.9% to 0.12%) or low-concentration (≤ 3%)

Figure 103Failed to regain pre-exacerbation FEV1% predicted at hospital discharge
Abbreviations: CI: confidence interval; M-H: Mantel-Haenszel. Note: Length of hospital stay was 12 days for the intervention group, and 13 days for the control group. Pre-exacerbation FEV1% predicted was measured ≈ 6 months before.
.&p=BOOKS&id=535666_appif104.jpg "Click on image to zoom")
Figure 104Lung function: % change in FEV1 at 2, 4, 12, 24, 36 & 48 weeks follow-up (range of scores: 0–100)
Abbreviations: CI: confidence interval; FEV1: forced expiratory volume in 1 second; IV: inverse variance; SD: standard deviation

Figure 105Time to next pulmonary exacerbation at 1 year follow-up
Abbreviations: CI: confidence interval; IV: inverse variance; SE: standard error

Figure 106Number of days of treatment for a pulmonary exacerbation at 48 weeks follow-up
Abbreviations: CI: confidence interval; IV: inverse variance; SE: standard error
%20following%20treatment%20(range%20of%20scores%3A%200%02013100).&p=BOOKS&id=535666_appif107.jpg "Click on image to zoom")
Figure 107Change in quality of life (CF-QOL) following treatment (range of scores: 0–100)
Abbreviations: CI: confidence interval; CF-QOL:: cystic fibrosis quality of life questionnaire; IV: inverse variance; SD: standard deviation
%2C%20at%204%20weeks%20follow-up%20(range%20of%20scores%3A%200%02013100).&p=BOOKS&id=535666_appif108.jpg "Click on image to zoom")
Figure 108Change in quality of life (CFQ-R), at 4 weeks follow-up (range of scores: 0–100)
Abbreviations: CI: confidence interval; CFQ-R: cystic fibrosis questionnaire revised; IV: inverse variance; SE: standard error
%20at%2048%20weeks%20follow-up%20(range%20of%20scores%3A%200%02013100).&p=BOOKS&id=535666_appif109.jpg "Click on image to zoom")
Figure 109Change in quality of life (CFQ-R) at 48 weeks follow-up (range of scores: 0–100)
Abbreviations: CI: confidence interval; CFQ-R: cystic fibrosis questionnaire revised; IV: inverse variance; SD: standard deviation
.&p=BOOKS&id=535666_appif110.jpg "Click on image to zoom")
Figure 110Change in quality of life: CFQ-R respiratory domain, at 48 weeks followup (range of scores: 0–100)
Abbreviations: CI: confidence interval; CFQ-R: cystic fibrosis questionnaire revised; IV: inverse variance; SE: standard error
Comparison 3.2. Nebulised sodium chloride versus acetylcysteine
No evidence was found for this comparison.
I.8.4. Acetylcysteine
Comparison 4. Acetylcysteine versus placebo
.&p=BOOKS&id=535666_appif111.jpg "Click on image to zoom")
Figure 111Lung function: change in FEV1 % predicted at 4 weeks (range of scores: 0–100)
Abbreviations: CI: confidence interval; IV: inverse variance; SE: standard error
.&p=BOOKS&id=535666_appif112.jpg "Click on image to zoom")
Figure 112Lung function: change in FEV1 % predicted at 12 and 24 weeks (range of scores: 0–100)
Abbreviations: CI: confidence interval; IV: inverse variance; SE: standard error

Figure 113Inflammatory markers: IL-8 at 24 weeks
Abbreviations: CI: confidence interval; IV: inverse variance; SE: standard error

Figure 114Incidence of pulmonary exacerbations at 24 weeks
Abbreviations: CI: confidence interval; M-H: Mantel-Haenszel
.&p=BOOKS&id=535666_appif115.jpg "Click on image to zoom")
Figure 115Quality of life: QFQ-R respiratory at 24 weeks (range of scores: 0–100)
Abbreviations: CI: confidence interval; CFQ-R: cystic fibrosis questionnaire revised; IV: inverse variance; SE: standard error
I.9. Pulmonary infection – prophylaxis
Comparison 1. Continuous oral flucloxacillin versus antibiotics as required

Figure 116Number of children from whom S. Aureus was identified at least once during 3 years follow-up
Abbreviations: CI: confidence interval; M-H: Mantel-Haenszel
%20during%203%20years%20follow-up.&p=BOOKS&id=535666_appif117.jpg "Click on image to zoom")
Figure 117Number of children admitted to hospital due to pulmonary exacerbations (annualised rates) during 3 years follow-up
Abbreviations: CI: confidence interval; df: degrees of freedom; M-H: Mantel-Haenszel

Figure 118Number of children in whom P. aeruginosa was identified during 3 years follow-up
Abbreviations: CI: confidence interval; df: degrees of freedom; M-H: Mantel-Haenszel
Comparison 2. Continuous oral Cephalexin versus antibiotics as required

Figure 119Number of children from whom S. aureus was identified at least once during 6 years follow-up
Abbreviations: CI: confidence interval; M-H: Mantel-Haenszel
%20at%206%20years%20follow-up.&p=BOOKS&id=535666_appif120.jpg "Click on image to zoom")
Figure 120FEV1 (litres) at 6 years follow-up
Abbreviations: CI: confidence interval; FEV1: forced expiratory volume in 1 second; IV: inverse variance; SD: standard deviation
%20during%206%20years%20follow-up.&p=BOOKS&id=535666_appif121.jpg "Click on image to zoom")
Figure 121Pulmonary exacerbations (%) during 6 years follow-up
Abbreviations: CI: confidence interval; IV: inverse variance; SD: standard deviation;
%20during%206%20years%20follow-up.&p=BOOKS&id=535666_appif122.jpg "Click on image to zoom")
Figure 122Number of children admitted to hospital due to pulmonary exacerbations (annualised rates) during 6 years follow-up
Abbreviations: CI: confidence interval; M-H: Mantel-Haenszel

Figure 123Minor adverse events during 6 years follow-up
Abbreviations: CI: confidence interval; IV: inverse variance; SD: standard deviation

Figure 124Number of children in whom P. Aeruginosa was identified at 1 to 6 years follow-up
Abbreviations: CI: confidence interval; M-H: Mantel-Haenszel
I.10. Pulmonary infection – acute
I.10.1. Pseudomonas aeruginosa
I.10.1.1. Antimicrobial treatment for pulmonary exacerbations due to P. aeruginosa
Comparison 1. Single IV antibiotic versus single IV antibiotic
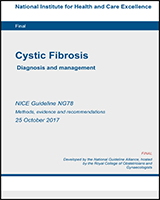
![Figure 125. FEV1 litres (absolute change) at end of 2 week course [ceftazidime versus aztreonam].](/core/lw/2.0/html/tileshop_pmc/tileshop_pmc_inline.html?title=Figure%20125.%20FEV1%20litres%20(absolute%20change)%20at%20end%20of%202%20week%20course%20%5Bceftazidime%20versus%20aztreonam%5D.&p=BOOKS&id=535666_appif125.jpg "Click on image to zoom")
Figure 125FEV1 litres (absolute change) at end of 2 week course [ceftazidime versus aztreonam]
Abbreviations: CI: confidence interval; df: degrees of freedom; FEV1: forced expiratory volume in 1 second; IV: inverse variance; SD: standard deviation
Comparison 2. Single IV antibiotic (with placebo) versus combination IV
![Figure 126. FEV1 % predicted (absolute change) at 10 days follow-up (range of scores: 0–100) [Tobramycin + placebo versus tobramycin + ceftazidime].](/core/lw/2.0/html/tileshop_pmc/tileshop_pmc_inline.html?title=Figure%20126.%20FEV1%20%25%20predicted%20(absolute%20change)%20at%2010%20days%20follow-up%20(range%20of%20scores%3A%200%02013100)%20%5BTobramycin%20%2B%20placebo%20versus%20tobramycin%20%2B%20ceftazidime%5D.&p=BOOKS&id=535666_appif126.jpg "Click on image to zoom")
Figure 126FEV1 % predicted (absolute change) at 10 days follow-up (range of scores: 0–100) [Tobramycin + placebo versus tobramycin + ceftazidime]
Abbreviations: CI: confidence interval; FEV1: forced expiratory volume in 1 second; IV: inverse variance (at the top of the plot) or intravenous (at the bottom of the plot); SD: standard deviation
![Figure 127. FEV1 % predicted (relative change) at end of 2 weeks course (range of scores: 0–100) [tobramycin + placebo versus tobramycin + piperacillin (different regimens)].](/core/lw/2.0/html/tileshop_pmc/tileshop_pmc_inline.html?title=Figure%20127.%20FEV1%20%25%20predicted%20(relative%20change)%20at%20end%20of%202%20weeks%20course%20(range%20of%20scores%3A%200%02013100)%20%5Btobramycin%20%2B%20placebo%20versus%20tobramycin%20%2B%20piperacillin%20(different%20regimens)%5D.&p=BOOKS&id=535666_appif127.jpg "Click on image to zoom")
Figure 127FEV1 % predicted (relative change) at end of 2 weeks course (range of scores: 0–100) [tobramycin + placebo versus tobramycin + piperacillin (different regimens)]
Abbreviations: AB: antibiotics; CI: confidence interval; FEV1: forced expiratory volume in 1 second; IV: inverse variance (at the top of the plot) or intravenous (at the bottom of the plot); SD: standard deviation
![Figure 128. Adverse effects: sensitivity reaction at end of 2 weeks course [tobramycin + placebo versus tobramycin + piperacillin (all regimens)].](/core/lw/2.0/html/tileshop_pmc/tileshop_pmc_inline.html?title=Figure%20128.%20Adverse%20effects%3A%20sensitivity%20reaction%20at%20end%20of%202%20weeks%20course%20%5Btobramycin%20%2B%20placebo%20versus%20tobramycin%20%2B%20piperacillin%20(all%20regimens)%5D.&p=BOOKS&id=535666_appif128.jpg "Click on image to zoom")
Figure 128Adverse effects: sensitivity reaction at end of 2 weeks course [tobramycin + placebo versus tobramycin + piperacillin (all regimens)]
Abbreviations: AB: antibiotics; CI: confidence interval; IV: intravenous; M-H: Mantel-Haenszel
![Figure 129. Adverse effects: number of hospital admissions due to tinnitus during 10 day course [tobramycin + placebo versus ceftazidime + tobramycin].](/core/lw/2.0/html/tileshop_pmc/tileshop_pmc_inline.html?title=Figure%20129.%20Adverse%20effects%3A%20number%20of%20hospital%20admissions%20due%20to%20tinnitus%20during%2010%20day%20course%20%5Btobramycin%20%2B%20placebo%20versus%20ceftazidime%20%2B%20tobramycin%5D.&p=BOOKS&id=535666_appif129.jpg "Click on image to zoom")
Figure 129Adverse effects: number of hospital admissions due to tinnitus during 10 day course [tobramycin + placebo versus ceftazidime + tobramycin]
Abbreviations: AB: antibiotics; CI: confidence interval; IV: intravenous; M-H: Mantel-Haenszel;
![Figure 130. Adverse effects: adverse effects (serum concentrations) during 10 day course [tobramycin + placebo versus ceftazidime + tobramycin].](/core/lw/2.0/html/tileshop_pmc/tileshop_pmc_inline.html?title=Figure%20130.%20Adverse%20effects%3A%20adverse%20effects%20(serum%20concentrations)%20during%2010%20day%20course%20%5Btobramycin%20%2B%20placebo%20versus%20ceftazidime%20%2B%20tobramycin%5D.&p=BOOKS&id=535666_appif130.jpg "Click on image to zoom")
Figure 130Adverse effects: adverse effects (serum concentrations) during 10 day course [tobramycin + placebo versus ceftazidime + tobramycin]
Abbreviations: AB: antibiotics; CI: confidence interval; IV: inverse variance; IV AB: intravenous antibiotics; SD: standard deviation
Comparison 3. Single IV antibiotic versus combination IV antibiotic for pulmonary exacerbations with PA
![Figure 131. FEV1 (relative change) at 10 to 14 days follow-up (range of scores: 0–100) [ceftazidime versus tobramycin & ticarcillin].](/core/lw/2.0/html/tileshop_pmc/tileshop_pmc_inline.html?title=Figure%20131.%20FEV1%20(relative%20change)%20at%2010%20to%2014%20days%20follow-up%20(range%20of%20scores%3A%200%02013100)%20%5Bceftazidime%20versus%20tobramycin%20%26%20ticarcillin%5D.&p=BOOKS&id=535666_appif131.jpg "Click on image to zoom")
Figure 131FEV1 (relative change) at 10 to 14 days follow-up (range of scores: 0–100) [ceftazidime versus tobramycin & ticarcillin]
Abbreviations: AB: antibiotics; CI: confidence interval; FEV1: forced expiratory volume in 1 second; IV: inverse variance; IV AB: intravenous antibiotics; SD: standard deviation
![Figure 132. FEV1 ml (absolute change) at 12 days follow-up [colistin versus colistin + “other”].](/core/lw/2.0/html/tileshop_pmc/tileshop_pmc_inline.html?title=Figure%20132.%20FEV1%20ml%20(absolute%20change)%20at%2012%20days%20follow-up%20%5Bcolistin%20versus%20colistin%20%2B%20%0201Cother%0201D%5D.&p=BOOKS&id=535666_appif132.jpg "Click on image to zoom")
Figure 132FEV1 ml (absolute change) at 12 days follow-up [colistin versus colistin + “other”]
Abbreviations: AB: antibiotics; CI: confidence interval; FEV1: forced expiratory volume in 1 second; IV: inverse variance; IV AB: intravenous antibiotics; SD: standard deviation
![Figure 133. FEV1 % predicted (absolute change) at 14 days follow-up (range of scores: 0–100) [ceftazidime versus tobramycin + piperacillin].](/core/lw/2.0/html/tileshop_pmc/tileshop_pmc_inline.html?title=Figure%20133.%20FEV1%20%25%20predicted%20(absolute%20change)%20at%2014%20days%20follow-up%20(range%20of%20scores%3A%200%02013100)%20%5Bceftazidime%20versus%20tobramycin%20%2B%20piperacillin%5D.&p=BOOKS&id=535666_appif133.jpg "Click on image to zoom")
Figure 133FEV1 % predicted (absolute change) at 14 days follow-up (range of scores: 0–100) [ceftazidime versus tobramycin + piperacillin]
Abbreviations: AB: antibiotics; CI: confidence interval; FEV1: forced expiratory volume in 1 second; IV: inverse variance; IV AB: intravenous antibiotics; SD: standard deviation
![Figure 134. Eradication: number of people in whom pseudomonas isolates were eradicated at end of course at 10 days follow-up [piperacillin versus piperacillin & tobramycin].](/core/lw/2.0/html/tileshop_pmc/tileshop_pmc_inline.html?title=Figure%20134.%20Eradication%3A%20number%20of%20people%20in%20whom%20pseudomonas%20isolates%20were%20eradicated%20at%20end%20of%20course%20at%2010%20days%20follow-up%20%5Bpiperacillin%20versus%20piperacillin%20%26%20tobramycin%5D.&p=BOOKS&id=535666_appif134.jpg "Click on image to zoom")
Figure 134Eradication: number of people in whom pseudomonas isolates were eradicated at end of course at 10 days follow-up [piperacillin versus piperacillin & tobramycin]
Abbreviations: AB: antibiotics; CI: confidence interval; IV: intravenous; M-H: Mantel-Haenszel;
![Figure 135. Time to readmission (in months) at 24 to 26 months follow-up [ceftazidime versus tobramycin + piperacillin].](/core/lw/2.0/html/tileshop_pmc/tileshop_pmc_inline.html?title=Figure%20135.%20Time%20to%20readmission%20(in%20months)%20at%2024%20to%2026%20months%20follow-up%20%5Bceftazidime%20versus%20tobramycin%20%2B%20piperacillin%5D.&p=BOOKS&id=535666_appif135.jpg "Click on image to zoom")
Figure 135Time to readmission (in months) at 24 to 26 months follow-up [ceftazidime versus tobramycin + piperacillin]
Abbreviations: AB: antibiotics; CI: confidence interval; IV: inverse variance; IV AB: intravenous antibiotics; SD: standard deviation
![Figure 136. Number of admissions requiring IV antibiotics or death at 3 months follow-up [ceftazidime versus tobramycin & ticarcillin] (follow-up 3 months).](/core/lw/2.0/html/tileshop_pmc/tileshop_pmc_inline.html?title=Figure%20136.%20Number%20of%20admissions%20requiring%20IV%20antibiotics%20or%20death%20at%203%20months%20follow-up%20%5Bceftazidime%20versus%20tobramycin%20%26%20ticarcillin%5D%20(follow-up%203%20months).&p=BOOKS&id=535666_appif136.jpg "Click on image to zoom")
Figure 136Number of admissions requiring IV antibiotics or death at 3 months follow-up [ceftazidime versus tobramycin & ticarcillin] (follow-up 3 months)
Abbreviations: AB: antibiotics; CI: confidence interval; IV: intravenous; M-H: Mantel-Haenszel
![Figure 137. Mortality at 4 months follow-up [Single IV AB versus combination IV AB].](/core/lw/2.0/html/tileshop_pmc/tileshop_pmc_inline.html?title=Figure%20137.%20Mortality%20at%204%20months%20follow-up%20%5BSingle%20IV%20AB%20versus%20combination%20IV%20AB%5D.&p=BOOKS&id=535666_appif137.jpg "Click on image to zoom")
Figure 137Mortality at 4 months follow-up [Single IV AB versus combination IV AB]
Abbreviations: AB: antibiotics; CI: confidence interval; IV: intravenous; M-H: Mantel-Haenszel;
![Figure 138. Adverse events at 14 days follow-up [single IV versus combination IV AB].](/core/lw/2.0/html/tileshop_pmc/tileshop_pmc_inline.html?title=Figure%20138.%20Adverse%20events%20at%2014%20days%20follow-up%20%5Bsingle%20IV%20versus%20combination%20IV%20AB%5D.&p=BOOKS&id=535666_appif138.jpg "Click on image to zoom")
Figure 138Adverse events at 14 days follow-up [single IV versus combination IV AB]
Abbreviations: AB: antibiotics; CI: confidence interval; IV: intravenous; M-H: Mantel-Haenszel
![Figure 139. Adverse events: renal toxicity at 12 days follow-up [colistin versus combination other anti-pseudomonal antibiotic].](/core/lw/2.0/html/tileshop_pmc/tileshop_pmc_inline.html?title=Figure%20139.%20Adverse%20events%3A%20renal%20toxicity%20at%2012%20days%20follow-up%20%5Bcolistin%20versus%20combination%20other%20anti-pseudomonal%20antibiotic%5D.&p=BOOKS&id=535666_appif139.jpg "Click on image to zoom")
Figure 139Adverse events: renal toxicity at 12 days follow-up [colistin versus combination other anti-pseudomonal antibiotic]
Abbreviations: AB: antibiotics; CI: confidence interval; IV: inverse variance; IV AB: intravenous antibiotics; SD: standard deviation
Comparison 4. Combination IV antibiotics versus combination IV antibiotics for pulmonary exacerbations
![Figure 140. Eradication of pathogen at 2 weeks follow-up [aztreonam + amikacin versus ceftazidime + amikacin].](/core/lw/2.0/html/tileshop_pmc/tileshop_pmc_inline.html?title=Figure%20140.%20Eradication%20of%20pathogen%20at%202%20weeks%20follow-up%20%5Baztreonam%20%2B%20amikacin%20versus%20ceftazidime%20%2B%20amikacin%5D.&p=BOOKS&id=535666_appif140.jpg "Click on image to zoom")
Figure 140Eradication of pathogen at 2 weeks follow-up [aztreonam + amikacin versus ceftazidime + amikacin]
Abbreviations: aztreo: aztreonam; amika: amikacin; M-H: Mantel-Haenszel; CI: confidence interval
![Figure 141. FEV1 % predicted (absolute change) at 2 weeks follow-up (range of scores: 0–100) [IV combination A vs IV combination B].](/core/lw/2.0/html/tileshop_pmc/tileshop_pmc_inline.html?title=Figure%20141.%20FEV1%20%25%20predicted%20(absolute%20change)%20at%202%20weeks%20follow-up%20(range%20of%20scores%3A%200%02013100)%20%5BIV%20combination%20A%20vs%20IV%20combination%20B%5D.&p=BOOKS&id=535666_appif141.jpg "Click on image to zoom")
Figure 141FEV1 % predicted (absolute change) at 2 weeks follow-up (range of scores: 0–100) [IV combination A vs IV combination B]
Abbreviations: amika: amikacin; ceft: ceftazidime; CI: confidence interval; FEV1: forced expiratory volume in 1 second; IV: inverse variance; SD: standard deviation
![Figure 142. FEV1 % predicted (relative change) at 2 weeks follow-up (range of scores: 0–100) [meropenem + obramycin versus ceftazidime + tobramycin].](/core/lw/2.0/html/tileshop_pmc/tileshop_pmc_inline.html?title=Figure%20142.%20FEV1%20%25%20predicted%20(relative%20change)%20at%202%20weeks%20follow-up%20(range%20of%20scores%3A%200%02013100)%20%5Bmeropenem%20%2B%20obramycin%20versus%20ceftazidime%20%2B%20tobramycin%5D.&p=BOOKS&id=535666_appif142.jpg "Click on image to zoom")
Figure 142FEV1 % predicted (relative change) at 2 weeks follow-up (range of scores: 0–100) [meropenem + obramycin versus ceftazidime + tobramycin]
Abbreviations: CI: confidence interval; FEV1: forced expiratory volume in 1 second; IV: inverse variance; SD: standard deviation; tob: tobramycin

Figure 143Adverse effects at 2 weeks follow-up [aztreonam + amikacin versus ceftazidime + amikacin
Abbreviations: ami: amikacin; CI: confidence interval; M-H: Mantel-Haenszel;
Comparison 5. Two IV antibiotics + inhaled antibiotic versus 2 IV without inhaled antibiotic
![Figure 144. Eradication of P. aeruginosa at 15 days follow-up [IV ceftazidime + IV amikacin + inhaled amikacin versus IV ceftazidime + IV amikacin].](/core/lw/2.0/html/tileshop_pmc/tileshop_pmc_inline.html?title=Figure%20144.%20Eradication%20of%20P.%20aeruginosa%20at%2015%20days%20follow-up%20%5BIV%20ceftazidime%20%2B%20IV%20amikacin%20%2B%20inhaled%20amikacin%20versus%20IV%20ceftazidime%20%2B%20IV%20amikacin%5D.&p=BOOKS&id=535666_appif144.jpg "Click on image to zoom")
Figure 144Eradication of P. aeruginosa at 15 days follow-up [IV ceftazidime + IV amikacin + inhaled amikacin versus IV ceftazidime + IV amikacin]
Abbreviations: CI: confidence interval; IV: intravenous; M-H: Mantel-Haenszel; w/o: without
![Figure 145. Adverse effects: raised liver transaminases at 4 to 6 weeks follow-up [IV ceftazidime + IV amikacin + inhaled amikacin versus IV ceftazidime + IV amikacin].](/core/lw/2.0/html/tileshop_pmc/tileshop_pmc_inline.html?title=Figure%20145.%20Adverse%20effects%3A%20raised%20liver%20transaminases%20at%204%20to%206%20weeks%20follow-up%20%5BIV%20ceftazidime%20%2B%20IV%20amikacin%20%2B%20inhaled%20amikacin%20versus%20IV%20ceftazidime%20%2B%20IV%20amikacin%5D.&p=BOOKS&id=535666_appif145.jpg "Click on image to zoom")
Figure 145Adverse effects: raised liver transaminases at 4 to 6 weeks follow-up [IV ceftazidime + IV amikacin + inhaled amikacin versus IV ceftazidime + IV amikacin]
Abbreviations: CI: confidence interval; IV: intravenous; M-H: Mantel-Haenszel; w/o: without
Comparison 6. IV ceftazidime + IV tobramycin versus oral ciprofloxacin

Figure 146Eradication of P. aeruginosa at 2 weeks follow-up
Abbreviations: ceft: ceftazidime; CI: confidence interval; IV: intravenous; M-H: Mantel-Haenszel; tob: tobramycin

Figure 147Adverse effects - Treatment-related events at 2 weeks follow-up
Abbreviations: ceft: ceftazidime; CI: confidence interval; cipro: ciprofloxacin; IV: intravenous; M-H: MantelHaenszel; tob: tobramycin
I.10.1.2. Antimicrobial treatment for acute infection with P. aeruginosa
Comparison 7. Oral ciprofloxacin + inhaled colistin versus inhaled tobramycin

Figure 148Adverse events: severe cough at 3 months follow-up
Abbreviations: CI: confidence interval; M-H: Mantel-Haenszel
Comparison 8. Inhaled colistin + oral ciprofloxacin versus inhaled tobramycin + oral ciprofloxacin
.&p=BOOKS&id=535666_appif149.jpg "Click on image to zoom")
Figure 149Relative change in % predicted FEV1 from baseline at 54 days follow-up (range of scores: 0–100)
Abbreviations: CI: confidence interval; cipro: ciprofloxacin; FEV1: forced expiratory volume in 1 second; IV: inverse variance; SD: standard deviation

Figure 150Treatment failure - trial discontinuation due to lack of compliance at 28 days follow-up
Abbreviations: CI: confidence interval; M-H: Mantel-Haenszel;

Figure 151Adverse effects at 28 days follow-up
Abbreviations: CI: confidence interval; cipro: ciprofloxacin; M-H: Mantel-Haenszel
I.10.2. Staphylococcus aureus
Not applicable, as no studies were identified for inclusion.
I.10.3. Burkholderia cepacia complex
Not applicable, as no studies were identified for inclusion.
I.10.4. Non-tuberculous mycobacteria
Not applicable, as no studies were identified for inclusion.
I.10.5. Non-identified pathogen
Not applicable, as no studies were identified for inclusion.
I.11. Pulmonary infection – chronic
I.11.1. Pseudomonas Aeruginosa
I.11.1.1. NMA outcomes
Outcome 1: NMA FEV1 % predicted (range of scores: 0–100)
%20of%20study%20estimates%20for%20interventions%20versus%20placebo.&p=BOOKS&id=535666_appif152.jpg "Click on image to zoom")
Figure 152Forest plot showing mean differences (with their 95% CI) of study estimates for interventions versus placebo
Abbreviations: CI: confidence interval; ES: effect size
%20of%20study%20estimates%20for%20interventions%20versus%20tobramycin%20(nebulised).&p=BOOKS&id=535666_appif153.jpg "Click on image to zoom")
Figure 153Forest plot showing mean differences (with their 95% CI) of study estimates for interventions versus tobramycin (nebulised)
Abbreviations: CI: confidence interval; FEV: forced expiratory volume
Outcome 2: NMA number of patients experiencing at last one exacerbation
%20of%20NMA%20estimates%20for%20each%20intervention%20versus%20placebo%20for%20the%20number%20of%20people%20experiencing%20at%20least%20one%20exacerbation%20with%20short-term%20(4%0201310%20weeks)%20treatment.&p=BOOKS&id=535666_appif154.jpg "Click on image to zoom")
Figure 154Forest plot showing odds ratios (with their 95% CI) of NMA estimates for each intervention versus placebo for the number of people experiencing at least one exacerbation with short-term (4–10 weeks) treatment
Abbreviations: CI: confidence interval; Fosfo: fosfomycin; Tob: tobramycin. Note: Vertical dashed line shows line of no effect.
%20of%20NMA%20estimates%20for%20each%20intervention%20versus%20placebo%20for%20the%20number%20of%20people%20experiencing%20at%20least%20one%20exacerbation%20with%20long-term%20(%3E10%20weeks)%20treatment.&p=BOOKS&id=535666_appif155.jpg "Click on image to zoom")
Figure 155Forest plot showing odds ratios (with their 95% CI) of NMA estimates for each intervention versus placebo for the number of people experiencing at least one exacerbation with long-term (>10 weeks) treatment
Combination: 28 days aztreonam lysine (nebulised) alternating with 28 days tobramycin (nebulised). Vertical dashed line shows the line of no effect
I.11.1.2. Non-NMA outcomes (pairwise comparisons)
Pairwise comparison 1: Aztreonam lysine versus placebo
.&p=BOOKS&id=535666_appif156.jpg "Click on image to zoom")
Figure 156Lung function: relative change in FEV1% predicted at 28 days follow-up (range of scores: 0–100)
Abbreviations: CI: confidence interval; FEV1: forced expiratory volume in 1 second; IV: inverse variance; SD: standard deviation
%2C%20at%204%20weeks%20follow-up.&p=BOOKS&id=535666_appif157.jpg "Click on image to zoom")
Figure 157Suppression of the organism: adjusted mean change in P. aeruginosa sputum density (log10), at 4 weeks follow-up
Abbreviations: CI: confidence interval; df: degrees of freedom; IV: inverse variance; SE: standard error
%2C%20at%204%20weeks%20follow-up.&p=BOOKS&id=535666_appif158.jpg "Click on image to zoom")
Figure 158Nutritional status: % weight change (kg), at 4 weeks follow-up
Abbreviations: CI: confidence interval; IV: inverse variance; kg: kilograms; SD: standard deviation
.&p=BOOKS&id=535666_appif159.jpg "Click on image to zoom")
Figure 159Quality of life: CFQ-R, at 4 weeks follow-up (range of scores: 0–100)
Abbreviations: CI: confidence interval; CFQ-R: cystic fibrosis questionnaire revised; df: degrees of freedom; IV: inverse variance; SD: standard deviation

Figure 160Mild adverse events, at 4 weeks follow-up
Abbreviations: CI: confidence interval; df: degrees of freedom; M-H: Mantel-Haenszel

Figure 161Serious adverse events, at 4 weeks follow-up
Abbreviations: CI: confidence interval; df: degrees of freedom; M-H: Mantel-Haenszel

Figure 162Mortality, at 4 weeks follow-up
Abbreviations: CI: confidence interval; M-H: Mantel-Haenszel. Not estimable as no deaths were recorded in either group.

Figure 163Emergence of resistant organisms, at 42 weeks follow-up
Abbreviations: CI: confidence interval; M-H: Mantel-Haenszel.
Pairwise comparison 2: Ciprofloxacin versus placebo
%2C%20at%206%20to%2012%20months%20follow-up.&p=BOOKS&id=535666_appif164.jpg "Click on image to zoom")
Figure 164Nutritional status: weight (kg), at 6 to 12 months follow-up
Abbreviations: CI: confidence interval; kg: kilograms; IV: inverse variance; SD: standard deviation

Figure 165Mild adverse events, at 12 months follow-up
Abbreviations: CI: confidence interval; M-H: Mantel-Haenszel.

Figure 166Mortality, at 12 months follow-up
Abbreviations: CI: confidence interval; M-H: Mantel-Haenszel

Figure 167Emergence of resistant organisms, at 12 months follow-up
Abbreviations: CI: confidence interval; M-H: Mantel-Haenszel
Pairwise comparison 3.1. Colistin versus placebo
.&p=BOOKS&id=535666_appif168.jpg "Click on image to zoom")
Figure 168Lung function: change in FEV1 % predicted at 3 months follow-up (range of scores: 0–100)
Abbreviations: CI: confidence interval; FEV1: forced expiratory volume in 1 second; IV: inverse variance; SD: standard deviation

Figure 169Suppression of the organism: eradication of the organism from sputum, at 3 months follow-up
Abbreviations: CI: confidence interval; M-H: Mantel-Haenszel. Data cannot be plotted as there were 0 events in each group.

Figure 170Emergence of resistant organisms, at 3 months follow-up
Abbreviations: CI: confidence interval; M-H: Mantel-Haenszel. Data cannot be plotted as there were 0 events in each group.
Pairwise comparison 3.2. Colistin inhalation powder (COLO DPI) versus colistin inhalation solution (COLI nebulised)
.&p=BOOKS&id=535666_appif171.jpg "Click on image to zoom")
Figure 171Lung function: % mean change in FEV1% predicted at 4 weeks follow-up (range of scores: 0–100)
Abbreviations: CI: confidence interval; COLI: colistin; DPI: dry powder inhalation; FEV1: forced expiratory volume in 1 second; IV: inverse variance; SE: standard error

Figure 172Mild adverse events, at 8 weeks follow-up
Abbreviations: CI: confidence interval; COLI: colistin; DPI: dry powder inhalation; M-H: Mantel-Haenszel

Figure 173Serious adverse events, at 8 weeks follow-up
Abbreviations: CI: confidence interval; COLI: colistin; DPI: dry powder inhalation; M-H: Mantel-Haenszel
Pairwise comparison 3.3. Colistin versus tobramycin
.&p=BOOKS&id=535666_appif174.jpg "Click on image to zoom")
Figure 174Lung function: mean % change in FEV1% predicted at 1 to 3 months follow-up (range of scores: 0–100)
Abbreviations: CI: confidence interval; FEV1: forced expiratory volume in 1 second; IV: inverse variance; Neb: nebulised; SD: standard deviation
.&p=BOOKS&id=535666_appif175.jpg "Click on image to zoom")
Figure 175Lung function: mean % change in FEV1% predicted at 4 weeks follow-up (range of scores: 0–100)
Abbreviations: CI: confidence interval; FEV1: forced expiratory volume in 1 second; IV: inverse variance; Neb: nebulised; SE: standard error
.&p=BOOKS&id=535666_appif176.jpg "Click on image to zoom")
Figure 176Lung function: mean % change in FEV1% predicted at 12 weeks follow-up (range of scores: 0–100)
Abbreviations: CI: confidence interval; FEV1: forced expiratory volume in 1 second; IV: inverse variance; Neb: nebulised; SE: standard error
.&p=BOOKS&id=535666_appif177.jpg "Click on image to zoom")
Figure 177Lung function: mean % change in FEV1% predicted at 24 weeks follow-up (range of scores: 0–100)
Abbreviations: CI: confidence interval; df: degrees of freedom; FEV1: forced expiratory volume in 1 second; IV: inverse variance; Neb: nebulised; SE: standard error
%2C%20at%2024%20weeks%20follow-up.&p=BOOKS&id=535666_appif178.jpg "Click on image to zoom")
Figure 178Time to next pulmonary exacerbation: time to first additional antipseudomonal treatment (days), at 24 weeks follow-up
Abbreviations: CI: confidence interval; IV: inverse variance; SD: standard deviation

Figure 179Suppression of the organism: change in sputum P. aeruginosa density Log10 CFU/ml, at 4 weeks follow-up
Abbreviations: CI: confidence interval; IV: inverse variance; SD: standard deviation

Figure 180Nutritional status: BMI change at 24 weeks follow-up
Abbreviations: BMI: body mass index; CI: confidence interval; IV: inverse variance; SD: standard deviation
Figure 181Quality of life: CFQ-R all domains, at 24 weeks follow-up (range of scores: 0–100)
Data cannot be presented in forest plots, as SD are not reported.
Abbreviations: CFQ-R: cystic fibrosis questionnaire revised

Figure 182Mild adverse events: change in sputum, at 4 weeks follow-up
Abbreviations: CI: confidence interval; M-H: Mantel-Haenszel

Figure 183Mild adverse events: pharyngitis, at 4 weeks follow-up
Abbreviations: CI: confidence interval; M-H: Mantel-Haenszel

Figure 184Mild adverse events: cough, at 4 weeks follow-up
Abbreviations: CI: confidence interval; M-H: Mantel-Haenszel

Figure 185Mild adverse events: cough, at 24 weeks follow-up
Abbreviations: CI: confidence interval; M-H: Mantel-Haenszel

Figure 186Mild adverse events: chest discomfort, at 24 weeks follow-up
Abbreviations: CI: confidence interval; M-H: Mantel-Haenszel

Figure 187Mild adverse events: vomiting, at 24 weeks follow-up
Abbreviations: CI: confidence interval; M-H: Mantel-Haenszel

Figure 188Serious adverse events: patients with > 1 serious AE, at 4 weeks followup
Abbreviations: CI: confidence interval; M-H: Mantel-Haenszel

Figure 189Serious adverse events: dyspnoea, at 4 weeks follow-up
Abbreviations: CI: confidence interval; M-H: Mantel-Haenszel

Figure 190Serious adverse events: dyspnoea, at 24 weeks follow-up
Abbreviations: CI: confidence interval; M-H: Mantel-Haenszel

Figure 191Serious adverse events: patients withdrawn, at 24 weeks follow-up
Abbreviations: CI: confidence interval; M-H: Mantel-Haenszel

Figure 192Serious adverse events: haemoptysis, at 24 weeks follow-up
Abbreviations: CI: confidence interval; M-H: Mantel-Haenszel

Figure 193Emergence of resistant organisms: emergence of highly tobramycin-resistant P. Aeruginosa at 4 weeks follow-up
Abbreviations: CI: confidence interval; M-H: Mantel-Haenszel. Data cannot be plotted, as there were 0 events in each group.
Pairwise comparison 4.1. Tobramycin versus placebo
.&p=BOOKS&id=535666_appif193.jpg "Click on image to zoom")
Figure 194Lung function: mean % change in FEV1% predicted at 1 to 3 months follow-up (range of scores: 0–100)
Abbreviations: CI: confidence interval; df: degrees of freedom; FEV1: forced expiratory volume in 1 second; IV: inverse variance; SE: standard error

Figure 195Suppression of the organism: eradication of the organism at 4, 6, 12, 8, 20 and 24 weeks follow-up
Abbreviations: CI: confidence interval; df: degrees of freedom; M-H: Mantel-Haenszel

Figure 196Suppression of the organism: change in P. aeruginosa sputum density log10 CFU/G, at 4 weeks follow-up
Abbreviations: CI: confidence interval; IV: inverse variance; SD: standard deviation
%2C%20at%2012%20and%2024%20weeks%20follow-up.&p=BOOKS&id=535666_appif196.jpg "Click on image to zoom")
Figure 197Nutrition: bodyweight change (kg), at 12 and 24 weeks follow-up
Abbreviations: CI: confidence interval; IV: inverse variance; kg: kilograms; SD: standard deviation

Figure 198Mild adverse events, at 4, 24 and 42 weeks follow-up
Abbreviations: CI: confidence interval; df: degrees of freedom; M-H: Mantel-Haenszel

Figure 199Serious adverse events, at 24 weeks follow-up
Abbreviations: CI: confidence interval; df: degrees of freedom; M-H: Mantel-Haenszel

Figure 200Mortality, at up to 12 months follow-up
Abbreviations: CI: confidence interval; df: degrees of freedom; M-H: Mantel-Haenszel

Figure 201Emergence of resistant organisms, at 24 weeks follow-up
Abbreviations: CI: confidence interval; df: degrees of freedom; M-H: Mantel-Haenszel
Pairwise comparison 4.2. Tobramycin inhalation powder (TOBI DPI) versus tobramycin inhalation solution (TOBI nebulised)
.&p=BOOKS&id=535666_appif201.jpg "Click on image to zoom")
Figure 202Lung function: mean change in FEV1% predicted at 4, 20 and 24 weeks follow-up (range of scores: 0–100)
Abbreviations: CI: confidence interval; DPI: dry powder inhalation; FEV1: forced expiratory volume in 1 second; IV: inverse variance; SE: standard error; TOBI: tobramycin

Figure 203Suppression of the organism: mean change in P. aeruginosa sputum density log10 CFU, at 4 to 20 weeks follow-up
Abbreviations: CI: confidence interval; DPI: dry powder inhalation; FEV1: forced expiratory volume in 1 second; IV: inverse variance; PA: Pseudomonas aeruginosa; SD: standard deviation; TOBI: tobramycin

Figure 204Mild adverse events, at 24 weeks follow-up
Abbreviations: CI: confidence interval; DPI: dry powder inhalation; M-H: Mantel-Haenszel; TOBI: tobramycin

Figure 205Serious adverse events, at 24 weeks follow-up
Abbreviations: CI: confidence interval; DPI: dry powder inhalation; M-H: Mantel-Haenszel; TOBI: tobramycin
Pairwise comparison 4.3. Tobramycin versus Aztreonam lysine
.&p=BOOKS&id=535666_appif205.jpg "Click on image to zoom")
Figure 206Lung function: % change in FEV1% predicted at 3 months follow-up (range of scores: 0–100)
Abbreviations: CI: confidence interval; FEV1: forced expiratory volume in 1 second; IV: inverse variance; SD: standard deviation. Calculated across 3×28-day treatment courses

Figure 207Suppression of the organism: adj mean change sputum density log10 PA CFU/G, at 20 weeks follow-up
Abbreviations: CI: confidence interval; CFU: colony forming unit; IV: inverse variance; PA: Pseudomonas aeruginosa; SD: standard deviation
%2C%20at%2024%20weeks%20follow-up.&p=BOOKS&id=535666_appif207.jpg "Click on image to zoom")
Figure 208Nutritional status: % adj mean weight change (kg), at 24 weeks follow-up
Abbreviations: CI: confidence interval;; IV: inverse variance; kg: kilograms; SD: standard deviation
.&p=BOOKS&id=535666_appif208.jpg "Click on image to zoom")
Figure 209Quality of life: CFQ-R respiratory, adj mean change, at 20 weeks follow-up (range of scores: 0–100)
Abbreviations: CI: confidence interval; CFQ-R: cystic fibrosis questionnaire revised; IV: inverse variance; SD: standard deviation

Figure 210Mild adverse events: chest discomfort, at 3 months follow-up
Abbreviations: CI: confidence interval; M-H: Mantel-Haenszel

Figure 211Mild adverse events: cough, at 3 months follow-up
Abbreviations: CI: confidence interval; M-H: Mantel-Haenszel

Figure 212Mild adverse events: headache, at 3 months follow-up
Abbreviations: CI: confidence interval; M-H: Mantel-Haenszel

Figure 213Mild adverse events: vomiting, at 3 months follow-up
Abbreviations: CI: confidence interval; M-H: Mantel-Haenszel

Figure 214Serious adverse events: dyspnoea, at 3 months follow-up
Abbreviations: CI: confidence interval; M-H: Mantel-Haenszel

Figure 215Serious adverse events: haemoptysis, at 3 months follow-up
Abbreviations: CI: confidence interval; M-H: Mantel-Haenszel
Pairwise comparison 5. Combination of fosfomycin + tobramycin versus placebo
.&p=BOOKS&id=535666_appif215.jpg "Click on image to zoom")
Figure 216Lung function: relative change in FEV1% predicted, at 4 weeks follow-up (range of scores: 0–100)
Abbreviations: Abbreviations: CI: confidence interval; FEV1: forced expiratory volume in 1 second; fosfo+TOBI: fosfomycin + tobramycin; IV: inverse variance; SE: standard error

Figure 217Suppression of the organism: sputum PA density, log 10 CFU/g at 4 weeks follow-up
Abbreviations: fosfo+TOBI: fosfomycin + tobramycin; SE: standard error; IV: inverse variance; CI: confidence interval
Pairwise comparison 6. Continuous alternating therapy versus intermittent treatment: aztreonam lysine + tobramycin or placebo + tobramycin
%20(range%20of%20scores%3A%200%02013100).&p=BOOKS&id=535666_appif217.jpg "Click on image to zoom")
Figure 218Lung function: % change in FEV1% predicted (values at 4, 12 and 20 weeks were averaged) (range of scores: 0–100)
Abbreviations: AZLI: aztreonam lysine; CI: confidence interval; FEV1: forced expiratory volume in 1 second; IV: inverse variance; SD: standard deviation; TIS: tobramycin inhaled solution

Figure 219Time to next pulmonary exacerbation
Abbreviations: AZLI: aztreonam lysine; CI: confidence interval; IV: inverse variance; SE: standard error; TIS: tobramycin inhaled solution
%20(range%20of%20scores%3A%200%02013100).&p=BOOKS&id=535666_appif219.jpg "Click on image to zoom")
Figure 220Quality of life: change in CFQ-R (scores were averaged from weeks 4, 12 and 20) (range of scores: 0–100)
Abbreviations: AZLI: aztreonam lysine; CI: confidence interval; CFQ-R: cystic fibrosis questionnaire revised; IV: inverse variance; SD: standard deviation; TIS: tobramycin inhaled solution

Figure 221Adverse events at 3 months follow-up
Abbreviations: AZLI: aztreonam lysine; CI: confidence interval; M-H: Mantel-Haenszel; TIS: tobramycin inhaled solution
I.11.2. Staphylococcus Aureus
Not applicable, as no relevant studies were identified.
I.11.3. Burkholderia Cepacia Complex
Not applicable, as no relevant studies were identified.
I.11.4. Aspergillus Fumigatus
Pairwise comparison 7: Itraconazole versus placebo
.&p=BOOKS&id=535666_appif221.jpg "Click on image to zoom")
Figure 222Percentage change in FEV1 from baseline at 24 and 48 weeks follow-up (range of scores: 0–100)
Abbreviations: CI: confidence interval; FEV1: forced expiratory volume in 1 second; IV: inverse variance; SD: standard deviation. Mean difference (95% CI) at 48-weeks follow-up: −3.71% (−13.26 to 20.28). Not enough data was provided for RevMan.

Figure 223Time to next pulmonary exacerbation at 24 weeks
Abbreviations: CI: confidence interval; IV: inverse variance; SE: standard error

Figure 224Number of pulmonary exacerbations requiring AB or hospitalization, at 24 and 48 weeks follow-up
Abbreviations: AB: antibiotics; CI: confidence interval; M-H: Mantel-Haenszel. Proxy outcome.
Figure 225Quality of life
Data could not be plotted.

Figure 226Number of people experiencing minor adverse events at 24 weeks follow-up
Abbreviations: CI: confidence interval; M-H: Mantel-Haenszel

Figure 227Number of people experiencing major adverse events at 24 weeks follow-up
Abbreviations: CI: confidence interval; M-H: Mantel-Haenszel
I.12. Immunomodulatory agents
I.12.1. NMA outcomes
Pairwise comparison from NMA. Macrolide antibiotics versus placebo
%20treatment.&p=BOOKS&id=535666_appif226.jpg "Click on image to zoom")
Figure 228Rate of exacerbations after short-term (1–10 month) treatment
Abbreviations: CI: confidence interval; df: degrees of freedom; IV: inverse variance; SE: standard error
I.12.2. Non-NMA outcomes (pairwise comparisons)
Pairwise comparison 1. Fluticasone versus placebo

Figure 229Time to next exacerbation at 8 months follow-up
Abbreviations: CI: confidence interval; IV: inverse variance; SE: standard error
%20at%200%20to%2012%20months%20follow-up.&p=BOOKS&id=535666_appif228.jpg "Click on image to zoom")
Figure 230Change in height (height standard deviation score) at 0 to 12 months follow-up
Abbreviations: CI: confidence interval; IV: inverse variance; SD: standard deviation
%20at%208%20months%20follow-up.&p=BOOKS&id=535666_appif229.jpg "Click on image to zoom")
Figure 231Change in height (cm) at 8 months follow-up
Abbreviations: CI: confidence interval; cm: centimetres; IV: inverse variance; SD: standard deviation
Pairwise comparison 2. Prednisone/Prednisolone versus placebo
%20at%2012%20weeks%20follow-up.&p=BOOKS&id=535666_appif230.jpg "Click on image to zoom")
Figure 232Absolute change in weight (kg) at 12 weeks follow-up
Abbreviations: Ci: confidence interval; IV: inverse variance; kg: kilograms; SD: standard deviation. Intervention: 2mg/kg Prednisolone;
%20at%2018%20years%20of%20age%2C%20boys.&p=BOOKS&id=535666_appif231.jpg "Click on image to zoom")
Figure 233Weight (kg) at 18 years of age, boys
Abbreviations: CI: confidence interval; IV: inverse variance; kg: kilograms; SD: standard deviation
%20at%2018%20years%20of%20age%2C%20girls.&p=BOOKS&id=535666_appif232.jpg "Click on image to zoom")
Figure 234Weight (kg) at 18 years of age, girls
Abbreviations: CI: confidence interval; IV: inverse variance; kg: kilograms; SD: standard deviation
%20at%2018%20years%20of%20age%2C%20boys.&p=BOOKS&id=535666_appif233.jpg "Click on image to zoom")
Figure 235Height (cm) at 18 years of age, boys
Abbreviations: CI: confidence interval; cm: centimetres; IV: inverse variance; SD: standard deviation
%20at%2018%20years%20of%20age%2C%20girls.&p=BOOKS&id=535666_appif234.jpg "Click on image to zoom")
Figure 236Height (cm) at 18 years of age, girls
Abbreviations: CI: confidence interval; cm: centimetres; IV: inverse variance; SD: standard deviation

Figure 237Adverse effects, at 3 and 4 years follow-up
Abbreviations: CI: confidence interval;: M-H: Mantel-Haenszel

Figure 238Mortality with 2mg/kg prednisone, at 4 year follow-up
Abbreviations: CI: confidence interval; kg: kilograms; M-H: Mantel-Haenszel; mg: milligrams
Pairwise comparison 3. Azithromycin versus placebo

Figure 239Time to next exacerbation at 6 months follow-up
Abbreviations: CI: confidence interval; df: degrees of freedom; IV: inverse variance; SE: standard error

Figure 240Time to next exacerbation at 12 months follow-up
Abbreviations: CI: confidence interval; IV: inverse variance; SE: standard error

Figure 241Change in BMI z score at 12 months follow-up
Abbreviations: BMI: body mass index; CI: confidence interval; IV: inverse variance; SD: standard deviation
%20at%206%20months%20follow-up.&p=BOOKS&id=535666_appif240.jpg "Click on image to zoom")
Figure 242Change in weight (kg) at 6 months follow-up
Abbreviations: CI: confidence interval; IV: inverse variance; kg: kilograms; SE: standard error
%20at%206%20months%20follow-up%20(range%20of%20scores%3A%200%02013100).&p=BOOKS&id=535666_appif241.jpg "Click on image to zoom")
Figure 243Change in quality of life (CFQ-R) at 6 months follow-up (range of scores: 0–100)
Abbreviations: CI: confidence interval; CFQ-R: cystic fibrosis questionnaire revised; IV: inverse variance; SD: standard deviation

Figure 244Adverse side effects at 6 months follow-up
Abbreviations: CI: confidence interval; M-H: Mantel-Haenszel
Pairwise comparison 4. Ibuprofen versus placebo

Figure 245Annual rate of change in % ideal body weight at 4 years follow-up
Abbreviations: CI: confidence interval; IV: inverse variance; SD: standard deviation

Figure 246Annual rate of change in % ideal body weight by age at 4 years followup
Abbreviations: CI: Confidence interval; IV: inverse variance; SD: standard deviation

Figure 247Adverse effects: abdominal pain at 2 and 4 years follow-up
Abbreviations: CI: confidence interval; M-H: Mantel-Haenszel
%20at%202%20years%20follow-up.&p=BOOKS&id=535666_appif246.jpg "Click on image to zoom")
Figure 248Adverse effects: gastrointestinal bleeding) at 2 years follow-up
Abbreviations: CI: confidence interval; M-H: Mantel-Haenszel
I.13. Nutritional interventions
Comparison 1. Oral supplements versus usual care
%20at%203%2C%206%2C%2012%20months%20follow-up.&p=BOOKS&id=535666_appif247.jpg "Click on image to zoom")
Figure 249Change in weight (kg) at 3, 6, 12 months follow-up
Abbreviations: kg: kilograms; SD: standard deviation; IV: inverse variance; CI: confidence interval
%20at%203%2C%206%2C%20and%2012%20months%20follow-up.&p=BOOKS&id=535666_appif248.jpg "Click on image to zoom")
Figure 250Change in height (cm) at 3, 6, and 12 months follow-up
Abbreviations: CI: confidence interval; cm: centimetres; IV: inverse variance; SD: standard deviation;

Figure 251Change in weight as % expected for age and height at 6 months followup
Abbreviations: CI: confidence interval; IV: inverse variance; SD: standard deviation;
%20at%203%2C%206%20and%2012%20months%20follow-up.&p=BOOKS&id=535666_appif250.jpg "Click on image to zoom")
Figure 252Change in BMI (kg/m2) at 3, 6 and 12 months follow-up
Abbreviations: BMI: body mass index; CI: confidence interval; kg: kilograms; IV: inverse variance; m2: square metres; SD: standard deviation
%20at%203%2C%206%20and%2012%20months%20follow-up.&p=BOOKS&id=535666_appif251.jpg "Click on image to zoom")
Figure 253Change in BMI (centile) at 3, 6 and 12 months follow-up
Abbreviations: BMI: body mass index; CI: confidence interval; IV: inverse variance; SD: standard deviation
%20at%203%2C%206%2C%20and%2012%20months%20follow-up.&p=BOOKS&id=535666_appif252.jpg "Click on image to zoom")
Figure 254Change in weight (centile) at 3, 6, and 12 months follow-up
Abbreviations: SD: standard deviation; IV: inverse variance; CI: confidence interval
%20at%203%2C%206%20and%2012%20months%20follow-up.&p=BOOKS&id=535666_appif253.jpg "Click on image to zoom")
Figure 255Change in height (centile) at 3, 6 and 12 months follow-up
Abbreviations: CI: confidence interval; IV: inverse variance; SD: standard deviation

Figure 256Change in height as % expected for age at 6-months follow-up
Abbreviations: CI: confidence interval; IV: inverse variance; SD: standard deviation
.&p=BOOKS&id=535666_appif255.jpg "Click on image to zoom")
Figure 257Change in FEV1 % predicted at 3, 6 and 12 months follow-up (range of scores: 0–100)
Abbreviations: CI: confidence interval; df: degrees of freedom; FEV1: forced expiratory volume in 1 second; IV: inverse variance; SD: standard deviation
Comparison 1.2 Oral calorie supplementation versus nutritional advice
%20at%203%20months%20follow-up.&p=BOOKS&id=535666_appif256.jpg "Click on image to zoom")
Figure 258Change in weight (kg) at 3 months follow-up
Abbreviations: kg: kilograms; SD: standard deviation; IV: inverse variance; CI: confidence interval
%20at%203%20months%20follow-up.&p=BOOKS&id=535666_appif257.jpg "Click on image to zoom")
Figure 259Change in weight for height (%) at 3 months follow-up
Abbreviations: CI: confidence interval; IV: inverse variance; SD: standard deviation

Figure 260Change in weight z score at 3 and 6 months follow-up
Abbreviations: SD: standard deviation; IV: inverse variance; CI: confidence interval

Figure 261Change in % ideal body weight at 3 and 6 months follow-up
Abbreviations: SD: standard deviation; IV: inverse variance; CI: confidence interval
%20at%203%20months%20follow-up.&p=BOOKS&id=535666_appif260.jpg "Click on image to zoom")
Figure 262Change in height (cm) at 3 months follow-up
Abbreviations: CI: confidence interval; IV: inverse variance; SD: standard deviation

Figure 263Change in height z score at 3 and 6 months follow-up
Abbreviations: CI: confidence interval; IV: inverse variance; SD: standard deviation
.&p=BOOKS&id=535666_appif262.jpg "Click on image to zoom")
Figure 264Change in FEV1 % predicted at 3 and 6 months follow-up (range of scores: 0–100)
Abbreviations: CI: confidence interval; FEV1: forced expiratory volume in 1 second; IV: inverse variance; SD: standard deviation
Comparison 2. Enteral tube feeding versus nutritional advice
%20at%201%2C%202%2C%20and%203%20years%20follow-up.&p=BOOKS&id=535666_appif263.jpg "Click on image to zoom")
Figure 265Change in weight (kg) at 1, 2, and 3 years follow-up
Abbreviations: kg: kilograms; SD: standard deviation; IV: inverse variance; CI: confidence interval

Figure 266Change in weight z score at 6 and 12 months follow-up
Abbreviations: SD: standard deviation; IV: inverse variance; CI: confidence interval

Figure 267Change in height z score at 6 and 12 months follow-up
Abbreviations: CI: confidence interval; IV: inverse variance; SD: standard deviation

Figure 268Change in BMI z score at 6 and 12 months follow-up
Abbreviations: BMI: body mass index; CI: confidence interval; IV: inverse variance; SD: standard deviation
%20at%201%2C%202%20and%203%20years%20follow-up.&p=BOOKS&id=535666_appif267.jpg "Click on image to zoom")
Figure 269Change in BMI (kg/m2) at 1, 2 and 3 years follow-up
Abbreviations: BMI: body mass index; CI: confidence interval; IV: inverse variance; kg: kilograms; m2: square metres; SD: standard deviation
.&p=BOOKS&id=535666_appif268.jpg "Click on image to zoom")
Figure 270Change in FEV1 % predicted at 6 months and at 1, 2, 3 years follow-up (range of scores: 0–100)
Abbreviations: CI: confidence interval; FEV1: forced expiratory volume in 1 second; IV: inverse variance; SD: standard deviation

Figure 271Change in IV treatment days at 1, 2, 3 years follow-up
Abbreviations: SD: standard deviation; IV: inverse variance; CI: confidence interval
Comparison 3. Appetite stimulants versus placebo
%20at%203%20and%206%20months%20follow-up.&p=BOOKS&id=535666_appif270.jpg "Click on image to zoom")
Figure 272Change in weight (kg) at 3 and 6 months follow-up
Abbreviations: kg: kilograms; SD: standard deviation; IV: inverse variance; CI: confidence interval; df: degrees of freedom

Figure 273Change in weight z score at 3 and 6 months follow-up
Abbreviations: SD: standard deviation; IV: inverse variance; CI: confidence interval; df: degrees of freedom
%20at%203%20months%20follow-up.&p=BOOKS&id=535666_appif272.jpg "Click on image to zoom")
Figure 274Change in height (cm) at 3 months follow-up
Abbreviations: CI: confidence interval; cm: centimetres; IV: inverse variance; SD: standard deviation
.&p=BOOKS&id=535666_appif273.jpg "Click on image to zoom")
Figure 275Change in FEV1 % predicted at 3 and 6 months follow-up (range of scores: 0–100)
Abbreviations: CI: confidence interval; FEV1: forced expiratory volume in 1 second; IV: inverse variance; SD: standard deviation
%20at%203%20months%20follow-up.&p=BOOKS&id=535666_appif274.jpg "Click on image to zoom")
Figure 276Change in BMI (kg/m2) at 3 months follow-up
Abbreviations: BMI: body mass index; CI: confidence interval; kg: kilograms; IV: inverse variance; m2: square metres; SD: standard deviation

Figure 277Change in BMI percentile at 3 months follow-up
Abbreviations: BMI: body mass index; CI: confidence interval; IV: inverse variance; SD: standard deviation

Figure 278Change in % ideal body weight at 3 months follow-up
Abbreviations: SD: standard deviation; IV: inverse variance; CI: confidence interval

Figure 279Number of pulmonary exacerbations at 3 months follow-up
Abbreviations: M-H: Mantel-Haenszel; CI: confidence interval

Figure 280Adverse effects: constipation at 6 months follow-up
Abbreviations: M-H: Mantel-Haenszel; CI: confidence interval

Figure 281Adverse effects: decreased morning cortisol levels <30 nmol/L at 6 months follow-up
Abbreviations: M-H: Mantel-Haenszel; CI: confidence interval
Comparison 4. Nutrition education versus usual care
%20at%206%20and%2012%20months%20follow-up.&p=BOOKS&id=535666_appif280.jpg "Click on image to zoom")
Figure 282Change in weight (kg) at 6 and 12 months follow-up
Abbreviations: kg: kilograms; SD: standard deviation; IV: inverse variance; CI: confidence interval
.&p=BOOKS&id=535666_appif281.jpg "Click on image to zoom")
Figure 283Change in FEV1 % predicted at 6 and 12 months follow-up (range of scores: 0–100)
Abbreviations: CI: confidence interval; FEV1: forced expiratory volume in 1 second; IV: inverse variance; SD: standard deviation
Comparison 5.1 Behavioural intervention versus usual care
%20at%206%20weeks%20follow-up.&p=BOOKS&id=535666_appif282.jpg "Click on image to zoom")
Figure 284Change in weight (kg) at 6 weeks follow-up
Abbreviations: kg: kilograms; SD: standard deviation; IV: inverse variance; CI: confidence interval
%20at%206%20weeks%20follow-up.&p=BOOKS&id=535666_appif283.jpg "Click on image to zoom")
Figure 285Change in height (cm) at 6 weeks follow-up
Abbreviations: CI: confidence interval; cm: centimetres; IV: inverse variance; SD: standard deviation

Figure 286Change in weight z score at 6 weeks follow-up
Abbreviations: SD: standard deviation; IV: inverse variance; CI: confidence interval
.&p=BOOKS&id=535666_appif285.jpg "Click on image to zoom")
Figure 287Change in FEV1 % predicted at 6 weeks follow-up (range of scores: 0–100)
Abbreviations: CI: confidence interval; FEV1: forced expiratory volume in 1 second; IV: inverse variance; SD: standard deviation
Comparison 5.2 Behavioural intervention versus education and attention control treatment

Figure 288Change in weight z score at 6 and 18 months follow-up
Abbreviations: SD: standard deviation; IV: inverse variance; CI: confidence interval

Figure 289Change in height z score at 18 months follow-up
Abbreviations: CI: confidence interval; IV: inverse variance; SD: standard deviation
%20at%206%20months%20follow-up.&p=BOOKS&id=535666_appif288.jpg "Click on image to zoom")
Figure 290Adverse effects (digestive system) at 6 months follow-up
Comparison 5.3. Behavioural management training plus educational intervention versus educational intervention alone
%20at%202%2C%2012%20and%2024%20months%20follow-up.&p=BOOKS&id=535666_appif289.jpg "Click on image to zoom")
Figure 291Change in weight (kg) at 2, 12 and 24 months follow-up
Abbreviations: kg: kilograms; BEH plus EDU: Behavioural management training plus educational intervention; EDU: educational intervention alone; SD: standard deviation; IV: inverse variance; CI: confidence interval

Figure 292Change in BMI z score at 2 and 24 months follow-up
Abbreviations: BMI: body mass index; BEH plus EDU: Behavioural management training plus educational intervention; CI: confidence interval; EDU: educational intervention alone; IV: inverse variance; SD: standard deviation

Figure 293Change in % ideal body weight at 12 months follow-up
Abbreviations: BEH plus EDU: Behavioural management training plus educational intervention; EDU: educational intervention alone; SD: standard deviation; IV: inverse variance; CI: confidence interval

Figure 294Change in weight % for age at 12 months follow-up
Abbreviations: BEH plus EDU: Behavioural management training plus educational intervention; EDU: educational intervention alone; SD: standard deviation; IV: inverse variance; CI: confidence interval
%20at%2012%20and%2024%20months%20follow-up.&p=BOOKS&id=535666_appif293.jpg "Click on image to zoom")
Figure 295Change in height (cm) at 12 and 24 months follow-up
Abbreviations: BEH plus EDU: Behavioural management training plus educational intervention; CI: confidence interval; cm: centimetres; EDU: educational intervention alone; IV: inverse variance; SD: standard deviation

Figure 296Change in height z score at 24 months follow-up
Abbreviations: BEH plus EDU: Behavioural management training plus educational intervention; CI: confidence interval; cm: centimetres; EDU: educational intervention alone; IV: inverse variance; SD: standard deviation

Figure 297Change in FEV1 % predicted at 2 years follow-up
Abbreviations: BEH plus EDU: Behavioural management training plus educational intervention; CI: confidence interval; EDU: educational intervention alone; FEV1: forced expiratory volume in 1 second; IV: inverse variance; SD: standard deviation.
Note: The study does not specify the unit of measurement for FEV1.
I.14. Exocrine Pancreatic insufficiency
Comparison 1. Acid suppressing agents as adjuvant therapy to PERT
No forest plots available.
Comparison 2. High dose versus low dose PERT
Comparison 2.1. High-dose PERT versus low dose PERT in children
%20at%2014%20days%20follow-up.&p=BOOKS&id=535666_appif296.jpg "Click on image to zoom")
Figure 298Faecal fat excretion (g/kg per day) at 14 days follow-up
Abbreviations: g: grams; kg: kilograms; CI: confidence interval
%20at%209%20days%20follow-up.&p=BOOKS&id=535666_appif297.jpg "Click on image to zoom")
Figure 299Faecal fat excretion (g/day) at 9 days follow-up
Abbreviations: g: grams; CI: confidence interval
%20at%204%20weeks%20follow-up.&p=BOOKS&id=535666_appif298.jpg "Click on image to zoom")
Figure 300Stool frequency (bowel movement per day) at 4 weeks follow-up
Abbreviations: CI: confidence interval
Comparison 2.1. High-dose PERT versus low dose PERT in children
No forest plots available.
I.15. Distal intestinal obstruction syndrome
Not applicable, as no studies were included in this review.
I.16. Monitoring liver disease
Not applicable to this review.
I.17. Ursodeoxycholic acid
Comparison 1. UDCA versus placebo or control

Figure 301Lack of normalisation of hepatobiliary enzymes at 6 months follow-up
Abbreviations: UDCA: ursodeoxycholic acid; M-H: Mantel-Haenszel; CI: confidence interval; df: degrees of freedom
%20at%206%20months%20follow-up.&p=BOOKS&id=535666_appif300.jpg "Click on image to zoom")
Figure 302Final value of bilirubin value (umol/L) at 6 months follow-up
Abbreviations: UDCA: ursodeoxycholic acid; SD: standard deviation; IV: inverse variance; CI: confidence interval

Figure 303Percentage change in hepatobiliary enzymes at 12 months follow-up
Abbreviations: UDCA: ursodeoxycholic acid; SD: standard deviation; IV: inverse variance; CI: confidence interval. Colombo: Data reported as multiples of the upper limit of normal reference values.
Figure 304No development of liver disease at 6 months follow-up
Data cannot be plotted. None of the participants developed liver disease in either treatment arm.

Figure 305Liver failure at 12 months follow-up
Abbreviations: UDCA: ursodeoxycholic acid; M-H: Mantel-Haenszel; CI: confidence interval

Figure 306Liver transplantation at 12 months follow-up
Abbreviations: UDCA: ursodeoxycholic acid; M-H: Mantel-Haenszel; CI: confidence interval
I.18. Monitoring for CF related diabetes
Not applicable, as no studies were identified for this review.
I.19. Bone mineral density
Not applicable to this review.
I.20. Exercise
Comparison 1. Aerobic exercise training programme versus no exercise programme
%20(range%20of%20scores%3A%200%02013100).&p=BOOKS&id=535666_appif304.jpg "Click on image to zoom")
Figure 307Change in FEV1 % predicted at hospital discharge (mean ≈ 19 days) (range of scores: 0–100)
Abbreviations: CI: confidence interval; FEV1: forced expiratory volume in 1 second; IV: inverse variance; SD: standard deviation
.&p=BOOKS&id=535666_appif305.jpg "Click on image to zoom")
Figure 308Change in FEV1 % predicted at 3 months follow-up (range of scores: 0–100)
Abbreviations: CI: confidence interval; df: degrees of freedom; FEV1: forced expiratory volume in 1 second; IV: inverse variance; SD: standard deviation
.&p=BOOKS&id=535666_appif306.jpg "Click on image to zoom")
Figure 309Change in FEV1 % predicted at 6 months follow-up (range of scores: 0–100)
Abbreviations: CI: confidence interval; FEV1: forced expiratory volume in 1 second; IV: inverse variance; SD: standard deviation
.&p=BOOKS&id=535666_appif307.jpg "Click on image to zoom")
Figure 310Change in FEV1 % predicted at 3 years follow-up (range of scores: 0–100)
Abbreviations: CI: confidence interval; FEV1: forced expiratory volume in 1 second; IV: inverse variance; SD: standard deviation
%20(range%20of%20scores%3A%200%02013100).&p=BOOKS&id=535666_appif308.jpg "Click on image to zoom")
Figure 311Change in FVC % predicted at hospital discharge (mean ≈ 19 days) (range of scores: 0–100)
Abbreviations: CI: confidence interval; FVC: forced vital capacity; IV: inverse variance; SD: standard deviation
.&p=BOOKS&id=535666_appif309.jpg "Click on image to zoom")
Figure 312Change in FVC % predicted at 3 months follow-up (range of scores: 0–100)
Abbreviations: CI: confidence interval; df: degrees of freedom; FVC: forced vital capacity; IV: inverse variance; SD: standard deviation;
.&p=BOOKS&id=535666_appif310.jpg "Click on image to zoom")
Figure 313Change in FVC % predicted at 6 months follow-up (range of scores: 0–100)
Abbreviations: CI: confidence interval; FVC: forced vital capacity; IV: inverse variance; SD: standard deviation
.&p=BOOKS&id=535666_appif311.jpg "Click on image to zoom")
Figure 314Change in FVC % predicted at 3 years follow-up (range of scores: 0–100)
Abbreviations: CI: confidence interval; FVC: forced vital capacity; IV: inverse variance; SD: standard deviation
.&p=BOOKS&id=535666_appif312.jpg "Click on image to zoom")
Figure 315Change in VO2 max. at hospital discharge (mean ≈ 19 days)
Abbreviations: CI: confidence interval; IV: inverse variance; SD: standard deviation; VO2 max: maximal oxygen consumption

Figure 316Change in VO2 max. at 3 months follow-up
Abbreviations: CI: confidence interval; df: degrees of freedom; IV: inverse variance; SD: standard deviation; VO2 max: maximal oxygen consumption

Figure 317Change in VO2 max. at 6 months follow-up
Abbreviations: CI: confidence interval; IV: inverse variance; SD: standard deviation; VO2 max: maximal oxygen consumption

Figure 318Change in BMI at 3 months follow-up
Abbreviations: BMI: body mass index; CI: confidence interval; IV: inverse variance; SD: standard deviation

Figure 319Change in BMI at 6 months follow-up
Abbreviations: BMI: body mass index; CI: confidence interval; IV: inverse variance; SD: standard deviation
Comparison 2.1. Strength resistance/anaerobic training programme versus no exercise programme
%20(range%20of%20scores%3A%200%02013100).&p=BOOKS&id=535666_appif317.jpg "Click on image to zoom")
Figure 320Change in FEV1 % predicted at hospital discharge (mean ≈ 19 days) (range of scores: 0–100)
Abbreviations: CI: confidence interval; FEV1: forced expiratory volume in 1 second; IV: inverse variance; SD: standard deviation
.&p=BOOKS&id=535666_appif318.jpg "Click on image to zoom")
Figure 321Change in FEV1 % predicted at 3 months follow-up (range of scores: 0–100)
Abbreviations: CI: confidence interval; FEV1: forced expiratory volume in 1 second; IV: inverse variance; SD: standard deviation
.&p=BOOKS&id=535666_appif319.jpg "Click on image to zoom")
Figure 322Change in FEV1 % predicted at 6 months follow-up (range of scores: 0–100)
Abbreviations: CI: confidence interval; FEV1: forced expiratory volume in 1 second; IV: inverse variance; SD: standard deviation
%20(range%20of%20scores%3A%200%02013100).&p=BOOKS&id=535666_appif320.jpg "Click on image to zoom")
Figure 323Change in FVC % predicted at hospital discharge (mean ≈ 19 days) (range of scores: 0–100)
Abbreviations: CI: confidence interval; FVC: forced vital capacity; IV: inverse variance; SD: standard deviation
.&p=BOOKS&id=535666_appif321.jpg "Click on image to zoom")
Figure 324Change in FVC % predicted at 3 months follow-up (range of scores: 0–100)
Abbreviations: CI: confidence interval; FVC: forced vital capacity; IV: inverse variance; SD: standard deviation
.&p=BOOKS&id=535666_appif322.jpg "Click on image to zoom")
Figure 325Change in FVC % predicted at 6 months follow-up (range of scores: 0–100)
Abbreviations: CI: confidence interval; FVC: forced vital capacity; IV: inverse variance; SD: standard deviation
.&p=BOOKS&id=535666_appif323.jpg "Click on image to zoom")
Figure 326Change in VO2 max at hospital discharge (mean ≈ 19 days)
Abbreviations: CI: confidence interval; IV: inverse variance; SD: standard deviation; VO2 max: maximal oxygen consumption

Figure 327Change in VO2 max at 3 months follow-up
Abbreviations: CI: confidence interval; df: degrees of freedom; IV: inverse variance; SD: standard deviation; VO2 max: maximal oxygen consumption

Figure 328Change in VO2 max at 6 months follow-up
Abbreviations: CI: confidence interval; IV: inverse variance; SD: standard deviation; VO2 max: maximal oxygen consumption

Figure 329Change in BMI at 3 months follow-up
Abbreviations: BMI: body mass index; CI: confidence interval; IV: inverse variance; SD: standard deviation

Figure 330Change in BMI at 6 months follow-up
Abbreviations: BMI: body mass index; CI: confidence interval; IV: inverse variance; SD: standard deviation
%20at%203%20months%20follow-up%20(range%20of%20scores%3A%200%02013100).&p=BOOKS&id=535666_appif328.jpg "Click on image to zoom")
Figure 331Change in quality of life (CFQ-R physical domain) at 3 months follow-up (range of scores: 0–100)
Abbreviations: CI: confidence interval; CFQ-R: cystic fibrosis questionnaire revised; IV: inverse variance; SD: standard deviation
Comparison 2.2. Strength/anaerobic training programme versus aerobic training programme
%20(range%20of%20scores%3A%200%02013100).&p=BOOKS&id=535666_appif329.jpg "Click on image to zoom")
Figure 332Change in FEV1 % predicted at hospital discharge (mean ≈ 19 days) (range of scores: 0–100)
Abbreviations: CI: confidence interval; FEV1: forced expiratory volume in 1 second; IV: inverse variance; SD: standard deviation
.&p=BOOKS&id=535666_appif330.jpg "Click on image to zoom")
Figure 333Change in FEV1 % predicted at 3 months follow-up (range of scores: 0–100)
Abbreviations: CI: confidence interval; FEV1: forced expiratory volume in 1 second; IV: inverse variance; SD: standard deviation
.&p=BOOKS&id=535666_appif331.jpg "Click on image to zoom")
Figure 334Change in FEV1 % predicted at 6 months follow-up (range of scores: 0–100)
Abbreviations: CI: confidence interval; df: degrees of freedom; FEV1: forced expiratory volume in 1 second; IV: inverse variance; SD: standard deviation
.&p=BOOKS&id=535666_appif332.jpg "Click on image to zoom")
Figure 335Change in FEV1 % predicted at 12 months follow-up (range of scores: 0–100)
Abbreviations: CI: confidence interval; FEV1: forced expiratory volume in 1 second; IV: inverse variance; SD: standard deviation
%20(range%20of%20scores%3A%200%02013100).&p=BOOKS&id=535666_appif333.jpg "Click on image to zoom")
Figure 336Change in FVC% predicted at hospital discharge (mean aprox. 19 days) (range of scores: 0–100)
Abbreviations: CI: confidence interval; FVC: forced vital capacity; IV: inverse variance; SD: standard deviation
.&p=BOOKS&id=535666_appif334.jpg "Click on image to zoom")
Figure 337Change in FVC% predicted at 3 months follow-up (range of scores: 0–100)
Abbreviations: CI: confidence interval; FVC: forced vital capacity; IV: inverse variance; SD: standard deviation
.&p=BOOKS&id=535666_appif335.jpg "Click on image to zoom")
Figure 338Change in FVC % predicted at 6 months follow-up (range of scores: 0–100)
Abbreviations: CI: confidence interval; FVC: forced vital capacity; IV: inverse variance; SD: standard deviation
.&p=BOOKS&id=535666_appif336.jpg "Click on image to zoom")
Figure 339Change in VO2 max at hospital discharge (mean ≈ 19 days)
Abbreviations: CI: confidence interval; IV: inverse variance; SD: standard deviation; VO2 max: maximal oxygen consumption

Figure 340Change in VO2 max at 3 months follow-up
Abbreviations: CI: confidence interval; IV: inverse variance; SD: standard deviation; VO2 max: maximal oxygen consumption

Figure 341Change in VO2 max at 6 months follow-up
Abbreviations: CI: confidence interval; df: degrees of freedom; IV: inverse variance; SD: standard deviation; VO2 max: maximal oxygen consumption

Figure 342Change in BMI at 3 months follow-up
Abbreviations: BMI: body mass index; CI: confidence interval; IV: inverse variance; SD: standard deviation

Figure 343Change in BMI at 6 months follow-up
Abbreviations: BMI: body mass index; CI: confidence interval; IV: inverse variance; SD: standard deviation
Comparison 3. High-intensity interval training versus standard aerobic and anaerobic exercise programme
.&p=BOOKS&id=535666_appif341.jpg "Click on image to zoom")
Figure 344Change in FEV1 % predicted at 6 weeks follow-up (range of scores: 0–100)
Abbreviations: CI: confidence interval; FEV1: forced expiratory volume in 1 second; IV: inverse variance; SD: standard deviation
%20predicted%20at%206%20weeks%20follow-up.&p=BOOKS&id=535666_appif342.jpg "Click on image to zoom")
Figure 345Change in VC % (range of scores: 0–100) predicted at 6 weeks follow-up
Abbreviations: VC: vital capacity; SD: standard deviation; IV: inverse variance; CI: confidence interval

Figure 346Change in VO2 max at 6 weeks follow-up
Abbreviations: CI: confidence interval; IV: inverse variance; SD: standard deviation; VO2 max: maximal oxygen consumption

Figure 347Change in BMI at 6 weeks follow-up
Abbreviations: BMI: body mass index; CI: confidence interval; IV: inverse variance; SD: standard deviation
Comparison 4. Inspiratory muscle training (IMT) at 80% of maximal effort versus usual care

Figure 348Change in FEV1 litres at 2 to 6 months follow-up
Abbreviations: CI: confidence interval; FEV1: forced expiratory volume in 1 second; IMT 80%: inspiratory muscle training at 80% of maximal effort; IV: inverse variance; SD: standard deviation

Figure 349Change in FVC litres at 2 to 6 months follow-up
Abbreviations: CI: confidence interval; FVC: forced vital capacity; IMT 80%: inspiratory muscle training at 80% of maximal effort; IV: inverse variance; SD: standard deviation
Comparison 5. Combined aerobic and anaerobic training programme versus no exercise programme
.&p=BOOKS&id=535666_appif347.jpg "Click on image to zoom")
Figure 350Change in FEV1 % predicted at 3 months follow-up (range of scores: 0–100)
Abbreviations: CI: confidence interval; df: degrees of freedom; FEV1: forced expiratory volume in 1 second; IV: inverse variance; SD: standard deviation
.&p=BOOKS&id=535666_appif348.jpg "Click on image to zoom")
Figure 351Change in FEV1 % predicted at 3 to 6 months follow-up (range of scores: 0–100)
Abbreviations: CI: confidence interval; FEV1: forced expiratory volume in 1 second; IV: inverse variance; SD: standard deviation
.&p=BOOKS&id=535666_appif349.jpg "Click on image to zoom")
Figure 352Change in FVC% predicted at 3 months follow-up (range of scores: 0–100)
Abbreviations: CI: confidence interval; df: degrees of freedom; FVC: forced vital capacity; IV: inverse variance; SD: standard deviation
.&p=BOOKS&id=535666_appif350.jpg "Click on image to zoom")
Figure 353Change in FVC % predicted at 3 to 6 months follow-up (range of scores: 0–100)
Abbreviations: CI: confidence interval; FVC: forced vital capacity; IV: inverse variance; SD: standard deviation

Figure 354Change in VO2 peak at 3 months follow-up
Abbreviations: CI: confidence interval; IV: inverse variance; SD: standard deviation; VO2 max: maximal oxygen consumption

Figure 355Change in VO2 peak at 3 to 6 months follow-up
Abbreviations: CI: confidence interval; IV: inverse variance; SD: standard deviation; VO2 max: maximal oxygen consumption
%20at%203%20months%20follow-up.&p=BOOKS&id=535666_appif353.jpg "Click on image to zoom")
Figure 356Change in weight (kg) at 3 months follow-up
Abbreviations: kg: kilograms; SD: standard deviation; IV: inverse variance; CI: confidence interval

Figure 357Change in BMI at 3 months follow-up
Abbreviations: BMI: body mass index; CI: confidence interval; IV: inverse variance; SD: standard deviation

Figure 358Change in BMI at 3 to 6 months follow-up
Abbreviations: BMI: body mass index; CI: confidence interval; IV: inverse variance; SD: standard deviation

Figure 359Change in BMI at 12 months follow-up
Abbreviations: BMI: body mass index; CI: confidence interval; IV: inverse variance; SD: standard deviation
.&p=BOOKS&id=535666_appif357.jpg "Click on image to zoom")
Figure 360Change in quality of life – CFQ-R physical functioning at 3 months follow-up (range of scores: 0–100)
Abbreviations: CI: confidence interval; IV: inverse variance; SD: standard deviation
.&p=BOOKS&id=535666_appif358.jpg "Click on image to zoom")
Figure 361Change in quality of life – CFQ-R vitality at 3 months follow-up (range of scores: 0–100)
Abbreviations: CI: confidence interval; CFQ-R: cystic fibrosis questionnaire revised; IV: inverse variance; SD: standard deviation
.&p=BOOKS&id=535666_appif359.jpg "Click on image to zoom")
Figure 362Change in quality of life – CFQ-R emotional state at 3 months follow-up (range of scores: 0–100)
Abbreviations: CI: confidence interval; CFQ-R: cystic fibrosis questionnaire revised; IV: inverse variance; SD: standard deviation
.&p=BOOKS&id=535666_appif360.jpg "Click on image to zoom")
Figure 363Change in quality of life – CFQ-R treatment burden at 3 months followup (range of scores: 0–100)
Abbreviations: CI: confidence interval; CFQ-R: cystic fibrosis questionnaire revised; IV: inverse variance; SD: standard deviation
.&p=BOOKS&id=535666_appif361.jpg "Click on image to zoom")
Figure 364Change in quality of life – CFQ-R health perception at 3 months followup (range of scores: 0–100)
Abbreviations: CI: confidence interval; CFQ-R: cystic fibrosis questionnaire revised; IV: inverse variance; SD: standard deviation
.&p=BOOKS&id=535666_appif362.jpg "Click on image to zoom")
Figure 365Change in quality of life – CFQ-R social limitations at 3 months followup (range of scores: 0–100)
Abbreviations: CI: confidence interval; CFQ-R: cystic fibrosis questionnaire revised; IV: inverse variance; SD: standard deviation
.&p=BOOKS&id=535666_appif363.jpg "Click on image to zoom")
Figure 366Change in quality of life – CFQ-R body image at 3 months follow-up (range of scores: 0–100)
Abbreviations: CI: confidence interval; CFQ-R: cystic fibrosis questionnaire revised; IV: inverse variance; SD: standard deviation
.&p=BOOKS&id=535666_appif364.jpg "Click on image to zoom")
Figure 367Change in quality of life – CFQ-R role limitations at 3 months follow-up (range of scores: 0–100)
Abbreviations: CI: confidence interval; IV: inverse variance; SD: standard deviation

Figure 368Change in quality of life – CFQ-R weight problems at 3 months follow-up
Abbreviations: CI: confidence interval; CFQ-R: cystic fibrosis questionnaire revised; IV: inverse variance; SD: standard deviation

Figure 369Change in quality of life – CFQ-R respiratory symptoms at 3 months follow-up
Abbreviations: CI: confidence interval; CFQ-R: cystic fibrosis questionnaire revised; IV: inverse variance; SD: standard deviation

Figure 370Change in quality of life – CFQ-R digestion symptoms at 3 months follow-up
Abbreviations: CI: confidence interval; CFQ-R: cystic fibrosis questionnaire revised; IV: inverse variance; SD: standard deviation
Comparison 6. Combined inspiratory muscle training (IMT), resistance and aerobic training versus no exercise programme
%20at%202%20months%20follow-up%20(range%20of%20scores%3A%200%02013100).&p=BOOKS&id=535666_appif368.jpg "Click on image to zoom")
Figure 371Change in FEV1 (litres) at 2 months follow-up (range of scores: 0–100)
Abbreviations: CI: confidence interval; FEV1: forced expiratory volume in 1 second; IV: inverse variance; SD: standard deviation
%20at%202%20months%20follow-up%20(range%20of%20scores%3A%200%02013100).&p=BOOKS&id=535666_appif369.jpg "Click on image to zoom")
Figure 372Change in forced vital capacity (litres) at 2 months follow-up (range of scores: 0–100)
Abbreviations: SD: standard deviation; IV: inverse variance; CI: confidence interval
%20at%202%20months%20follow-up.&p=BOOKS&id=535666_appif370.jpg "Click on image to zoom")
Figure 373Change in weight (kg) at 2 months follow-up
Abbreviations: kg: kilograms; SD: standard deviation; IV: inverse variance; CI: confidence interval
%20at%202%20months%20follow-up%20(range%20of%20scores%3A%200%02013100).&p=BOOKS&id=535666_appif371.jpg "Click on image to zoom")
Figure 374Change in quality of life (CFQ-R children’s) at 2 months follow-up (range of scores: 0–100)
Abbreviations: CI: confidence interval; CFQ-R: cystic fibrosis questionnaire revised; IV: inverse variance; SD: standard deviation
Comparison 7. Physical activity: higher amount or longer duration versus lower amount or shorter duration
%20at%2012%20months%20follow-up.&p=BOOKS&id=535666_appif372.jpg "Click on image to zoom")
Figure 375Need of hospitalization (proxy outcome for time to next exacerbation) at 12 months follow-up
Abbreviations: M-H: Mantel-Haenszel; CI: confidence interval; PA: physical activity
I.21. Psychological assessment
Not applicable to this review.
I.22. Cross-infection control
I.22.1. Outpatient care
Comparison 1. Cohort segregation by clinic times versus no cohort segregation

Figure 37610 year incidence of P. Aeruginosa infections at 10 years follow-up
Abbreviations: CI: confidence interval; M-H: Mantel-Haenszel
4-year prevalence of MRSA at 4 years follow-up
Data could not be plotted
4-year prevalence of non-mucoid PA at 4 years follow-up
Data could not be plotted
4-year prevalence of mucoid PA at 4 years follow-up
Data could not be plotted
Staff compliance at 4 years follow-up
Data could not be plotted
Comparison 2. Cohort segregation by location versus no cohort segregation
Annual incidence of new growths of PA at 9 years follow-up
Data could not be plotted

Figure 377Yearly prevalence of chronic P. Aeruginosa infections at 9 years followup
Abbreviations: CI: confidence interval; M-H: Mantel-Haenszel

Figure 378Yearly prevalence of intermittent P. Aeruginosa infections at 9 years follow-up
Abbreviations: CI: confidence interval; M-H: Mantel-Haenszel
Comparison 3. Combination of protective equipment + individual segregation versus incomplete protective equipment + incomplete individual segregation
4-month prevalence of PA infections at 5 years follow-up
Data could not be plotted
4-month prevalence of MRSA infections at 5 years follow-up
Data could not be plotted
I.22.2. Inpatient care
Comparison 4. Cohort segregation by location versus no cohort segregation
Annual incidence of B. Cepacia Complex at 1 year follow-up
Data could not be plotted

Figure 3795-month incidence of hospital-associated colonization of P. Cepacia at 5 months follow-up
Abbreviations: CI: confidence interval; M-H: Mantel-Haenszel
Comparison 5. Individual segregation by location versus usual care
Patients’ satisfaction
Data could not be plotted
Parents’ satisfaction
Data could not be plotted
I.22.3. Combined inpatient and outpatient care
Comparison 6. Cohort segregation versus no cohort segregation

Figure 380Monthly incidence of multiply resistant PA strain at 1 month follow-up
Abbreviations: CI: confidence interval; M-H: Mantel-Haenszel

Figure 381Annual incidence of intermittent PA at 1 year follow-up
Abbreviations: CI: confidence interval; M-H: Mantel-Haenszel

Figure 382Annual incidence of chronic PA at 1 year follow-up
Abbreviations: CI: confidence interval; M-H: Mantel-Haenszel

Figure 3836-month incidence of B. Cepacia at 6 months follow-up
Abbreviations: CI: confidence interval; M-H: Mantel-Haenszel
Annual incidence of Burkholderia species infection at 1 year follow-up
Data could not be plotted

Figure 384Monthly prevalence of multiply resistant PA strain at 1 month follow-up
Abbreviations: CI: confidence interval; M-H: Mantel-Haenszel
Prevalence of AES-1 (PA epidemic strain) at 2 years follow-up
Data could not be plotted

Figure 385Annual prevalence of chronic PA infection at 1 year follow-up
Abbreviations: M-H: Mantel-Haenszel; CI: confidence interval

Figure 386Annual prevalence of transmissible PA infection at 1 year follow-up
Abbreviations: CI: confidence interval; M-H: Mantel-Haenszel
Annual prevalence of chronic infection with transmissible PA strain at 1 year follow-up
Data could not be plotted
Comparison 7. Complete cohort segregation versus incomplete cohort segregation
Annual incidence of Burkholderia species at 1 year follow-up
Data could not be plotted
Comparison 8. Individual segregation versus usual care
Patient satisfaction
Data could not be plotted
Comparison 9. Cohort segregation + individual segregation versus cohort segregation
Yearly prevalence of B. Cepacia complex infection at 1 year follow-up
Data could not be plotted
Yearly prevalence of Burkholderia species at 5 years follow-up
Data could not be plotted
Comparison 10. Cohort segregation + individual segregation + protective equipment versus usual care
Annual incidence of B. Cepacia complex infection at 1 year follow-up
Data could not be plotted
Comparison 11. Cohort segregation + individual segregation versus usual care
Patient satisfaction
Data could not be plotted
- Diagnosis of cystic fibrosis
- Information and support
- Service delivery
- Transition
- Complications of cystic fibrosis
- Monitoring for pulmonary disease
- Airway clearance techniques
- Mucoactive agents
- Pulmonary infection – prophylaxis
- Pulmonary infection – acute
- Pulmonary infection – chronic
- Immunomodulatory agents
- Nutritional interventions
- Exocrine Pancreatic insufficiency
- Distal intestinal obstruction syndrome
- Monitoring liver disease
- Ursodeoxycholic acid
- Monitoring for CF related diabetes
- Bone mineral density
- Exercise
- Psychological assessment
- Cross-infection control
- Forest plots - Cystic FibrosisForest plots - Cystic Fibrosis
Your browsing activity is empty.
Activity recording is turned off.
See more...