I.1. Introduction
The results of conventional meta-analyses of direct evidence alone (as presented in the GRADE profiles in chapter 11 and forest plots in appendix G.2.2) does not help inform which intervention is most effective in the treatment of acute migraine. The challenge of interpretation has arisen for two reasons:
In isolation, each pair-wise comparison does not inform the choice among the different acute treatment, in addition direct evidence is not available for some pair-wise comparisons in a randomised controlled trial (for example, NSAID vs ergot).
There are frequently multiple overlapping comparisons (for example, triptan vs NSAID, triptan vs triptan and NSAID and NSAID vs triptan and NSAID), that could potentially give inconsistent estimates of effect.
To overcome these problems, a hierarchical Bayesian network meta-analysis (NMA) was performed. This type of analysis allows for the synthesis of data from direct and indirect comparisons without breaking randomisation and allows for the ranking of different interventions. In this case, in order of efficacy, defined as:
the proportion of people achieving headache response at up to 2 hours
the proportion of people achieving freedom from pain at up to 2 hours
the proportion of people achieving sustained headache response at 24 hours
the proportion of people achieving sustained freedom from pain at 24 hours.
The analysis also provided estimates of effect (with 95% credible intervals) for each intervention compared to one another and compared to a single baseline risk (in this case the baseline treatment was triptan). These estimates provide a useful clinical summary of the results and facilitate the formation of recommendations based on the best available evidence. Furthermore, these estimates were used to parameterise treatment effectiveness in the de novo cost-effectiveness modelling presented in appendix K.
Conventional fixed effects meta-analysis assumes that the relative effect of one treatment compared to another is the same across an entire set of trials. In a random effects model, it is assumed that the relative effects are different in each trial but that they are from a single common distribution and that this distribution is common across all sets of trials.
Network meta-analysis requires an additional assumption over conventional meta-analysis. The additional assumption is that intervention A has the same effect on people in trials of intervention A compared to intervention B as it does for people in trials of intervention A versus intervention C, and so on. Thus, in a random effects network meta-analysis, the assumption is that intervention A has the same effect distribution across trials of A versus B, A versus C and so on.
This specific method is usually referred to as mixed-treatment comparisons analysis but we will continue to use the term network meta-analysis to refer generically to this kind of analysis. We do so since the term “network” better describes the data structure, whereas “mixed treatments” could easily be misinterpreted as referring to combinations of treatments.
I.2. Methods
I.2.1. Study selection and data collection
To estimate the relative risks, we performed an NMA that simultaneously used all the relevant RCT evidence from the clinical evidence review. As with conventional meta-analyses, this type of analysis does not break the randomisation of the evidence, nor does it make any assumptions about adding the effects of different interventions. The effectiveness of a particular treatment strategy combination will be derived only from randomised controlled trials that had that particular combination in a trial arm.
From the outset, we sought to minimise any clinical or methodological heterogeneity by focusing the analysis on RCTs with comparable routes of administration of treatments, identifying equivalent outcomes and including only RCTs that presented data for each headache attack treated (in cases where people treated multiple headache attacks with each intervention). All of the dosages of drugs in the included RCTs were within the therapeutic range as indicated by the BNF. In consultation with the GDG we chose to perform an NMA for acute treatment of migraine by oral, subcutaneous or nasal administration. The evidence on acute treatment by these routes included multiple comparisons and an NMA would allow us to synthesize the evidence in a more comprehensive way. Treatments administered by intravenous or intramuscular routes were excluded from this analysis as it was agreed these clinician administered treatments were not comparable with the other treatments which could be self-administered by participants.
As such, four networks of evidence were identified, defined by outcome measure:
Network 1: Proportion of people achieving headache response at up to 2 hours
Network 2: Proportion of people achieving freedom from pain at up to 2 hours
Network 3: Proportion of people maintaining sustained headache response at 24 hours
Network 4: Proportion of people maintaining sustained freedom from pain at 24 hours.
I.2.2. Outcome measures
The NMA evidence reviews for interventions considered four clinical efficacy outcomes identified from the clinical evidence review; headache response at 2 hours, pain free at up to 2 hours, sustained headache response at 24 hours and sustained pain free at 24 hours. Time to freedom from pain, percentage reporting serious adverse events and functional health status were not included in the list of outcome measures as they were infrequently reported across the studies. The GDG considered that headache response and pain freedom at 2 and 24 hours were the most important clinical outcomes for testing acute migraine treatment efficacy.
Outcome measures were calculated on an available case basis (i.e. the analysis was based on the number of analysed headache attacks), regardless of how the original study investigators analysed their data. Using available case analysis was most appropriate for these studies due to the numbers of people randomised who then did not suffer from a headache attack during the study period, and therefore would count as missing data had intention to treat analysis been used.
I.2.3. Comparability of interventions
The interventions compared in the model were those found in the randomised controlled trials included in the clinical evidence review already presented in chapter 11 of the full guideline and in appendix E. If an intervention was evaluated in a study that met the inclusion criteria for the network (that is if it reported at least one of the outcomes of interest and matched the inclusion criteria for the meta-analysis) then it was included in the network meta-analysis, otherwise it was excluded.
The treatments included in each network are shown in .
Treatments included in network meta-analysis.
The details of these interventions can be found in the clinical evidence review in chapter 11 of the full guideline and evidence tables in appendix E.
I.2.4. Baseline risk
The baseline risk is defined here as the adult or young person’s risk of achieving the outcome of interest (headache response, freedom from pain, sustained headache response, sustained freedom from pain) in the “control” group. This figure is useful because it allows us to convert the results of the NMA from odds ratios to relative risks.
Baseline odds were derived by the logistic regression in WinBUGS. This approach has the advantage that baseline and relative effects are both modelled on the same log odds scale, and also ensures that the uncertainty in the estimation of baseline and relative effects is accounted for in the model. This method produced baseline odds [mean (SD)] of 0.36 (0.17) for headache response at up to two hours, −0.89 (0.12) for freedom from pain at up to 2 hours, −0.37 (0.23) for sustained headache response at 24 hours and −1.42 (0.16) for sustained freedom from pain at 24 hours.
I.2.5. Statistical analysis
A hierarchical Bayesian network meta-analysis (NMA) was performed using the software WinBUGS. We adapted a three-arm random effects model template for the networks, from the University of Bristol website (https://www.bris.ac.uk/cobm/research/mpes/mtc.html). This model accounts for the correlation between study level effects induced by multi-arm trials.
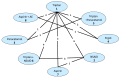
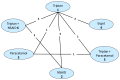
In order to be included in the analysis, a fundamental requirement is that each treatment is connected directly or indirectly to every other intervention in the network. For each outcome subgroup, a diagram of the evidence network was produced in – and presented in section I.3.
Network for headache response at up to 2 hours. AE=Antiemetic
Network for sustained freedom from pain at 24 hours.
Network for freedom from pain at up to 2 hours. AE=Antiemetic
Network for sustained headache response at 24 hours.
The model used was a random effects logistic regression model, with parameters estimated by Markov chain Monte Carlo simulation. As it was a Bayesian analysis, for each parameter the evidence distribution is weighted by a distribution of prior beliefs. A non-informative prior distribution was used to maximise the weighting given to the data. These priors were normally distributed with a mean of 0 and standard deviation of 10,000.
For the analyses, a series of 50,000 burn-in simulations were run to allow convergence and then a further 100,000 simulations were run to produce the outputs. Convergence was assessed by examining the history and kernel density plots.
We tested the goodness of fit of the model by calculating the residual deviance. If the residual deviance is close to the number of unconstrained data points (the number of trial arms in the analysis) then the model is explaining the data well.
The results, in terms of relative risk, of pair-wise meta-analyses are presented in the clinical evidence review (Chapter 11, and Appendix G.2.2).
The aim of the NMA was to calculate treatment specific log odds ratios and relative risks for response to be consistent with the comparative effectiveness results presented elsewhere in the clinical evidence review and for ease of interpretation. Let BO,,
and p denote the baseline odds, treatment specific odds, treatment specific log odds ratio and absolute probability respectively. Then:
And:
Once the treatment specific probabilities for response are calculated, we divide them by the baseline probability (pb) to get treatment specific relative risks (rrb):
This approach has the advantage that baseline and relative effects are both modelled on the same log odds scale, and also ensures that the uncertainty in the estimation of both baseline and relative effects is accounted for in the model.
We also calculated the overall ranking of interventions according to their relative risk compared to control group and counting the proportion of simulations of the Markov chain in which each intervention had the highest relative risk.
Due to the skewness of the data, the NMA relative risks and rank results are reported as medians rather than means (as in the direct comparisons) to give a more accurate representation of the ‘most likely’ value.
A key assumption behind NMA is that the network is consistent. In other words, it is assumed that the direct and indirect treatment effect estimates do not disagree with one another. Discrepancies between direct and indirect estimates of effect may result from several possible causes. First, there is chance and if this is the case then the network meta-analysis results are likely to be more precise as they pool together more data than conventional meta-analysis estimates alone. Second, there could be differences between the trials included in terms of their clinical or methodological characteristics. Differences that could lead to inconsistency include:
Different populations (e.g. gender, age)
Different interventions (doses)
Different routes of administration.
This heterogeneity is a problem for network meta-analysis but may be dealt with by subgroup analysis, meta-regression or by carefully defining inclusion criteria. Inconsistency, caused by heterogeneity, was assessed subjectively by comparing the relative risks from the direct evidence (from pair-wise meta-analysis) to the relative risks from the combined direct and indirect evidence (from NMA). We assumed the evidence to be inconsistent where the relative risk from the NMA did not fit within the confidence interval of the relative risk from the direct comparison. No inconsistency was identified.
I.3. Results
A total of 19 studies from the original evidence review met the inclusion criteria for at least one network. – show the four networks created by eligible comparisons for each NMA. The number on the line linking two treatments indicates the number of studies included that assessed that direct comparison.
The trial data from the 18 studies included in the NMA for headache response at up to 2 hours are shown in . The trial data from the 13 studies included in the NMA for pain free at up to 2 hours are presented in . The trial data from the six studies included in the NMA for sustained headache response at 24 hours are presented in . Data from the six studies for the NMA for sustained pain free at 24 hours are presented in .
Study data for headache response at up to 2 hours.
Study data for freedom from pain at up to 2 hours.
Study data for sustained headache response at 24 hours.
Study data for sustained freedom from pain at 24 hours.
Eighteen studies were included for headache response at up to 2 hours (). The minimum age of participants in all studies was 18 years with the exception of Misra (2007) 561,562 which included children aged 12 years and older, but had a mean age of 30.5, range 16 – 58).
The majority of treatments were oral administration, with the exception of Winner (1996) 855,857 in which both triptan and ergot were administered by subcutaneous injection into the thigh. All treatments, whether oral or subcutaneous, were self-administered by the participants themselves and were given in accordance with the usual therapeutic dosages as recommended by the British National Formulary (BNF)402.
Fourteen studies were included for pain free at up to 2 hours (). The minimum age of participants in all studies was 18 years with the exception of Misra (2007) 561,562 which included children aged 12 years and older, but had a mean age of 30.5, range 16 – 58).
All treatments were administered orally and were given in accordance with the usual therapeutic dosages as recommended by the BNF402.
Six studies were included for sustained headache response at 24 hours (). The minimum age of participants in all studies was 18 years.
The majority of treatments were oral administration, with the exception of Touchon (1996) 855,857 in which the triptan was administered as a subcutaneous injection into the thigh and ergot was in the form of a nasal spray. All treatments, whether oral, nasal or subcutaneous, were self-administered by the participants themselves and were given in accordance with the usual therapeutic dosages as recommended by the BNF402.
Six studies were included for sustained pain free at 24 hours (). The minimum age of participants in all studies was 18 years.
All treatments were administered orally and were given in accordance with the usual therapeutic dosages as recommended by the BNF402.
I.3.1. Network 1: Headache response at up to 2 hours for acute treatment of migraine
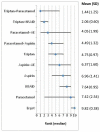
summarises the results of the conventional meta-analyses in terms of risk ratios generated from studies directly comparing different interventions, together with the results of the NMA in terms of risk ratios for every possible treatment comparison.
Risk ratios for headache response at up to 2 hours.
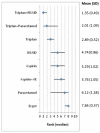
shows the rank of each intervention compared to the others. The rank is based on the relative risk compared to baseline and indicates the probability of being the best treatment, second best, third best and so on among the 10 different interventions being evaluated.
Rank order for treatments based on headache response at up to 2 hours. AE=Antiemetic
Based on the direct comparisons (first results column ), efficacy as assessed by headache response at up to 2 hours favours triptan over NSAID or ergot, triptan in combination with an NSAID over triptan or NSAID, paracetamol in combination with aspirin over triptan alone, triptan in combination with paracetamol over paracetamol alone and aspirin in combination with an antiemetic over ergot. No other treatment effects reached statistical significance. The random effects model used for the NMA is a relatively good fit, with a residual deviance of 55.55 reported. This corresponds fairly well to the total number of trial arms, 41.
The deviance information criteria (DIC) statistics are as follows in :
DIC for headache response at 2 hours – random effects.
No inconsistency was identified between the direct and NMA results for any comparison. All the median risk ratios from the NMA lie within the 95% confidence interval from the direct comparison of the same comparisons.
I.3.1.1. Evidence statements
A network meta-analysis of 18 studies comparing ten treatments suggested that triptan in combination with paracetamol is ranked as the best treatment, triptan in comination with an NSAID is ranked second, paracetamol in combination with an anti-emetic third, paracetamol in combination with aspsirin 4th, triptan 5th, aspirin in combination with an antiemetic 6th, aspirin 7th, NSAID 8th, paracetamol 9th and ergots ranked least effective at producing headache response at two hours, but there was considerable uncertainty.
A network meta-analysis of 18 studies comparing ten treatments suggested that NSAIDs, triptan in combination with paracetamol, paracetamol in combination with aspirin, triptan in combination with paracetamol, triptan in combination with an NSAID, triptan, aspirin, paracetamol in combination with aspirin and paracetamol in combination with an antiemetic are more effective than ergots in producing headache response at two hours.
A network meta-analysis of 18 studies comparing ten treatments suggested that triptan in combination with paracetamol is more effective than aspirin or paracetamol in producing headache response at two hours.
A network meta-analysis of 18 studies comparing ten treatments suggested that triptan in combination with an NSAID is more effective than triptan, NSAID, aspirin in combination with an antiemetic, aspirin in combination with paracetamol and aspirin as monotherapy in producing headache response at two hours.
A network meta-analysis of 18 studies comparing ten treatments suggested that paracetamol in combination with aspirin is more effective than triptan alone in producing headache response at two hours.
A network meta-analysis of 18 studies comparing ten treatments suggested that aspirin in combination with an antiemetic is more effective than ergots in producing headache response at two hours.
I.3.2. Network 2: Freedom from pain at up to 2 hours for the acute treatment of migraine
shows the rank of each intervention compared to the others. The rank is based on the relative risk compared to baseline and indicates the probability of being the best treatment, second best, third best and so on among the 8 different interventions being evaluated.
Rank order for treatments based on freedom from pain at up to 2 hours. AE=Antiemetic
Based on the direct comparisons (first results column ), efficacy as assessed by pain free at up to 2 hours favours triptan over NSAID or ergot, triptan in combination with an NSAID over triptan or NSAID alone, triptan in combination with paracetamol over paracetamol alone and aspirin in combination with an antiemetic over ergot. No other treatment effects reached statistical significance. The random effects model used for the NMA is a good fit, with a residual deviance of 40.22 reported. This corresponds well to the total number of trial arms, 33.
Risk ratios for freedom from pain at up to 2 hours.
The DIC statistics were as follows in :
DIC for freedom from pain at 2 hours – random effects.
No inconsistency was identified between the direct and NMA results for any comparison. All the median risk ratios from the NMA lie within the 95% confidence interval from the direct comparison of the same comparisons.
I.3.2.1. Evidence statements
A network meta-analysis of 13 studies comparing eight treatments suggested that triptan in combination with NSAID is ranked as the best treatment, paracetamol is ranked second, triptan third, NSAID and aspirin are joint 4th, aspirin in combination with an anstiemetic 6th, paracetamol 7th, and ergots were ranked as least effectiveat producing freedom from pain at two hours, but there was some uncertainty.
A network meta-analysis of 13 studies comparing eight treatments suggested that triptan is more effective than NSAIDs, ergots, aspirin and aspirin in combination with an antiemetic in producing freedom from pain at two hours.
A network meta-analysis of 13 studies comparing eight treatments suggested that NSAIDs, triptan in combination with paracetamol, triptan in combination with an NSIAD, paracetamol, aspirin or aspirin in combination with an antiemetic are more effective than ergots in producing freedom from pain at two hours.
A network meta-analysis of 13 studies comparing eight treatments suggested that triptan in combination with an NSAID are more effective than triptans, NSAIDs, paracetamol, aspirin and aspirin in combination with an antiemetic in producing freedom from pain at two hours.
A network meta-analysis of 13 studies comparing eight treatments suggested that triptan in combination with paracetamol is more effective than paracetamol alone and over ergot in producing freedom from pain at two hours.
I.3.3. Network 3: Sustained headache response at 24 hours for the acute treatment of migraine
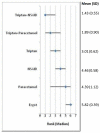
shows the rank of each intervention compared to the others. The rank is based on the relative risk compared to baseline and indicates the probability of being the best treatment, second best, third best and so on among the eight different interventions being evaluated.
Rank order for treatments based on sustained headache response at 24 hours.
Based on the direct comparisons (first results column ), efficacy as assessed by sustained headache response at 24 hours favours triptan over NSAID or ergot and triptan in combination with an NSAID over triptan or NSAID alone. No other treatment effects reached statistical significance. The random effects model used for the NMA is a very good fit, with a residual deviance of 13.3 reported. This corresponds very well to the total number of trial arms, 16.
Relative risk for sustained headache response at 24 hours.
The DIC statistics were as follows in :
DIC for sustained headache response at 24 hours – random effects.
No inconsistency was identified between the direct and NMA results for any comparison. All the median risk ratios from the NMA lie within the 95% confidence interval from the direct comparison of the same comparisons.
I.3.3.1. Evidence statements
A network meta-analsysis of six studies comparing six treatments suggested that triptan in combination with an NSAID is ranked as the best treatment, triptan in combination with paracetamol second, triptan third, NSAID 4th, paracetamol 5th and ergot as the least effective treatment in producing sustained headache response at 24 hours.
A network meta-analsysis of six studies comparing six treatments suggested that triptans are more effective than NSAIDs in producing sustained headache response at 24 hours.
A network meta-analsysis of six studies comparing six treatments suggested that triptan in combination with an NSAID are more effective than triptans or NSAIDs in producing sustained headache response at 24 hours.
A network meta-analsysis of six studies comparing six treatments suggested that NSAIDs, triptan, triptan in combination with paracetamol and triptan in combination with an NSAID are more effective than ergots in producing sustained headache response at 24 hours.
A network meta-analsysis of six studies comparing six treatments suggested that triptan in combnation with paracetamol and triptan in combination with an NSAID are more effective than paracetamol in producing sustained headache response at 24 hours.
I.3.4. Network 4: Sustained freedom from pain at 24 hours for the acute treatment of migraine
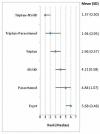
shows the rank of each intervention compared to the others. The rank is based on the relative risk compared to baseline and indicates the probability of being the best treatment, second best, third best and so on among the 8 different interventions being evaluated.
Median rank for sustained pain free at 24 hours.
Based on the direct comparisons (first results column ), efficacy as assessed by sustained headache response at 24 hours favours triptan over NSAID or ergot and triptan in combination with an NSAID over triptan or NSAID alone. No other treatment effects reached statistical significance. The random effects model used for the NMA is a very good fit, with a residual deviance of 13.91 reported. This corresponds very well to the total number of trial arms, 15.
Relative risks for sustained freedom from pain at 24 hours.
The DIC statistics were as follows in :
DIC for sustained freedom from pain at 24 hours – random effects.
No inconsistency was identified between the direct and NMA results for any comparison. All the median risk ratios from the NMA lie within the 95% confidence interval from the direct comparison of the same comparisons.
I.3.4.1. Evidence statements
A network meta-analysis of six studies comparing six treatments suggested that triptan in combination with an NSAID is the most effective treatment, triptan in combination with paracetamol second, triptan their, NSAID 4th, paracetamol 5th and ergot the least effective treatment at producing sustained freedom from pain at 24 hours.
A network meta-analysis of six studies comparing six treatments suggested that triptans are more effective than NSAIDs in producing sustained freedom from pain at 24 hours.
A network meta-analysis of six studies comparing six treatments suggested that triptan in combination with an NSAID is more effective than triptan or NSAIDs in producing sustained freedom from pain at 24 hours.
A network meta-analysis of six studies comparing six treatments suggested that triptans, NSAIDs, triptan in combination with paracetamol and triptan in combination with an NSAID are more effective than ergots in producing sustained freedom from pain at 24 hours.
I.3.5. Sensitivity analysis
The GDG were concerned that the effectiveness of subcutaneously administered treatments could be significantly greater than oral or nasal preparations and were concerned that inclusion of these studies could skew the results. Therefore, sensitivity analysis was conducted to test the robustness of including studies investigating sub-cutaneous administered treatments in the NMA. The following scenarios were tested in a sensitivity analysis:
Including all studies of patient administered treatments (as reported above)
Excluding studies of treatments administered via a subcutaneous route.
This only affected headache response at up to two hours and sustained headache response at 24 hours. There were no studies with subcutaneous treatments reporting pain free outcomes. Using 50,000 burn-in and 100,000 simulations, we found no important difference in the results between all the scenarios in goodness of fit and discrepancy or consistency of result. As the evidence mainly applied to oral treatments rather than subcutaneous, and the inclusion or exclusion does not affect the results, it was agreed that the economic model should be based on the analysis without subcutaneous treatment to reflect the available clinical evidence.
I.4. Discussion
Based on the results of conventional meta-analyses of direct evidence, as has been previously presented in chapter 11 and appendix G, deciding upon the most effective intervention for the acute treatment of migraine is difficult. In order to overcome the difficulty of interpreting the conclusions from these numerous separate comparisons, NMA of the direct evidence were performed.
Our analyses were based on a total of 19 studies of 10 different interventions (five monotherapy and five different combinations of two agents). The studies formed four networks of evidence each for a different outcome.
The findings from the NMA were used to facilitate the GDG in decision making when developing recommendations for the acute treatment of migraine.
In the first network of headache response at two hours all treatments were found to be superior to ergots; NSAID in combination with a triptan was superior to triptan alone, NSAID alone, aspirin, aspirin in combination with an antiemetic and paracetamol in combination with aspirin; triptan in combination with paracetamol was superior to NSAID, paracetamol and aspirin; triptan was found to be superior to NSAID and paracetamol in combination with aspirin was superior to NSAID.
In the ranking of treatments triptan in combination with paracetamol was ranked first although there is considerable uncertainty about this estimate as the credible intervals are quite wide. Triptan in combination with NSAID was ranked second, with much smaller credible intervals only spanning three ranking positions. The first four ranked treatments are all dual therapy combination.
In the second network of freedom from pain at two hours all treatments except paracetamol were found to be superior to ergots; NSAID in combination with a triptan was superior to triptan alone, NSAID alone, paracetamol, aspirin and aspirin in combination with an antiemetic; triptan in combination with paracetamol was superior to paracetamol alone and triptan was found to be superior to NSAID, aspirin and aspirin in combination with an antiemetic.
In the ranking of treatments triptan in combination with NSAID was ranked first. Triptan in combination with paracetamol was ranked second, however the credible intervals ranged from first to fifth so there is uncertainty in this estimate. Triptan was ranked third.
In the third network of sustained headache response at 24 hours all treatments except paracetamol were found to be superior to ergot; NSAID in combination with a triptan was superior to all other treatments included except triptan in combination with paracetamol in which case both were similarly effective; triptan in combination with paracetamol was superior to paracetamol alone and triptan was found to be superior to NSAID.
In the ranking of treatments triptan in combination with NSAID was ranked first. Triptan in combination with paracetamol was ranked second, however the credible intervals ranged from first to fourth so there is uncertainty in this estimate. Triptan was ranked third.
In the fourth network of sustained freedom from pain at 24 hours all treatments except paracetamol were found to be superior to ergot; NSAID in combination with a triptan was superior to all other treatments included except paracetamol alone and triptan in combination with paracetamol in which case both were similarly effective; triptan was found to be superior to NSAID.
In the ranking of treatments triptan in combination with NSAID was ranked first, however the credible intervals ranged from first to third and triptan in combination with paracetamol was ranked second with credible intervals ranging from first to fourth so there is uncertainty in both estimates. Triptan was ranked third.
The analysis compared all treatments to triptan, therefore this does not provide evidence of treatments that are not effective for acute treatment of migraine, but does provide a hierarchy of treatments that may be used.
All four networks seem to fit well, as demonstrated by residual deviance and no inconsistencies in the networks were found.
In summary, the four outcomes chosen for this analysis were considered to be the most important for assessing efficacy of acute treatments for migraine. Two of these outcomes (freedom from pain at 2 hours and sustained freedom from pain at 24 hours) also fed into the cost effectiveness analysis (see Appendix J:).
I.5. Conclusion
This analysis allowed us to combine the findings from many different comparisons presented in the reviews for acute treatment of migraine even when direct comparative data was lacking.
Overall, the results of all four networks showed that combination treatments, particularly triptan in combination with NSAID or triptan in combination with paracetamol are likely to be the most effective for the treatment of acute migraine.
It should be noted that this analysis does not take into account the adverse effect profile of these treatments, but the known profiles have been taken into account in the development of the associated recommendations.
I.6. WinBUGS codes
#Random effects model for multi-arm trials (any number of arms)
model{
for(i in 1:NS){
        w[i,1] <-0
                   mu[i] ~ dnorm(0,.0001)                                           # vague priors for 24 trial baselines
                   for (k in 1:na[i]) {
                         r[i,k] ~ dbin(p[i,t[i,k]],n[i,k])                                           # binomial likelihood
                                          logit(p[i,t[i,k]])<-mu[i] + d[t[i,k]] - d[t[i,1]]
# model

#Deviance residuals for data i
       rhat[i,k] <- p[i,t[i,k]] * n[i,k]
       dev[i,k] <- 2 * (r[i,k] * (log(r[i,k])-log(rhat[i,k])) + (n[i,k]-r[i,k]) * (log(n[i,k]-r[i,k]) - log(n[i,k]-rhat[i,k])))
                             }
              sdev[i]<- sum(dev[i,1:na[i]])
  }
d[1]<-0
for (k in 2:NT){d[k] ~ dnorm(0,.0001) }                       # vague priors for basic parameters
sd~dunif(0,2)                                            # vague prior for random effects standard deviation
tau<-1/pow(sd,2)
sumdev <- sum(sdev[])                                                             # Calculate residual deviance

#Calculation of absolute probabilities of success#

BR~dnorm(meanBR,precBR)
for (k in 1:NT){
                                                                                                  logit(T[k])<-BR + d[k]
                                                                    }

#Calculation of relative risks#

for (k in 1:NT){
                                                                                                            rr[k]<-T[k]/T[1]
                                                          }
# pairwise ORs
for (c in 1:(NT-1))
          { for (k in (c+1):NT)
                { lor[c,k] <- d[k] - d[c]
                   log(or[c,k]) <- lor[c,k]
                                                           lrr[c,k] <- log(rr[k]) - log(rr[c])
                                                           log(rrisk[c,k]) <- lrr[c,k]
                }
          }

# Ranking and prob164,164
for (k in 1:NT) {
              rk[k]<-NT+1-rank(d[],k)
best[k]<-equals(NT+1-rank(d[],k),1)}

}

# NT=no. treatments, NS=no. studies;
# NB : set up M vectors each r[,]. n[,] and t[,], where M is the Maximum number of treatments
#         per trial in the dataset. In this dataset M is 3.

Treatment code
1      Triptan
2      NSAID
3      Paracetamol
4      Ergot
5      Triptan+Paracetamol
6      Triptan+NSAID
7      Aspirin
8      Aspirin+AE
9      Paracetamol+Aspirin
10    Paracetamol+AE

###Analysis one- Sustained pain free at 2 hours###

###Data###

list(NS=13,NT=8,meanBR=-0.8928,precBR=68.64129)

r[,1] r[,2] r[,3] n[,1] n[,2] n[,3] t[,1] t[,2] t[,3] na[]
90 53 125 362 356 364 1 2 6 3
82 57 107 362 364 362 1 2 6 3
137 20 NA 415 197 1 1 4 NA 2
83 79 60 224 221 221 1 2 7 3
33 37 NA 135 146 1 1 7 NA 2
17 11 23 43 43 48 1 3 5 3
38 25 NA 182 182 1 1 4 NA 2
11 27 NA 132 134 1 4 8 NA 2
20 16 NA 53 53 1 1 2 NA 2
21 16 NA 42 43 1 1 2 NA 2
26 37 NA 90 90 1 1 6 NA 2
46 45 85 226 248 250 1 2 6 3
36 29 NA 122 135 1 1 8 NA 2
END

###Inits###
list(
d=c(NA,0,0,0,0,0,0,0),
sd=.2,
mu=c(3,-2,-2,0,-3,-2,1,1,-1,1,3,-3,-3))