

NCBI Bookshelf. A service of the National Library of Medicine, National Institutes of Health.
National Collaborating Centre for Cancer (UK). Colorectal Cancer: The Diagnosis and Management of Colorectal Cancer. Cardiff: National Collaborating Centre for Cancer (UK); 2011 Nov. (NICE Clinical Guidelines, No. 131.)

This publication is provided for historical reference only and the information may be out of date.

1. Introduction
The objective of this review and analysis was to identify and synthesise the evidence on the clinical and cost effectiveness of chemotherapy regimens containing irinotecan or oxaliplatin for the treatment of advanced colorectal cancer. Evidence on the use of irinotecan or oxaliplatin for the treatment of advanced colorectal cancer has been previously reviewed and appraised within the scope of NICE Technology Appraisal Guidance 93 (TA93). The current review includes both an update to identify new evidence that has become available after TA93 was issued (August 2005) and an expansion to the scope to address the following issues that were deemed by the GDG to be relevant to recent developments in clinical practice:
- the use of irinotecan or oxaliplatin in combination with the oral fluoropyrimidine capecitabine
- sequencing of combination chemotherapy (first and second line)
The current review does not address the use of targeted agents or the use of capecitabine as monotherapy for the treatment of advanced colorectal cancer. These topics are covered elsewhere in related NICE technology appraisal guidance.
The following chemotherapy regimens were considered relevant to this review:
- FOLFOX (oxaliplatin in combination with 5-flourouracil and folinic acid)
- FOLFIRI (irinotecan in combination with 5-flourouracil and folinic acid)
- XELOX (oxaliplatin in combination with capecitabine)
- XELIRI (irinotecan in combination with capecitabine)
- irinotecan as a single agent
The GDG identified ten sequences based on these chemotherapy regimens that were considered relevant to current clinical practice (Table A2.1). Sequences were limited to two lines of treatment.
Table A2.1
Summary of ten chemotherapy treatment sequences of interest.
The search for evidence included randomised controlled trials (RCTs) that reported on response, progression-free survival and overall survival for one or more of the chemotherapy regimens of interest as first-line treatment, second-line treatment or as part of a prospectively sequenced trial. Head-to-head RCTs were not available to inform all comparisons of interest. In addition, overall survival is likely to be influenced by the sequence of chemotherapy treatments; data on overall survival that was reported from studies conducted only in first line (with limited information about subsequent treatment) or only in second line (with limited information about prior treatment) was regarded with caution, thus further limiting the number of head-to-head comparisons available to inform this endpoint.
In order to facilitate a comparative analysis of all ten chemotherapy sequences, it was necessary to consider evidence that enabled indirect comparison of the treatments of interest. For example, if an RCT existed comparing two treatments A vs B, and another RCT existed comparing B vs C, however no RCT was identified comparing A vs C, then the evidence from the RCTs comparing A vs B and B vs C can be used to produce an indirect estimate of the relative effectiveness of A vs C. For the analysis of first-line treatment effects, both head-to-head trials (direct comparisons) as well as indirect comparisons were simultaneously considered as part of the evidence base to inform the estimate of effect size between 2 or more treatments of interest, therefore the analysis for first line is referred to as a mixed treatment comparison (MTC). To quantify second-line treatment effects and overall survival for sequences of chemotherapy, only a small number of relevant studies were identified as part of the evidence base. Each comparison was informed by using either direct evidence from a head-to-head trial or indirect evidence via a common comparator, but not by both types of evidence simultaneously. Therefore the second-line analysis is more accurately referred to as an indirect (rather than mixed) treatment comparison.
The motivations for applying mixed and indirect treatment comparison techniques to the present analysis include:
- Indirect comparisons allow estimation of treatment effects for comparisons that have not been trialled head-to-head, without breaking randomisation (Sutton et al. 2008)
- All ten treatment sequences of interest can be compared simultaneously using one consistent evidence base (for each outcome of interest). Consideration of both direct and indirect comparisons provides an opportunity to formally assess the consistency of the evidence
- Results of the analysis are needed to inform a comparative cost-effectiveness analysis of all ten treatment sequences of interest
Mixed and indirect treatment comparisons were modelled to estimate relative effects to a common baseline for the outcomes response rate, progression-free survival and overall survival. Important assumptions and methods underpinning the analysis are described in detail below. The analysis was performed using the Bayesian WinBUGS 1.4.3 software.
2. Quality of included studies
All studies that were identified for inclusion in the mixed or indirect treatment comparison were RCTs and were assessed using the NICE methodology checklist for randomised trials. This assessment showed that in almost all aspects the individual studies were of a high standard methodologically. The method of randomisation was adequate in most cases with only a small number of studies not providing details of the method used and in almost all cases, the groups were well balanced at baseline, primarily the result of stratification for key factors. It was not clear in any study however, whether there was adequate allocation concealment. It was therefore concluded that overall, there was a low risk of selection bias in the included studies.
In all studies patients in both arms received the same care apart from the treatment of interest, however none of the patients or treatment administrators was blinded as it was not possible given the type of treatments administered and methods of administration. Despite this however, it is unlikely that there was a high risk of performance bias overall as the studies were all comparing very similar treatments in comparable patients.
In the majority of studies, it was unclear how the individual arms were affected by patient drop outs or partial treatment administration. The median number of treatment cycles per arm was reported and in some studies a full study flow chart was provided which detailed the number of patients in each arm that received treatment, dropped out or were lost to follow-up. Median length (and in some cases, range) of follow up was reported in all studies and a number of studies also reported the length of time post recruitment that data were collected, however this information was for the whole patient group as opposed to each arm and it was not clear from any of the individual studies whether the length of follow-up was similar in both arms. There is a possibility that some studies might be affected by attrition bias, however, from the data that are reported, this seems unlikely.
3. Evidence synthesis methods
3.1. First-line treatment
A total of twenty-three studies reported the number of responders out of the total number of patients receiving each treatment as first-line therapy, corresponding to the network of evidence in Figure A2.1. A list of included studies is provided in Table A2.2.

Figure A2.1
MTC network of evidence used to inform response rate and progression-free survival for first-line treatments. Treatments in bold text are of primary interest to the analysis. A line between two treatments indicates a head-to-head comparison (RCT) exists; (more...)
Table A2.2
Studies that informed the MTC for response rate and progression-free survival for first-line treatments.
3.1.1. First-line response rate relative effects
We assumed that for each trial j, the number of events in arm k, rjk, has a binomial likelihood rjk~Bin(pjk,njk) where pjk is the probability of an event (response) in arm k of trial j and njk are the total number of patients in arm k of trial j. A random effects model for pjk was fitted on the logit scale, such that for each trial logit(pj1)=μj in the control arm (k=1) and logit(pjk)=μj+δjk, for the treatment arms (k=2 or 3 for three arm trials) with δjk representing the trial-specific log-odds ratio of the treatment in arm k relative to the control treatment in trial j and μj representing the study-specific effects (baseline effects). We fit a random effects MTC model, with FOLFOX as the reference treatment, under the assumption of consistency and homogeneous variance of the random effects (Lu and Ades, 2004).
Defining tjk as the treatment in arm k of trial j, the trial-specific log-odds ratios, δjk, are drawn from one of the random effects distributions δjk~N(d(tjk)−d(tj1),σ2) where d(tjk) is the relative treatment effect of the treatment tjk vs FOLFOX, k=1,2,3 and σ2 is the between-study heterogeneity. A vague inverse-gamma prior on σ2 was used since it resulted in faster convergence and smoother posterior densities than the alternative Uniform prior on σ. Posterior mean and median results were largely unaffected by the choice of prior distribution, but the estimates of σ2 varied slightly.
3.1.2. First-line response rate baseline calculation for absolute effects
In order to obtain absolute effects, it is necessary to obtain a baseline treatment effect for the reference treatment (FOLFOX), on which the relative treatment effects are applied. Any of the four first-line treatments of interest could be used as the reference treatment, however FOLFOX was chosen as it was the most frequently studied treatment out of the twenty-three available head-to-head trials. A separate meta-analysis (on the logit scale) was performed on just the FOLFOX arms of the fifteen trials comparing FOLFOX to any other drug (in first line). The predictive distributions of the log-odds of FOLFOX in a future trial were assumed to be normal with posterior means mA=−0.1119 and standard deviations sdA=0.3071. These results were then used in the MTC model to generate a baseline treatment effect for FOLFOX, A~Normal(mA, sdA2) on the log-odds scale on which relative effects were added at each iteration, to deliver the posterior summaries of the absolute probability of response for each treatment.
3.1.3. First-line progression-free survival relative effects
All twenty-three studies listed in Table A2.2 that reported response rates also provided data on disease progression (reported as progression-free survival or time to progression). In twelve of these studies, median PFS was accompanied by a hazard ratio (HR) with associated confidence interval (CI). The HR should be preferred to the median for survival analysis as it incorporates information on censoring (Tierney et al., 2007), so when both were available, the analysis was carried out on the log-hazard ratio (LHR). The data were transformed from HR into LHR and the standard error of the LHR obtained from the transformed CI by assuming an underlying normal distribution (Parmar et al.,1998).
When only the median PFS and its CI were available (five studies), these were log-transformed and the standard error of ln(median) calculated by assuming an underlying normal distribution (Parmar et al., 1998). Checks were made to ensure that the CI were symmetric on the log-median scale.
Six studies presented only the median PFS with no measure of uncertainty. In five of these studies (Colucci et al., 2005; Seymour et al., 2007; de Gramont et al., 2000; Gennatas et al., 2006; Douillard et al., 2000; Souglakos et al., 2006) a p-value for the log-rank test of a difference in the Kaplan-Meier curves was available. This was used to obtain an approximate LHR and standard error assuming the test statistic referred to a standard normal distribution and no censoring. Since no information was available on the number of observed events it was assumed that all analysed patients had progressed (Tierney et al., 2007). Saltz et al. (2000) did not present a p-value for the comparisons of interest but the number of patients at risk at different time points was available. Survival probabilities at each of the time points were read off the survival curves and a LHR and variance estimated following Williamson et al. (2002).
Let yjk represent the log-hazard ratio of the treatment in arm k of study j, relative to the treatment in arm 1 of trial j, and Wjk represent the variance of the corresponding LHR. For the 17 trials for which the LHR and standard error were available (from the publications or imputed), the likelihood was defined as
where δjk are the trial-specific LHR for each study, assumed to come from the random effects distribution above. A random effects mixed treatment comparisons (MTC) model was fitted, with FOLFOX as the reference treatment, under the assumption of consistency and homogeneous variance of the random effects, as above (Lu and Ades, 2004).
Let Mjk represent the median PFS in arm k of study j and Vjk represent the variance of ln(Mjk). Then, for the 5 trials where the media PFS is used, the median PFS is assumed to follow a log-normal distribution such that Mjk ~ log-Normal(mjk, Vjk), and
Assuming the underlying PFS in arm k of trial i has an exponential distribution with rate λjk, the expected value of the median of an exponential distribution is ln(2)/λjk and the HR of arm k compared to arm 1 in trial j is λjk/λj1. Further, the expected value from a log-normal distribution is exp(mjk + Vjk/2), therefore we can model the log-rates by taking
and ln(λjk)= μj+δjk with δjk~N(d(tjk)−d(tj1),σ2), for the treatment arms (k=2 or 3 for three arm trials) with δjk representing the trial-specific log-hazard ratio of the treatment in arm k relative to the control treatment in trial j and μj representing the study-specific effects (baseline effects). Note that the trial-specific LHR, δ, are assumed to be coming from the same random effects distributions, whether they refer to a study with data on the LHR directly or through the link function for studies with data given as medians with uncertainty.
3.1.4. First-line progression-free survival baseline calculation for absolute effects
In order to obtain absolute effects, it is necessary to obtain a baseline median PFS for FOLFOX, on which the relative treatment effects are applied. Of the fifteen studies comparing FOLFOX to any other treatment (in first line), six did not report any uncertainty measure for the median in the FOLFOX arm. We have therefore used only the nine studies for which a variance for the log-median could be extracted (Comella et al., 2009; Martoni et al., 2006,; Diaz-Rubio et al., 2007; Hochster et al., 2008; Ducreux et al., 2010; Tournigand et al., 2004; Comella et al., 2005; Giacchetti et al., 2000; Cunningham et al., 2009) to calculate the baseline PFS on FOLFOX. A separate meta-analysis was performed on the FOLFOX arms of these nine trials. The predictive distributions of the log-hazard of PFS on FOLFOX in a future trial were approximately normal with posterior means mA= −2.467 and standard deviations sdA= 0.1569. These results were then used in the MTC model to generate a baseline A~Normal(mA, sdA2) on the log-hazard scale on which relative effects were added at each iteration, to deliver the posterior summaries on the absolute log-hazard and hazard PFS and time to progression for each treatment.
3.2. Second-line treatment and sequences
The search for RCTs identified four studies in which two treatments of interest had been compared specifically as second-line chemotherapy (Table A2.3). However upon examination of the inclusion criteria for these studies, it was noted that all patients in these trials had received either single agent irinotecan or singe agent 5-fluorouracil as first-line treatment for advanced colorectal cancer. Therefore, these studies did not reflect the specific treatment sequences of interest to the current review and were excluded from the indirect treatment comparison analysis.
Table A2.3
Second-line studies that included patients who received first-line treatment outside the treatment sequences of interest and were therefore excluded from the indirect treatment comparison analysis.
The only other source of data on second-line response rates and PFS for the treatment sequences of interest was from prospectively sequenced studies. Three prospectively sequenced trials were available (Tournigand et al., 2004; Koopman et al., 2007; Seymour et al., 2007) and reported data on response rate and PFS after first and second line. However, Seymour et al. (2007) did not compare any sequences of interest or any sequences common to the other two trials, and was therefore excluded from the evidence space. The remaining trials provide evidence on only three of the ten sequences of interest and do not form a connected evidence network.
The endpoint overall survival was reported for all studies (first line, second line and prospectively sequenced). However, in the majority of the first-line studies, patients went on to receive a mix of second-line treatments. The second-line treatments offered were usually not pre-specified and rarely reported in sufficient detail. Furthermore, where some data was available on which second-line treatments were received by patients, the medians or HR for overall survival were not reported separately for the different treatments. Since we expect second-line treatment to influence overall survival (preliminary analyses, not shown, also suggested this was the case), it was not considered appropriate to use data on overall survival from first-line studies in which the patients who had second-line treatment received a mix of different chemotherapy to inform the analyses for specific treatment sequences. An exception to this was the Cunningham et al. (2009) trial that compared FOLFOX and 5-FU; although this was a first-line study, the protocol had pre-specified that patients who progressed on the first-line treatment should be offered irinotecan as second-line treatment. The trial further reported that a high proportion (over 75%) of patients received second-line irinotecan in both arms. It was therefore decided that this trial could be considered a ‘quasi-sequenced’ trial comparing the sequence FOLFOX followed by irinotecan to the sequence 5-FU followed by irinotecan. One other study (Porschen et al. 2007) also fulfilled these criteria. This was a first-line study of FOLFOX vs XELOX in which a high proportion of patients went on to receive irinotecan-based second-line treatment. This study was considered a ‘quasi-sequenced’ trial of FOLFOX followed by irinotecan vs XELOX followed by irinotecan. No other studies fulfilled the criteria for sequences of interest.
Even after inclusion of Cunningham et al. (2009) and Porschen et al. (2007) in the evidence base (Table A2.4), the network remains disconnected and still does not provide sufficient data to compare all sequences of interest. In discussion with members of the GDG, equivalence of the effectiveness of the oral and iv fluoropyrimidine formulations (capecitabine and 5-FU) was hypothesised. If data supported the assumption that the treatment effect of FOLFOX is the same as the treatment effect of XELOX, the treatment effect of FOLFIRI is the same as the treatment effect of XELIRI, and treatment effect of capecitabine is the same as the treatment effect of 5-FU in first and second line, this would allow the ten sequences of interest to reduce to only three sequences comprised of a fluoropyrimidine backbone combined with either oxaliplatin or irinotecan and irinotecan as a single agent in second line:
Table A2.4
Sequenced studies included in the MTC analysis to inform second-line response rate, progression-free survival and overall survival.
- FOLFOX or XELOX followed by FOLFIRI or XELIRI
- FOLFIRI or XELIRI followed by FOLFOX or XELOX
- FOLFOX or XELOX followed by single agent irinotecan
Exploratory analyses were conducted to confirm that this assumption was supported by the data on response and PFS. We checked if the 95% credible interval obtained from the first-line random effects MTC analysis for the HR of PFS included 1, which was the case for both XELOX vs FOLFOX and for XELIRI vs FOLFIRI. Similarly for response, the 95% credible interval for the OR for XELIRI vs FOLFIRI included 1, although for XELOX vs FOLFOX the upper limit did not (0.98). Although MTC analysis was not performed on studies that were only conducted in second line, data from Rothenberg et al. (2008) (comparing FOLFOX to XELOX) could still inform the equivalence of fluoropyrimidine-containing regimens. Analysis of this study showed that the 95% credible intervals for OR for response and HR for PFS both included 1.
Statistical models assuming equivalence of the effects of FOLFOX to XELOX, FOLFIRI to XELIRI and capecitabine to 5-FU were fitted for first -line response and PFS and were compared using the Deviance Information Criterion (DIC) to models that did not assume equivalence. These models were found to be similar in terms of model fit (DIC 83.2 for response and 54.4 for PFS, which were comparable to 83.6 and 56.1 respectively for the model not assuming equivalence).
Applying the above assumptions, this allowed us to form a connected evidence network shown in Figure A2.2. Since only one trial was available to inform each sequenced treatment comparison, a fixed effect model was fitted. It should be note that the assumption of equivalence in treatment effect between capecitabine and 5-FU was not extended to other aspects of treatment such as toxicity or cost. The latter parameters were not included in the indirect treatment comparison analysis and have been summarised elsewhere.
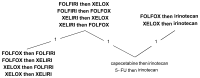
Figure A2.2
Network of sequenced studies to inform second-line response rate, progression-free survival and overall survival (assuming equivalent effect of capecitabine and 5-FU).
3.2.1. Second-line response rate and progression-free survival for sequences relative effects
Data on response rate and median PFS on second-line treatment for the sequences of interest were reported in Tournigand et al. (2004) and Koopman et al. (2007), but not in Cunningham et al. (2009) as the latter was a ‘quasi-sequenced’ study. However, Cunningham et al. (2009) did report that the median duration of second-line treatment was the same in both arms of this study. As patients usually continue treatment until disease progression (or unacceptable toxicity), we assumed that mean duration of treatment is highly correlated with PFS and imputed the HR of PFS on second-line treatment in the Cunningham et al. (2009) study as 1 (i.e. no difference in treatments). The standard error of the LHR was imputed as 0.1393 based on the relationship between the standard errors for all other LHRs and the study sample size, available from first and second-line studies both observed and imputed.
For the analysis of response rate on second-line treatment for a given sequence, rather than impute the number of patients responding to second-line treatment for the two arms of the trial, we imputed the LOR expected for this study, based on the relationship between all other observed LOR and the LHR for PFS in second line. The standard error for the LOR was imputed based on the relationship between all other available se(LHR) and the study sample size. The LOR of response on second line for the Cunningham et al. (2009) study was imputed as 0.03 with standard error=0.2492.
3.2.2. Overall survival for sequences relative effects
Two studies presented the HR and CI for overall survival. The analysis was carried out on the LHR for these studies with the standard error of the LHR obtained from the log-transformed CI by assuming an underlying normal distribution as above. One study reported only median overall survival and CI. These were log-transformed and the standard error of ln(median) calculated from the CI, as before.
The model used to combine the LHR and medians was the fixed effects version of the model used for first line data, so that for all trials for which the LHR and standard error were available, the likelihood was defined as
and for the trial in which median OS was reported, this was assumed to follow a log-normal distribution such that ln(Mjk) ~ Normal(mjk, Vjk), j=1, k=1,2, mjk=ln(ln2) − ln(λjk) − Vjk/2 as before, and ln(λjk)= μj+d(tjk)−d(tj1).
3.2.3. Second-line response rate, progression-free survival and overall survival baseline calculation for absolute effects
Only one sequenced study provided information on the absolute effect of FOLFOX (XELOX) followed by FOLFIRI (XELIRI) (Tournigand et al., 2004). The baseline value calculated in the model for this study was taken to be the absolute effect of this sequence on second-line response rate, PFS and overall survival. A further element of uncertainty was added so that the absolute effects were calculated as the absolute effect of FOLFOX (XELOX) followed by FOLFIRI (XELIRI) plus a random term E with E ~ N(0, sE2) where sE was the predictive standard deviation for a future trial with FOLFOX as first-line treatment (obtained from all the first-line data, as above).
A baseline median OS for FOLFOX based on the first-line studies was obtained as follows: of the fourteen studies comparing FOLFOX to any other treatment in first line, data on OS was not extractable for the relevant comparisons for Seymour et al. (2007); Martoni at al. (2006) had no data on OS and a further 5 trials did not have any measure of uncertainty around the median OS in the FOLFOX arm. We therefore used the remaining eight trials (Comella et al., 2009; Diaz-Rubio et al., 2007; Hochster et al., 2008; Ducreux et al., 2010; Comella et al., 2005; Giacchetti et al., 2000; Cunningham et al., 2009; Tournigand et al., 2004) to calculate the baseline OS when receiving FOLFOX in first line. A separate meta-analysis was performed on the FOLFOX arms of these eight trials. The predictive distributions of the log-hazard of OS of FOLFOX in a future trial were approximately normal with posterior means mA= −3.218 and standard deviations sdA= 0.4690. Therefore sE=0.3071, 0.1606 and 0.4690 for response, PFS and OS respectively.
3.3. Model criticism
The posterior mean of the residual deviance (ResDev) will be used to assess whether the MTC model is satisfactory in terms of fit to the data. The residual deviance is the deviance for the fitted model minus the deviance for the saturated model. In an adequately fitting model, each data point should contribute about 1 to the posterior mean residual deviance (Spiegelhalter et al., 2002), so the posterior mean of the residual deviance will be compared to the number of data points used to inform each analysis. Inspection of each data point’s contribution to the residual deviance can help identify data points contributing to the model’s poor fit.
3.4. Estimation
All posterior summaries were obtained using Markov chain Monte Carlo (MCMC) simulation implemented in the WinBUGS 1.4.3 software. The study effects, μi, and all relative treatment effects have been given vague priors: N(0,10000). For all random effects MTC models, a vague prior is assumed for the common variances so that, 1/σ2~Gamma(0.001,0.001). Sensitivity of the results to Uniform(0,10) prior for σ was assessed and this did not change the posterior means of the treatment effects, but did make the results more unstable. Results using the Gamma priors are quoted throughout.
Three chains were run until convergence according to the Brooks-Gelman-Rubin diagnostic tool (Brooks et al., 1998) and through inspection of the history plots. These “burn-in” simulations were then discarded, and a further 100,000 iterations run for three independent chains in the models for first line data. In models for sequences 200,000 iterations were run post-convergence since there was moderate auto-correlation between the treatment effect estimates. All inference is based on the posterior summaries from these combined chains.
4. Mixed and indirect treatment comparison results
Results are presented below for the MTC for first-line treatment response rate and PFS and for the indirect treatment comparison for second-line sequenced treatment response rate, PFS and overall survival. Both relative effects and absolute estimates are reported for each outcome.
4.1. First-line treatment response rate
The results for first-line treatment response rate are shown in Tables A2.5 and A2.6.
Table A2.5
Posterior median of odds ratio (OR) for response rate for first-line treatment with 95% credible interval and probability that each treatment is best out of the four treatments of interest. OR < 1 favours the reference treatment.
Table A2.6
Posterior summaries of the absolute response rate for first-line treatment (median with 95% credible interval).
The residual deviance for the random effects model used for the analysis of first-line response rates was 48.7 which, compared to 49 data points, suggests a good model fit.
In first line, there appears to be a small benefit in favour of FOLFOX with respect to response rate. XELIRI was associated with the second highest probability of being the best out of the four regimens, however as there was only one RCT to connect XELIRI to FOLFIRI in the evidence network, the estimate of effectiveness for XELIRI is associated with a high degree of uncertainty as seen by the width of the 95% credible interval.
4.2. First-line treatment progression-free survival
The results for first-line treatment progression-free survival are shown in Tables A2.7 and A2.8.
Table A2.7
Posterior summaries (median with 95% credible interval) of hazard ratio (HR) for PFS for first-line treatment and probability that each treatment is best out of the 4 treatments of interest. HR > 1 favours the reference treatment.
Table A2.8
Posterior summaries (median with 95% credible interval) of mean and median PFS for first-line treatment. Baseline effects are based on all the available FOLFOX arms and assumed underlying exponential distribution.
The residual deviance for the random effects model used for the analysis of first-line PFS was 33.0 which, compared to 31 data points, suggests a good model fit.
FOLFOX was associated with a 66% probability of being the most effective of the four regimens with respect to PFS, however the 95% credible intervals for the hazard ratios of all other treatments included 1 (no difference between treatments). The uncertainty surrounding the effectiveness of XELIRI in terms of PFS is again evident by the width of the 95% credible interval. Estimates of median PFS for first-line treatment ranged from 5.7 months for XELIRI to 8,2 months for FOLFOX.
4.3. Second-line treatment response rates for sequences
The results for second-line treatment response rate are shown in Tables A2.9 and A2.10.
Table A2.9
Posterior median of odds ratio (OR) for response rate for second-line treatment (in bold) as part of a sequence of treatments with 95% credible interval and probability that each second-line treatment is best out of the 3 regimens of interest, assuming (more...)
Table A2.10
Posterior summaries of the absolute response rate for second-line treatment (in bold) as part of a sequence of treatments (median with 95% credible interval).
The residual deviance for the fixed effects model used for the analysis of second-line response rates was 5.1 which, compared to 5 data points, suggests a good model fit.
Treatment with FOLFOX/XELOX in second line (following FOLFIRI/XELIRI in first line) was associated with significantly higher response rate than FOLFIRI/XELIRI in second line (following FOLFOX/XELOX in first line). Response rates for single agent irinotecan in second line were comparable to FOLFOX/XELOX in second line, however FOLFOX/XELOX were still the treatment options associated with the highest probability of being the most effective regimens in second line.
4.4. Second-line treatment progression-free survival for sequences
The results for second-line progression-free survival are shown in Tables A2.11 and A2.12.
Table A2.11
Posterior summaries (median with 95% credible interval) of hazard ratio (HR) for PFS for second-line treatment (in bold) as part of a sequences of treatments and probability that each second-line treatment is best out of the 3 regimens of interest, assuming (more...)
Table A2.12
Posterior summaries (median with 95% credible interval) of mean and median PFS for second-line treatment (in bold) as part of a sequence of treatments. Baseline effects are based on FOLFOX followed by FOLFIRI data with added uncertainty and assumed underlying (more...)
The residual deviance for the fixed effects model used for the analysis of second-line PFS was 5.0 which, compared to 5 data points, suggests a good model fit.
The reported hazard ratios favour FOLFIRI/XELIRI over FOLFOX/XELOX as a second-line treatment for the specified sequences. Estimates of median PFS for second-line treatment ranged from 2.5 months for FOLFOX/XELOX (when given after FOLFIRI/XELIRI in first line) to 4.2 months for FOLFIRI/XELIRI in second line (when given after FOLFOX/XELOX in first line).
4.5. Overall survival for sequences
The results for overall survival for sequences of treatment are shown in Tables A2.13 and A2.14.
Table A2.13
Posterior summaries (median with 95% credible interval) of hazard ratio (HR) for overall survival for sequences of treatment and probability that each sequence is best out of the 3 regimens of interest, assuming equivalence between the effect of capecitabine (more...)
Table A2.14
Posterior summaries (median with 95% credible interval) of mean and median OS for sequences of treatment, assuming equivalence between the effect of capecitabine and 5-FU. Baseline effects are based on FOLFOX followed by FOLFIRI data with added uncertainty (more...)
The residual deviance for the fixed effects model used for the analysis of overall survival was 4.0 which, compared to 4 data points, suggests a good model fit.
The estimate of median overall survival for all sequences in the indirect treatment comparison is approximately 21 months. There is a high degree of uncertainty in the estimates as seen by the wide 95% credible intervals, but nonetheless the analysis suggests with respect to overall survival, the effectiveness of all treatment sequences is comparable.
5. Cost-effectiveness analysis methods
A review of existing literature did not identify any published cost-effectiveness analyses that addressed all chemotherapy regimens and sequences of interest in the current guideline, therefore a new decision analytic model was developed alongside the MTC analysis.
A decision tree was constructed to reflect key events in the treatment pathway for advanced colorectal cancer patients in order to compare costs and health effects for the ten sequences of chemotherapy (Figure A2.3). In first line, patients receive one of four possible irinotecan or oxaliplatin-based combination chemotherapy regimens. Following disease progression on first-line treatment, the model allows for a proportion of patients to discontinue treatment. The remaining proportion of patients went on to receive one of five possible second-line treatments.

Figure A2.3
Basic structure of the cost-effectiveness model. The same structure was applied to all ten treatment sequences in the analysis.
Effectiveness was quantified in terms of quality-adjusted life years (QALYs). Survival time is partitioned in the model using the progression-free survival and overall survival results from the mixed and indirect treatment comparisons. While receiving chemotherapy, and prior to the onset of progressive disease, patients are assumed to be in a stable disease state. Following the point of progression in the model, patients are assumed to be in a progressive disease state with a lower overall quality of life. The model does not explore survival conditional on best response to treatment. This is because there was insufficient detail reported in the clinical literature to facilitate survival analysis dependent on tumour response.
The MTC analysis produced estimates of progression-free survival for each of the first-line treatments. Some assumptions (described in detail above) were made in order to create a connected evidence network to estimate second-line progression-free survival and overall survival for the treatment sequences of interest. Survival time was quality adjusted in the cost-effectiveness analysis using utility weights obtained from published sources.
For patients who only received one line of treatment, QALYs were calculated as follows:
For patients who received two lines of treatment, QALYs were calculated as follows:
where PFS1 = mean progression-free survival while on first-line treatment, PFS2 = mean progression-free survival while on second-line treatment and OS = mean overall survival for a given sequence of treatments for the combined population of patients receiving either one or two lines of treatment. The proportion of patients who went on to receive second-line treatment was reported in 15 studies (Colucci et al., 2005; Comella et al., 2005; Cunningham et al., 2009; Diaz-Rubio et al., 2007; Douillard et al., 2000; Goldberg et al., 2004; Goldberg et al., 2006; de Gramont et al., 2000; Kohne et al., 2005; Koopman et al., 2007; Martoni et al., 2006; Porschen et al., 2007; Seymour et al., 2007; Souglakos et al., 2006; Tournigand et al., 2004). This proportion was found to be approximately consistent (60%) across studies and also across different first-line treatments. As it was not possible to obtain separate overall survival curves for the subgroup of patients who only received one line of treatment and the subgroup of patients who received two lines of treatment, the QALY calculations above should be viewed as a weighted average of quality-adjusted survival across the combined patient population and not as separate absolute estimates of survival for each subgroup.
QALYs were further adjusted to take into account disutility associated with treatment-related toxicities. The toxicities included in the model were those that had considerable cost implications associated with management and/or measurable impact on patient well-being that could be quantified using disutility estimates available from published sources. Estimates of the rates of febrile neutropenia, Grade 3/4 diarrhoea and Grade 3/4 hand-foot syndrome were obtained from the clinical literature. It was not possible to conduct an MTC analysis using the available toxicity data, so mean rates of toxicity for each treatment were used to inform the cost-effectiveness model.
The model was developed from an NHS cost perspective. Costs in the model included drugs and drug administration, management of adverse events and supportive care. Given the relatively short time horizon of the model, discounting was not applied to either costs or health outcomes.
The model was made probabilistic to take into account the impact of parameter uncertainty on results. Probability distributions were created to reflect imprecision and Monte Carlo simulation was used to draw samples across all distributions. The decision tree was developed in TreeAge Pro 2009 software (TreeAge Software Inc, Williamstown, MA, USA).
6. Cost-effectiveness model inputs
6.1. Progression-free survival and overall survival
Details of the data sources, methods and results for estimating progression-free survival and overall survival using MTC techniques are presented above. For the cost-effectiveness analysis, a random sample of 30,000 simulations for first-line progression-free survival, second-line progression-free survival and overall survival estimates was obtained from the WinBUGS output. Rather than fitting a distribution to reflect uncertainty around the mean estimates for these parameters, simulations were inputted directly as chains into the cost-effectiveness model and sampled using Monte Carlo simulation.
6.2. Toxicity rates
Toxicity rates for febrile neutropenia, Grade 3/4 diarrhoea and Grade 3/4 hand-foot syndrome were obtained from the clinical literature that was identified during the systematic review for the MTC and are shown in Tables A2.15 and A2.16. Separate estimates were obtained for first-line treatment and second-line treatment. If there was insufficient data on second-line toxicity rates from prospectively sequenced studies, then studies conducted specifically in second line were included for the purpose of informing the cost-effectiveness analysis. Uncertainty in the estimates for toxicity rates was reflected by fitting beta distributions.
Table A2.15
First-line treatment toxicity rates used in the cost-effectiveness analysis.
Table A2.16
Second-line treatment toxicity rates used in the cost-effectiveness analysis.
6.3. Utility estimates
Utility estimates for stable (on treatment) and progressive disease were obtained from a published study of elicited preference values for health states associate with colon cancer (Best et al., 2010). The study was conducted using time trade-off techniques to elicit preferences from both patients and community members. The estimates for stable and progressive metastatic disease from the community sample only were applied in the cost-effectiveness model.
Disutility estimates to capture the impact of treatment-related toxicity on patient well-being for the specific regimens of interest in colorectal cancer were not available. Estimates obtained from a utility study conducted in metastatic breast cancer were used as a proxy (Lloyd et al., 2006). These estimates were applied in the cost-effectiveness model as utility decrements to the proportion of patients experiencing each of the toxicities.
Table A2.17 summarises the utility estimates used in the analysis.
Table A2.17
Utility values used in the cost-effectiveness analysis.
6.4. Drug costs
Information on drug doses for each treatment regimen was obtained from the literature. For some regimens, variations in dose or administration schedule were observed across studies. If inconsistency across studies was noted, then GDG input was obtained to confirm which doses were most reflective of current UK clinical practice (Table A2.18).
Table A2.18
Drug doses and administration schedule.
6.4.1. Drug cost per cycle
Drug cost per cycle was calculated based on cost data obtained from the British National Formulary assuming no wastage and an average body surface area of 1.75 m2 (NICE Developing Costing Tools Methods Guide January 2008). When available, the unit cost of non-proprietary formulations was used. An estimate of the cost of administration was obtained from NHS Reference Costs. Drug costs and drug administration costs per cycle are summarised in Tables A2.19 and A2.20.
Table A2.19
Drug cost per cycle.
Table A2.20
Drug administration cost per cycle.
6.4.2. Number of cycles
The duration of treatment in terms of number of cycles was extracted from the clinical literature (Table A2.21). For most first-line studies, the total number of cycles was reported and used to derive the mean number of cycles per patient. For second-line treatment and for XELIRI as first-line treatment, studies typically only reported the median number of cycles. For these estimates, uncertainty was reflected assuming a uniform distribution in the cost-effectiveness model.
Table A2.21
Number of treatment cycles.
6.5. Cost of adverse event management
Estimates of the cost of management of febrile neutropenia and severe diarrhoea were based on NHS reference costs (Table A2.22). The cost of management of hand-foot syndrome was not factored into the model as this is typically managed by interruption of treatment or dose-reduction (Gressett et al. 2006) so it was not possible to assess the impact on cost or effectiveness specifically attributable to this toxicity alone.
Table A2.22
Cost of management for febrile neutropenia and grade 3/4 diarrhoea.
6.6. Supportive care
Healthcare resource use associated with supportive care for advanced cancer patients was obtained from a UK study of the DIN-Link database (Guest et al., 2005). Estimates of resource use for GP visits, district nurse visits, outpatient visits and hospitalisations were obtained from this study while unit costs were based on more recent sources (Table A2.23). Supportive care costs were applied throughout the model during both active treatment and progressive disease.
Table A2.23
Supportive care costs.
6.7. Sensitivity analyisis
The cost-effectiveness model was analysed by performing Monte Carlo simulation, sampling 30,000 times from all available distributions and MTC chains. Mean costs and QALYs for each of the ten treatment sequences are reported, as well as the incremental cost-effectiveness ratio (ICER) for all treatment strategies that are not ruled out by dominance. Parameter uncertainty is propagated through the model using probabilistic sensitivity analysis and is reflected in the results shown in the cost-effectiveness acceptability curve (CEAC). The CEAC shows the probability that each treatment sequence is cost effective over a range of willingness to pay thresholds.
In addition to the base case analysis, a sensitivity analysis was run to assess the impact of drug discounts on the results of the cost-effectiveness model. Information on drug discounts was obtained from the NHS Commercial Medicines Unit (CMU) electronic Market Information Tool (eMIT), which provides suppliers with access pertaining to the generic pharmaceutical products that are covered within framework agreements (Table A2.24). The discounted prices are based on an estimate of NHS hospital-sector annual usage from English trusts for a given drug, the average (weighted arithmetic mean) price paid for that drug over the last four months of the period and a measure of the variance of that average (Department of Health, NHS Commercial Medicines Unit). At the time this modelling exercise was undertaken, discounted drug prices were available for all drugs included in the analysis except capecitabine.
Table A2.24
Comparison of list price and discounted drug cost per cycle.
7. Cost-effectiveness analysis results
7.1. Base case analysis
The total costs and total QALYs in the base case analysis for each of the ten sequences of chemotherapy are summarised in Table A2.25. Costs ranged from £16,285 for FOLFOX - irinotecan up to £18,568 for FOLFOX – XELIRI. Total QALYs ranged from 0.819 for XELIRI – XELOX up to 0.941 for FOLFOX – FOLFIRI. The scatter plot in Figure A2.4 shows the total costs and total QALYs across simulations for the ten sequences.
Table A2.25
Total costs and effectiveness by treatment strategy (in order of increasing cost).

Figure A2.4
Scatter plot showing total costs and total QALYs for all ten treatment sequences (only 1000 of 30,000 simulation results are shown).
Taking FOLFOX – irinotecan as the reference (least expensive) strategy, all other strategies were shown to be less effective and also more costly (i.e. dominated) except the sequence FOLFOX – FOLFIRI (Table A2.26 and Figure A2.5). Compared to the reference strategy, the sequence FOLFOX – FOLFIRI produces 0.019 more QALYs (equivalent to approximately 7 days in ‘perfect’ health) and incurs £2,051 in additional costs. This yields an incremental cost-effectiveness ratio (ICER) of £109,604/QALY, suggesting that at a willingness to pay (WTP) threshold of £20,000/QALY, the sequential strategy of FOLFOX – FOLFIRI is not cost effective.
Table A2.26
Incremental cost effectiveness results.

Figure A2.5
Cost-effectiveness plane showing all ten treatment sequences. The slope of the line connecting FOLFOX-irinotecan and FOLFOX-FOLFIRI indicates the incremental cost-effectiveness ratio (ICER).
The incremental cost effectiveness results presented above reflect the expected costs and effectiveness estimates for the treatment sequences of interest, however given uncertainty associated with many parameters in the model, we are also interested in the distribution over incremental costs, incremental effectiveness and the joint cost-effectiveness distribution (Briggs 2007). This is particularly relevant in the present analysis given that the differences in total QALYs between several strategies are small, with a number of data points lined up closely along the vertical axis of the cost-effectiveness plane which represents a difference in effectiveness of 0. Taking into account parameter uncertainty, probabilistic sensitivity analysis showed that simulation results for several sequences cross the vertical axis, suggesting there is a non-negligible probability that some sequences other than FOLFOX – FOLFIRI may also be equivalent or even more effective than the reference strategy. Cost-effectiveness acceptability curves (CEAC) can be used to show the probability of the various treatment options being cost effective over a range of WTP thresholds. The CEACs show that FOLFOX – irinotecan is consistently the strategy with the highest probability of being cost-effective, however as the WTP threshold increases, so does the probability that the sequences FOLFOX-FOLFIRI and XELOX-FOLFIRI are cost-effective (Figure A2.6).

Figure A2.6
Cost-effectiveness acceptability curves for the base case analysis.
7.2. Sensitivity analysis - drug discounts
If currently available data on the impact of price discounts for generic pharmaceutical products across the NHS are taken into account, FOLFOX-FOLFIRI remains the only non-dominated treatment strategy and the ICER falls to £47,801/QALY (Table A2.27).
Table A2.27
Cost-effectiveness results for non-dominated strategies taking into account price discounts for generic pharmaceutical products.
Probabilistic sensitivity analysis using discounted drug prices showed there is greater uncertainty about which strategy has the highest probability of being cost effective, as shown by the intersecting CEACs for FOLFOX-irinotecan, FOLFOX-FOLFIRI and XELOX-FOLFIRI over the range of WTP thresholds between approximately £20,000 and £50,000/QALY (Figure A2.7).

Figure A2.7
Cost-effectiveness acceptability curves using discounted drug prices.
8. Discussion
As the number of systemic treatment options for the management of colorectal cancer increases, and with more and more patients able to receive additional lines of chemotherapy, questions about the most effective way to use combinations and sequences of treatments have become relevant to current clinical practice. A systematic review was undertaken to identify new evidence that has become available since the publication of NICE Technology Appraisal 93 in 2005 on the clinical and cost-effectiveness of oxaliplatin and irinotecan-based chemotherapy. This evidence base was then used to conduct an integrated mixed treatment comparison and cost-effectiveness analysis to inform decision-making regarding optimal combinations and sequences of chemotherapy for the management of advanced colorectal cancer. Mixed treatment comparisons that draw on both direct and indirect evidence have become an important method to address decision problems that, often for feasibility reasons, cannot be practically answered by conducting further randomised controlled trials.
As a first-line treatment option, the mixed treatment comparison results suggest that FOLFOX was associated with a higher probability of being the most effective regimen with respect to both response rate and PFS. The small benefit in favour of FOLFOX was also evident when comparing second-line response rates, however was not the case with respect to second-line PFS. Perhaps most importantly, for the endpoint overall survival, the analysis showed no differences between the treatment sequences of interest.
The high level of uncertainty surrounding some of the results of the mixed treatment comparison are evident by the width of the 95% credible intervals. This is particularly evident in the estimates of effectiveness for XELIRI in first line where there was limited data available. To address the issue of sequencing of treatments, a decision was made to exclude evidence for which we could not be confident in determining that patients had received both first and second-line treatments that were of direct relevance to this analysis. The implication was that there were fewer studies to inform the second-line analysis of response rate, PFS and of overall survival. In order to connect the evidence network for sequences of treatment, a number of assumptions were required with respect to the equivalence of the effectiveness of the oral and iv fluoropyrimidine formulations. The validity of these assumptions were explored both by statistical methods and through discussion with GDG members.
The results of the mixed and indirect treatment comparisons were used as inputs to conduct a cost-effectiveness analysis. The cost-effectiveness analysis showed that when survival was quality-adjusted (taking into account both disease status and toxicities), the difference in total QALYs between the various sequential treatment strategies was in most cases modest. Taking FOLFOX-irinotecan as the reference (least costly) strategy, all other treatment sequences were found to be less effective (in terms of QALYs) and more costly except the sequence FOLFOX-FOLFIRI. The ICER comparing FOLFOX-FOLFIRI to FOLFOX-irinotecan was of £110K/QALY. When drug discounts were taken into account, the ICER for FOLFOX – FOLIRI vs FOLFOX-irinotecan fell to approximately £48K/QALY. Because of the small differences in total QALYs between strategies, it was important to consider how uncertainty may impact the results of the cost-effectiveness analysis. Taking parameter uncertainty and drug discounts into account, three strategies (FOLFOX-irinotecan, FOLFOX-FOLFIRI and XELOX-FOLFIRI) were associated with the highest probability of being cost effective.
References
- Best JH, Garrison LP, Hollingworth W, Ramsey SD, Veenstra DL. Preference values associated with stage III colon cancer and adjuvant chemotherapy. Quality of Life Research. 2010;19:391–400. [PubMed: 20084462]
- Briggs A, Claxton K, Sculpher M. Decision modelling for healh economic evaluation. Oxford University Press; Oxford: 2007.
- British National Formulary. [accessed 11 November 2010]. Available from http://bnf
.org/bnf/index.htm. - Brooks S, Gelman A. General methods for monitoring convergence of iterative simulations. Journal of Computational and Graphical Statistics. 1998;7:434–55.
- Colucci G, Gebbia V, Paoletti G, Giuliani F, Caruso M, Gebbia N, Cartenì G, Agostara B, Pezzella G, Manzione L, Borsellino N, Misino A, Romito S, Durini E, Cordio S, Di Seri M, Lopez M, Maiello E, Montemurro S, Cramarossa A, Lorusso V, Di Bisceglie M, Chiarenza M, Valerio MR, Guida T, Leonardi V, Pisconti S, Rosati G, Carrozza F, Nettis G, Valdesi M, Filippelli G, Fortunato S, Mancarella S, Brunetti C. Gruppo Oncologico Dell’Italia Meridionale. Phase III randomised trial of FOLFIRI versus FOLFOX4 in the treatment of advanced colorectal cancer: a multicentre study of the Gruppo Oncologico Dell’Italia Meridonale. Journal of Clinical Oncology. 2005;23(22):4866–4875. [PubMed: 15939922]
- Comella P, Massidda B, Filipelli G, Farris A, Natale D, Barberis G, Maiorino L, Palmeri S, Cannone M, Condemi G. Southern Italy Cooperative Oncology Group. Randomised trial comparing biweekly oxaliplatin plus oral capecitabine versus oxaliplatin plus iv bolus fluorouracil/leucovorin in metastatic colorectal cancer patients: results of the Southern Italy Cooperative Oncology Study 0401. Journal of Cancer Research and Clinical Oncology. 2009;135:217–26. [PubMed: 18719941]
- Comella P, Massidda B, Filippelli G, Palmeri S, Natale D. Oxaliplating plus high dose folinic acid and 5 fluorouracil i.v. bolus (OXAFAFU) versus irinotecan plus high dose folinic acid and 5-fluorouracil i.v. bolus (IRIFAFU) in patients with metastatic colorectal carcinoma: a Southern Italy Cooperative Oncology Group phase III trial. Annals of Oncology. 2005;16(6):878–886. [PubMed: 15837702]
- Cunningham D, Sirohi B, Pluzanska A, Utracka-Hutka B, Zaluski J, Glynne-Jones R, Koralewski P, Bridgewater J, Mainwaring P, Wasan H, Wang JY, Szczylik C, Clingan P, Chan RT, Tabah-Fisch I, Cassidy J. Two different first line 5 fluorouracil regimens with or without oxaliplatin in patients with metastatic colorectal cancer. Annals of Oncology. 2009;20:244–250. [PubMed: 18854549]
- Department of Health. Confirmation of Payment by Results (PbR) arrangements for 2010-11. Available from http://www
.dh.gov.uk /en/Publicationsandstatistics /Publications /PublicationsPolicyAndGuidance /DH_112284. - Department of Health. National Reference Costs 2008–09. Available from http://www
.dh.gov.uk /en/Publicationsandstatistics /Publications /PublicationsPolicyAndGuidance /DH_123459. - Department of Health, NHS Commercial Medicines Unit. Generic Pharmaceuticals electronic Market Information Tool (eMIT) WEB_VERSION_20100629. [accessed 21 December 2010]. Available from http://www
.cmu.nhs.uk /Medicines/Generic/Pages/eMIT.aspx. - Diaz-Rubio E, Tabernero J, Gomez-Espana A, Massutí B, Sastre J, Chaves M, Abad A, Carrato A, Queralt B, Reina JJ, Maurel J, González-Flores E, Aparicio J, Rivera F, Losa F, Aranda E. Spanish Cooperative Group for the Treatment of Digestive Tumors Trial. Phase III study of capecitabine plus oxaliplatin compared with continuous infusion fluorouracil as first line therapy in metastatic colorectal cancer: final report of the Spanish Cooperative Group for the treatment if digestive tumours trial. Journal of Clinical Oncology. 2007;25(27):4224–4230. [PubMed: 17548839]
- Douillard J, Cunnigham D, Roth A, Navarro, James RD, Karasek P, Jandik P, Iveson T, Carmichael J, Alakl M, Gruia G, Awad L, Rougier P. Irinotecan combined with fluorouracil compared with fluorouracil alone as first-line treatment for metastatic colorectal cancer: a multicentre randomised trial. Lancet. 2000;355(9209):1041–1047. [PubMed: 10744089]
- Ducreux M, Bennouna J, Hebbar M, Ychou M, Lledo G, Conroy T, Adenis A, Faroux R, Rebischung C, Bergougnoux L, Kockler L, Douillard JY. GI Group of the French Anti-Cancer Centers. Capecitabine plus oxaliplatin (XELOX) versus 5-fluorouracil/leucovorin plus oxaliplatin (FOLFOX-6) as first line treatments for metastatic colorectal cancer. International Journal of Cancer. 2010;128(3):682–690. [PubMed: 20473862]
- Falcone A, Ricci S, Brunetti I, Pfanner E, Allegrini G, Barbara C, Crinò L, Benedetti G, Evangelista W, Fanchini L, Cortesi E, Picone V, Vitello S, Chiara S, Granetto C, Porcile G, Fioretto L, Orlandini C, Andreuccetti M, Masi G. Gruppo Oncologico Nord Ovest. Phase III trial of infusional fluorouracil, leucovorin, oxaliplatin and irinotecan (FOLFOXIRI) compared with infusional fluorouracil, leucovorin and irinotecan (FOLFIRI) as first line treatment for metastatic colorectal cance: the GRUPPO Ocologico Nord Ovest. Journal of Clinical Oncology. 2007;25(13):1670–1676. [PubMed: 17470860]
- Gennatas C, Papaxoninis G, Michalaki V, Mouratidou D, Andreadis C, Tsavaris N, Pafiti A. A prospective randomised study of irinotecan (CPT-11), leucovorin (LV) and 5-fluorouracil (5FU) versus leucovorin and 5-fluorouracil in patients with advanced colorectal carcinoma. Journal of Chemotherapy. 2006;18(5):538–544. [PubMed: 17127232]
- Giacchetti S, Perpoint B, Zidani R, Le Bail N, Faggiuolo R, Focan C, Chollet P, Llory JF, Letourneau Y, Coudert B, Bertheaut-Cvitkovic F, Larregain-Fournier D, Le Rol A, Walter S, Adam R, Misset JL, Lévi F. Phase III multicenter randomised trial of oxaliplatin added to chronomodulated fluorouracil-leucovorin as first line treatment of metastatic colorectal cancer. Journal of Clinical Oncology. 2000;18(1):136–147. [PubMed: 10623704]
- Goldberg RM, Sargent DJ, Morton RF, Fuchs CS, Ramanathan RK, Williamson SK, Findlay BP, Pitot HC, Alberts S. Randomised controlled trial of reduced dose bolus fluorouracil plus leucovorin and irinotecan or infused fluorouracil plus leucovorin and oxaliplatin in patients with previously untreated metastatic colorectal cancer: A North American intergroup trial. Journal of Clinical Oncology. 2006;24(21):3347–3353. [PubMed: 16849748]
- Goldberg R, Sargent D, Morton R, Fuchs C, Ramanathan RK, Williamson SK, Findlay BP, Pitot HC, Alberts SR. A randomised controlled trial of fluourouracil plus leucovorin, irinotecan and oxaliplation combinations in patients with previously untreated metastatic colorectal cancer. Journal of Clinical Oncology. 2004;22(1):23–30. [PubMed: 14665611]
- de Gramont A, Figer A, Seymour M, Homerin M, Hmissi A, Cassidy J, Boni C, Cortes-Funes H, Cervantes A, Freyer G, Papamichael D, Le Bail N, Louvet C, Hendler D, de Braud F, Wilson C, Morvan F, Bonetti A. Leucovorin and flourouracil with or without oxaliplatin as first line treatment in advanced colorectal cancer. Journal of Clinical Oncology. 2000;18:2938–2947. [PubMed: 10944126]
- Gressett S, Stanford B, Hardwicke F. Management of hand-foot syndrome induced by capecitabine. Journal of Oncology Pharmacy Practice. 2006;12:131–141. [PubMed: 17022868]
- Guest J, Ruiz F, Greener M, Trotman I. Palliative care treatment patterns and associated costs of healthcare resource use for specific advanced cancer patients in the UK. European Journal of Cancer Care. 2006;15:65–73. [PubMed: 16441679]
- Hochster HS, Hart LL, Ramanathan RK, Childs BH, Hainsworth JD, Cohn AL, Wong L, Fehrenbacher L, Abubakr Y, Saif MW, Schwartzberg L, Hedrick E. Safety and efficacy of oxaliplatin and fluoropyrimidine regimens with or without bevacizumab as first line treatment of metastatic colorectal cancer: results of the TREE study. Journal of Clinical Oncology. 2008;26(21):3523–3529. [PubMed: 18640933]
- Kohne CH, De Greve J, Hartmann JT, Lang I, Vergauwe P, Becker K, Braumann D, Joosens E, Müller L, Janssens J, Bokemeyer C, Reimer P, Link H, Späth-Schwalbe E, Wilke HJ, Bleiberg H, Van Den Brande J, Debois M, Bethe U, Van Cutsem E. Irinotecan combined with infusional 5-fluorouracil/folinic acid or Capecitabine plus celecoxib or placebo in the first line treatment of patients with metastatic colorectal cancer. EORTC study 40015. Annals of Oncology. 2008;19:920–926. [PubMed: 18065406]
- Kohne CH, van Cutsem E, Wils J, Bokemeyer C, El-Serafi M, Lutz MP, Lorenz M, Reichardt P, Rückle-Lanz H, Frickhofen N, Fuchs R, Mergenthaler HG, Langenbuch T, Vanhoefer U, Rougier P, Voigtmann R, Müller L, Genicot B, Anak O, Nordlinger B. European Organisation for Research and Treatment of Cancer Gastrointestinal Group. Phase III study of weekly high dose infusional fluorouracil plus folinic acid with or without irinotecan in patients with metastatic colorectal cancer: European organisation for research and treatment of cancer gastrointestinal group study 40986. Journal of Clinical Oncology. 2005;23(22):4856–4865. [PubMed: 15939923]
- Koopman M, Antonini NF, Douma J, Wals J, Honkoop AH, Erdkamp FL, de Jong RS, Rodenburg CJ, Vreugdenhil G, Loosveld OJ, van Bochove A, Sinnige HA, Creemers GJ, Tesselaar ME, Slee PH, Werter MJ, Mol L, Dalesio O, Punt CJ. Sequential versus combination chemotherapy with Capecitabine, irinotecan, and oxaliplatin in advanced colorectal cancer (CAIRO): a phase III randomised controlled trial. Lancet. 2007;370(9582):135–142. [PubMed: 17630036]
- Lloyd A, Nafees B, Narewska J, Dewilde S, Watkins J. Health state utilities for metastatic breast cancer. British Journal of Cancer. 2006;95:683–690. [PMC free article: PMC2360509] [PubMed: 16967055]
- Lu G, Ades AE. Combination of direct and indirect evidence in mixed treatment comparisons. Statistics in Medicine. 2004;23:3105–3124. [PubMed: 15449338]
- Martoni AA, Pinto C, Di Fabio F, Lelli G, Rojas Llimpe FL, Gentile AL, Mutri V, Ballardini P, Giaquinta S, Piana E. Capecitabine plus oxaliplatin (XELOX) versus protracted 5-fluorouracil venous infusion plus oxaliplatin (PVIFOX) as first line treatment in advanced colorectal cancer: A GOAM phase II randomised study (FOCA trial). European Journal of Cancer. 2006;42(18):3161–3168. [PubMed: 17098421]
- Parmar M, Torri V, Stewart L. Extracting summary statistics to perform meta-analyses of the published literature for survival endpoints. Statistics In Medicine. 1998;17:2815–2834. [PubMed: 9921604]
- Porschen R, Arkenau HT, Kubica S, Greil R, Seufferlein T, Freier W, Kretzschmar A, Graeven U, Grothey A, Hinke A, Schmiegel W, Schmoll HJ. AIO Colorectal Study Group. Phase III study of capecitabine plus oxaliplatin compared with fluorouracil and leucovorin plus oxaliplatin in metastatic colorectal cancer: A final report of the AIO colorectal study group. Journal of Clinical Oncology. 2007;25(27):4217–4223. [PubMed: 17548840]
- Seymour MT, Maughan TS, Ledermann JA, Topham C, James R, Gwyther SJ, Smith DB, Shepherd S, Maraveyas A, Ferry DR, Meade AM, Thompson L, Griffiths GO, Parmar MK, Stephens RJ. FOCUS Trial Investigators; National Cancer Research Institute Colorectal Clinical Studies Group. Different strategies of sequential and combination chemotherapuy for patients with poor prognosis advanced colorectal cancer (MRC FOCUS): a randomised controlled trial. Lancet. 2007;370(9582):143–152. [PubMed: 17630037]
- Saltz L, Cox J, Blanke C, Rosen L, Fehrenbacher L, Moore MJ, Maroun JA, Ackland SP, Locker PK, Pirotta N, Elfring GL, Miller LL. Irinotecan plus fluorouracil and leucovorin for metastatic colorectal cancer. New England Journal of Medicine. 2000;343(13):905–915. [PubMed: 11006366]
- Souglakos J, Androulakis N, Sygrigos K, Polysos A. FOFLFOXIRI (folinic acid, 5 fluorouracil, oxaliplatin and irinotecan) versus (folinic acid, 5 fluorouracil and irinotecan) as first line treatment in metastatic colorectal cancer (MCC): a multicentre randomised phase III trial from the Hellenic Oncology Research Group (HORG). British Journal of Cancer. 2006;94(6):798–805. [PMC free article: PMC2361370] [PubMed: 16508637]
- Spiegelhalter D, Best N, Carlin B, van der Linde A. Bayesian measures of model complexity and fit. Journal of the Royal Statistical Society (B). 2002;64:583–616.
- Sutton A, Ades A, Cooper N, Abrams K. Use of indirect and mixed treatment comparisons for technology assessment. Pharmacoecnomics. 2008;26:753–767. [PubMed: 18767896]
- Tierney J, Stewart L, Ghersi D, Burdett S, Sydes M. Practical methods for incorporating summary time-to-event data into meta-analysis. Trials. 2007;8:16. [PMC free article: PMC1920534] [PubMed: 17555582]
- Tournigand C, Andre T, Achille R, Lledo G, Flesh M, Mery-Mignard D, Quinaux E, Couteau C, Buyse M, Ganem G, Landi B, Colin P, Louvet C, de Gramont A. FOLFIRI followed by FOLFOX6 or the reverse sequence in advanced colorectal cancer: A randomised GERCOR study. Journal of Clinical Oncology. 2004;22(15):229–237. [PubMed: 14657227]
- Unit Costs of Health and Social Care. 2009. Available from http://www
.pssru.ac.uk. - Williamson P, Smith C, Hutton J, Marson A. Aggregate data meta-analysis with time-to-event outcomes. Statistics In Medicine. 2002;21:3337–3351. [PubMed: 12407676]
- Mixed treatment comparison and cost-effectiveness analysis for sequences of oxal...Mixed treatment comparison and cost-effectiveness analysis for sequences of oxaliplatin and irinotecan-based chemotherapy in the treatment of advanced and metastatic colorectal cancer - Colorectal Cancer
- Colorectal CancerColorectal Cancer
- SORD [Aquila chrysaetos chrysaetos]SORD [Aquila chrysaetos chrysaetos]Gene ID:115341687Gene
Your browsing activity is empty.
Activity recording is turned off.
See more...