

NCBI Bookshelf. A service of the National Library of Medicine, National Institutes of Health.
National Research Council (US) Committee on Population; Moffitt RA, editor. Welfare, The Family, And Reproductive Behavior: Research Perspectives. Washington (DC): National Academies Press (US); 1998.
Welfare, The Family, And Reproductive Behavior: Research Perspectives.
Show detailsChristine A. Bachrach
Changes in marriage and childbearing have substantially reshaped the American family in recent decades, with consequences for the economic well-being of children, the composition and stability of families, and the complexity of family relations. Increasing rates of out-of-wedlock childbearing, especially visible among teenagers, have become a focal point of public concern and social policy debate. Some observers have suggested that these changes result in part from the effect of welfare programs—programs that, it is believed, encourage sex and childbearing outside of marriage and discourage young people from marrying and staying married. A careful assessment of scientific evidence regarding the role of welfare in stimulating out-of-wedlock childbearing or other demographic changes must begin with a thorough understanding of the nature of the changes themselves, including what demographic behaviors have changed and how, and how these changes have been distributed within our population.
This chapter provides an overview of trends in fertility, marriage, and out-of-wedlock childbearing in the United States, focusing mainly on the period since 1970. It also examines trends in the proximate factors that affect fertility, such as sexual behavior, contraception and abortion, because if welfare programs have affected fertility among unmarried women, the effects would have to be channeled through one or more of these factors. The paper concludes with a brief look at trends in out-of-wedlock childbearing among populations that vary in their reliance on welfare programs.
Several conclusions are advanced: that changes in marriage have played a central role in driving the increase in nonmarital births; that changes in marriage have included not only changes in its frequency and timing but also changes in its function of defining acceptable settings for sexual activity and childbearing; that all population groups have participated in these changes but that the changes have occurred at different rates in different groups; and that despite the ubiquitous nature of these changes, out-of-wedlock childbearing remains powerfully associated with socioeconomic disadvantage.
What is Happening to Fertility?
A quick glance at trends in the U.S. fertility rate (Figure 2-1) reveals that, since the early 1970s, American women in the aggregate have been bearing children at a remarkably stable rate. The fertility rate (the number of births per 1,000 women of childbearing age, 15–44) has hovered between about 65 and 70 since 1973 when it fell below 70 for the first time since the Great Depression. The intervening period from 1940 to 1970 saw, first, increasing fertility rates, culminating with the peak of the baby boom in the late 1950s, and then steadily declining rates until the early 1970s (Ventura et al., 1995a). Since then, the overall patterns have remained remarkably stable, with the exception of a slight rise at the end of the 1980s, now apparently on its way toward reversal (National Center for Health Statistics, 1996).
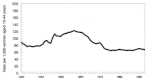
Figure 2-1
Fertility rates, United States: 1930–1993. NOTE: Beginning with 1959, trend lines are based on registered live births; trend lines for 1930–1959 are based on live births adjusted for under registration. SOURCE: National Center for Health (more...)
Beneath the surface of this demographic nontrend, however, lurk some important changes. One of these is the pattern of birth timing. Norman Ryder showed that trends in period fertility rates are a function of the number of births women have and the timing of those births (Ryder, 1980). Over the past two decades, there has been little variation in the number of births women have—first and second births have accounted for about 75 percent of the total fertility rate since the mid-1970s (Morgan, 1996). However, there is much more diversity now in when women are having children.
Figure 2-2 contrasts the age-specific birth rates in 1972 and 1993—two years in which the total fertility rate (a function of the sum of these rates) was quite similar (2,010 and 2,046, respectively). In 1972, the likelihood of giving birth peaked in the early twenties and declined steeply after age 30. In 1993, birth rates among women under age 30 had declined relative to their 1972 levels; the peak age of childbearing had shifted to the late twenties by a slight margin, and the risks of giving birth during the thirties had increased by about one-third. The fertility of women aged 30 and older accounted for 29.2 percent of the total fertility rate in 1993, up from 22.6 percent in 1972. Despite stability in the volume of childbearing, a substantial shift toward a later and more variable pattern of birth timing had occurred.
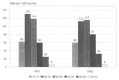
Figure 2-2
Age-specific birth rates: 1972 and 1993. SOURCE: Ventura et al. (1995a).
It's worth noting that birth rates for teenagers (15–19) were stable or declining through most of the 1970s and 1980s, despite the attention given to the problem of teen childbearing during this period. Teens did participate disproportionately in the fertility ''boomlet" of the late 1980s, with rates for women 15–19 rising 23 percent over a period of 3–4 years beginning in 1987, compared to 8 percent among women in their twenties. However, the most important change in teen fertility over this period is a change shared by older women as well—the increasing proportion of births that occurred outside of marriage. Trends in marriage patterns are a critical element of this change, and I turn to them next.
Marriage: Delays and Declines
U.S. marriage statistics for the past quarter century paint a grim picture of an institution that Americans continue to say they value highly. During a period when the proportion of high school seniors claiming that a good marriage is "quite or extremely important" to them held steady at over 90 percent for women and over 85 percent for men (Thornton, 1989), marriage rates appeared to be in free-fall. The marriage rate for unmarried women aged 15 and older has been declining since the early 1970s, when it had a modest resurgence following another steady decline from the postwar peak (Figure 2-3).
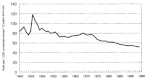
Figure 2-3
Marriage rates: 1940–1994. SOURCE: Clarke (1995).
These overall rates tell only part of the story however. The total first-marriage rate for women (which shows the percentage that would ever marry if subjected throughout their lives to the current year's regime of age-specific rates) declined prior to the mid-1970s but remained fairly stable between 68 percent and 72 percent from the mid-1970s to 1990, the last year for which data are available from the Vital Registration System1 (Clarke, 1995). As in the case of fertility, what has changed most dramatically is the timing of marriage. First marriage rates for women aged 18–19 plummeted from 151 per 1,000 in 1970 to 53 per 1,000 in 1990 (Figure 2-4). Rates for women aged 20–24 fell from 220 per 1,000 to 93 per 1,000 during the same period. Rates for women in their late twenties and early thirties changed far less, declining during the 1970s but increasing during the 1980s. Among men, trends in marriage were roughly similar, although men have shown no signs of the rebounding marriage rates observed during the 1980s among women in their late twenties and thirties.
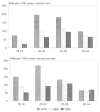
Figure 2-4
First-marriage rates, by age and sex: Marriage Registration Area, 1970, 1980, and 1990.
Data from the Current Population Survey provide another view of marriage trends based on repeated surveys of large probability samples of all households in the United States.2 In Figure 2-5, these data show that the proportions of men and women aged 18–44 who are unmarried has increased steadily in all age groups since 1970 and that increases in the percentage unmarried have been particularly steep among those in their twenties—ages at which, as we have seen previously, fertility rates are at their highest. For example, the percentage of unmarried among women aged 20–24 increased 75 percent, from 39 percent to 69 percent between 1970 and 1984; the percentage unmarried among men aged 25–29 more than doubled, from 22 percent to 55 percent (Department of Health and Human Services, 1995; Saluter, 1996).
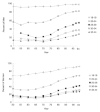
Figure 2-5
Percentage unmarried by age: 1910–1994. SOURCE: Department of Health and Human Services (1995).
Two qualifying observations are necessary to fill out this picture of declining marriage and increasing singlehood. First, the chosen starting point for this review of recent demographic trends, 1970, marks the end of a highly unusual period for American marriage patterns. Figure 2-6, showing the median age at first marriage from 1890 to 1994, illustrates that the pattern of early marriage in the 1950s and 1960s was an exception to a historical pattern of relatively higher ages at marriage. The median age at first marriage for men is barely higher in 1994 than in 1890; the median age for women, on the other hand, has substantially exceeded its recorded precedents (Saluter, 1996).
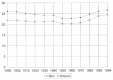
Figure 2-6
Median age at first marriage, by sex: 1890–1994. SOURCE: U.S. Bureau of the Census (1996).
The second qualifying observation is that the delay in marriage does not signal a corresponding delay in the formation of marriage-like unions. cohabitation by unmarried partners has increased dramatically over recent decades, and recent data from the second wave of the National Survey of Families and Households confirms that it is continuing to increase (Bumpass and Sweet, 1995). Bumpass and Sweet (1989) have demonstrated that increases in cohabitation substantially offset declines in marriage between cohorts of women born in 1940–1944 and 1960–1964. Thus, although only 61 percent of the later cohort married by age 25 (compared with 82 percent of the earlier cohort), the difference in the percentage entering either a marital or a cohabitational union by age 25 was far smaller (76 percent and 83 percent, respectively).
The Ubiquitous Rise of Nonmarital Fertility
At the intersection of these trends in fertility and marriage we find a phenomenon that has drawn increasing attention from policy makers and the public: increasing out-of-wedlock births. Since 1940, the year for which we have the earliest data, out-of-wedlock childbearing has shown an almost constant increase. This is true whether one looks at the number of nonmarital births (Figure 2-7, top panel), the rate at which unmarried women give birth (middle panel), or the nonmarital birth ratio, which shows the proportion of all births that occur to unmarried women (bottom panel). In 1993, 31 percent of births were born out-of-wedlock, up from 4 percent in 1940; and 11 percent in 1970.3
Figure 2-7
Trends in out-of-wedlock childbearing: 1940–1993. SOURCE: Department of Health and Human Services (1995).
The simplicity and regularity of this upward trend belie considerable complexity and change in the factors that have contributed to it. Smith and Cutright (1988) have demonstrated that the increase in the nonmarital birth ratio is a function of four components: the age-specific birth rates for unmarried and for married women, the proportion of women unmarried at each age, and the age structure of the population. Since the mid-1970s,
- the population of reproductive age has shifted toward an older age distribution, putting slight downward pressure on the nonmarital birth ratio;
- the percentage of unmarried has increased at each age, as we have seen;
- age-specific birth rates for married women have generally increased, al though the overall marital birth rate has declined because the married population has become increasingly older; and
- age-specific birth rates for unmarried women increased sharply at all ages (Figure 2-8); note, however, that this was a reversal from a sharp downward trend in such rates during the preceding decade for all age groups except teenagers. The increase in age-specific nonmarital birth rates leveled off in the early 1990s.
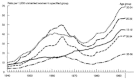
Figure 2-8
Birth rates for unmarried women by age: 1940–1993. SOURCE: Department of Health and Human Services (1995).
Figure 2-9 shows the results of an analysis by Smith and his colleagues showing the importance of each of these components in contributing to the upward trend in the nonmarital birth ratio for each year between 1960 and 1992. Their results are shown separately for black and white women. In these figures, the effect of each of the four components is represented by a line that has an upward slope if the component was exerting upward pressure on the ratio during the given year and a downward slope if it was exerting negative pressure. The steeper the slope of the line, the greater is the upward (or downward) pressure on the nonmarital birth ratio. The figures show that since the early 1970s, the major factor driving the increase in the nonmarital birth ratio for black women (top panel) was the increase in the proportion unmarried. For white women (bottom panel), both changes in marital status and increased rates of out-of-wedlock childbearing have been significant. Trends in marital fertility pushed the ratio up during the 1960s and early 1970s but have since exerted a slight downward pressure on the ratio (Smith et al., 1996).
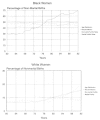
Figure 2-9
Standardized effects of selected factors on nonmarital birth ratios, by race: 1960–1992. SOURCE: Smith et al. (1996).
To recap this overview so far, changes in the frequency and timing of marriage have been more pronounced than changes in the frequency and timing of childbearing during recent decades in the United States. Increases in out-of-wedlock childbearing have been driven primarily by changes in marriage, but also by changes in the reproductive behavior of unmarried women. In the next section, I examine the behavioral trends underlying the changing fertility of unmarried women.
Proximate Factors: Pathways for the Effects of Welfare on Nonmarital Fertility
Births to unmarried women occur as the result of a series of behaviors and choices made by women and their partners. Figure 2-10 illustrates that choices about whether or not to have sex outside of marriage, whether to use contraception consistently and effectively, whether to end a pregnancy by induced abortion, and, if carrying the pregnancy to term, whether to marry before the baby is born all contribute to increasing or decreasing the chances of out-of-wedlock childbearing. If welfare programs are to have an effect on fertility, they would have to do so through affecting one or more of these behaviors. In this section, I explore trends in these key behaviors that lead up to an out-of-wedlock birth.
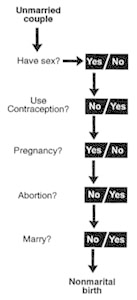
Figure 2-10
Path to nonmarital fertility. SOURCE: Department of Health and Human Services (1995).
Attention to these behaviors is important, because evidence suggests that the majority of births to unmarried women are unintended. Sixty-five percent of births during the preceding 5 years to women who were never married in 1988 occurred as a result of an unwanted or mistimed pregnancy; among unmarried teens, this proportion soared to 86 percent (Brown and Eisenberg, 1995). In 1987, nearly 9 in 10 pregnancies experienced by never-married women, and 7 in 10 experienced by formerly married women, were unintended (Forrest, 1994). One way that welfare programs could affect nonmarital fertility is by encouraging intentional childbearing among unmarried women. Another, more likely, way is to reduce the costs of getting "caught" with an unintended out-of-wedlock birth and therefore encourage behaviors that have childbearing as an unintended consequence, such as an nonmarital sex and contraceptive risk taking.
There is no question that the sexual experience of the unmarried population has increased over recent decades. Figure 2-11, from a national survey of sexual behavior conducted by University of Chicago researchers, shows that early initiation into sexual experience has become increasingly likely for both men and women (Laumann et al., 1994). This earlier age at sexual debut, combined with later ages at marriage, has driven up the proportions who engage in sex premaritally (Department of Health and Human Services, 1995). Among ever-married women aged 15–24 in 1988, 84 percent had had sexual intercourse before they married, up from 65 percent in the cohorts born 20 years earlier.
Figure 2-11
Percentage of adults who have had sexual intercourse by age 18, by year of birth. SOURCE: Laumann et al. (1994).
While unmarried people have sex less often, on average, than married people, most are sexually active to some degree. National data for adults 18–59 show that only 19 percent of unmarried men and 27 percent of unmarried women did not have sex at all in the past year (calculated from data in Laumann et al., 1994). Trend data on sexual activity of the unmarried population are available for women for the period 1982–1988. These data show that during this period, the percentage of never-married women who had had intercourse in the last 3 months increased from 45 percent to 49 percent; the percentage of sexually active among the formerly married declined during the period, from 68 percent to 61 percent (Forrest and Singh, 1990).
Contraceptive use by unmarried women having sexual intercourse also increased during the 1980s. Figure 2-12 shows that use of methods such as sterilization, pill, and condom increased among unmarried sexually active women age 15–44 between 1982 and 1988. The percentage of these women not using a method because they were seeking pregnancy remained constant at under 3 percent. Nonuse of a method for other reasons by sexually active women decreased from 19 to 14 percent during the period (Department of Health and Human Services, 1995). We do not have any reliable data on trends in vigilance in contraceptive use. Yet we know that contraceptive failure rates are high, ranging from 7 percent failure during the first 12 months of use among pill users to 31 percent among users of periodic abstinence. Overall, about 16 percent of never-married contraceptors and 26 percent of formerly married contraceptors using reversible methods of contraception experience failure in the first 12 months of method use. Contraceptive failure results in part from a failure of the method and in part from inconsistent or inaccurate use of the method (Jones and Forrest, 1992).
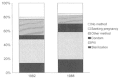
Figure 2-12
Contraceptive use among unmarried sexually active women 15–44: 1982 and 1988. Department of Health and Human Services (1995).
Increased sexual activity tends to drive up pregnancy rates; improved contraceptive use tends to drive them down. Theoretically the two could balance out. In fact, pregnancy rates for unmarried women increased in recent decades. Figure 2-13 shows the trend in pregnancy rates for married and unmarried women using an approximate measure based on pregnancies ending in abortion or birth.4 Pregnancy rates for unmarried women increased most rapidly during the 1970s, remained level during much of the 1980s, but increased again toward the end of that decade. Pregnancy rates for 1980, 1990, and 1991 calculated by Ventura and her colleagues confirm this pattern and show that the increase during the 1980–1990 period was confined to unmarried white women: pregnancy rates for unmarried black women fell during this time (Ventura et al., 1995b).
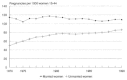
Figure 2-13
Estimated rates of pregnancy: 1973–1990. NOTE: Excludes pregnancies ending in miscarriage or stillbirth. Births are lagged 6 months. SOURCE: Calculated based on data in Alan Guttmacher Institute (1992).
When a pregnancy occurs, whether it is carried to term is strongly influenced by marital status. The abortion ratio, or the ratio of abortions to all pregnancies ending in either live birth or abortion, gives a rough measure of the likelihood that a pregnancy will end in abortion.5 In 1991, the abortion ratio was 8.6 per 100 pregnancies among married women, but 51.2 among unmarried women (Figure 2-14). Abortion ratios among unmarried women increased sharply in the first few years following the 1973 Supreme Court decision, from 57 per 100 in 1973 to 66 per 100 in 1977. But since 1979, the ratio has traced a steady decline, which has accelerated in recent years. Thus, pregnancies to unmarried women have become less likely to end in abortion, and more likely to end in birth.6
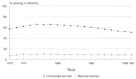
Figure 2-14
Percentage of pregnancies ending in abortion: married and unmarried women, 1973–1991. NOTE: % = abortions as percent of abortions + births; births lagged 6 months. SOURCE: Alan Guttmacher Institute (1992).
If an unmarried woman decides to carry a pregnancy to term, she may still avoid becoming an unwed mother by marrying before the delivery of the baby. This practice was common in previous decades but has declined steadily over time (Figure 2-15). In 1960–1964, 52 percent of first births resulting from out-of-wedlock pregnancies to women 15–34 years of age were "legitimated" before the birth by the marriage of the mother; by 1985–1989, only 27 percent were legitimated (Bachu, 1993). In a recent analysis, Morgan and his associates (1995) demonstrate that this decline in legitimation has had a substantial impact on the trend in out-of-wedlock births. Considering only those pregnancies ending in live birth, they demonstrate that the rate of nonmarital birth would have increased only marginally between the early 1960s and the mid- 1980s if unmarried pregnant women had continued to marry between conception and birth at the same rate as they had in 1963.
Figure 2-15
Percentage of women marrying between conception and birth of first child: 1960–1964 to 1985–1989. SOURCE: Bachu (1991).
Trends in the sexual behavior of unmarried women, and in their choice of abortion and "shotgun" marriage in response to out-of-wedlock pregnancy, reflect important changes in the meaning of marriage in our society. In the 1950s, when Davis and Blake (1956) first developed their "intermediate variables" framework, sexual activity was not included as one of the intermediate variables; marriage was. Their ability to propose marriage as a proxy for regular sexual exposure reflected the close identification of "sex" and "marriage'' at that time. This identification has been seriously eroded over recent decades, as reflected in trends in public attitudes about premarital sex. The proportion of women under 30 agreeing that premarital sex is "not wrong at all" increased from about one-fifth in the mid-1960s to about half in the mid-1980s. In 1965, half of women under 30 believed that premarital sex was "always wrong" but by the late 1970s and during the 1980s, only about 13–14 percent believed this (Thornton, 1989). Attitudes towards nonmarital childbearing have shown similar changes (Pagnini and Rindfuss, 1993). Thus, as marriage has changed in its frequency and timing, it has also changed in its meaning: the consensus that it provides a normative boundary defining the acceptable settings for sex and childbearing no longer exists. Undoubtedly, these changes are mutually reinforcing: the ability to have sex and bear children outside of marriage permits marriage to be delayed or forgone; and the changing size and demographics of the unmarried and married populations contribute to marriage being seen in new ways. In this sense, change in the reproductive behaviors of unmarried women is inextricably interwoven with changes in marriage.
Trends by Race and Socioeconomic Status
To this point, I have mainly focused on trends in fertility, marriage, and out-of-wedlock fertility in the U.S. population as a whole. However, since if welfare programs affect marriage and fertility they are likely to do so primarily among disadvantaged socioeconomic groups, it would be most useful to replicate these trend analyses for poor and near-poor populations. However, two basic pitfalls hinder an examination of trends by poverty status. One is a scarcity of appropriate data.7 The source of our best data on out-of-wedlock childbearing, the vital registration system, does not collect information on family income. Data from the Current Population Survey (CPS) provide some measures, but in most years the CPS collects incomplete data on marital status and fertility. A second pitfall, which calls into question the use of cross-sectional data such as those collected by the CPS, is the endogeneity of poverty and marital and fertility behavior. The CPS measures income (and proxies such as employment, occupation, and education) as of (or close to) the survey date, whereas fertility and marital events may have occurred at any time in the past. Marriage tends to lift people out of poverty; childbearing often signals a change in living arrangements and another mouth to feed. Data linking current socioeconomic status with past or even recent fertility and marriage are therefore of doubtful value in inferring trends in poor populations.
Given these limitations, the strategy adopted here is to examine trend data according to relatively enduring characteristics that are associated with, but not identical to, poverty. The first characteristic examined is race. The advantage of race is that most trend data presented in this chapter are available by race; the disadvantage is that is it a poor proxy for income or poverty. Most black and white families are not poor even though, in 1992, poverty was three times as prevalent among black (31 percent) as among white (9 percent) families (U.S. Bureau of the Census, 1994). Differences in fertility and marriage trends among different racial groups are instructive, however, because they challenge popular stereotypes.
Table 2-1 provides a summary of some of the key trends examined elsewhere in this paper among black and white women. Although the direction of trends is frequently similar in both groups, notable differences exist in the rate at which change has taken place. The trends for which black women have experienced the greatest proportional change are all trends related to marriage. Compared with white women, black women experienced a steeper increase in the percentage unmarried among women aged 20–29 and a sharper decrease in the percentage marrying between the conception of a premarital birth and its delivery. The trends for which white women have experienced greatest change all involve reproductive behaviors outside of marriage, and in all of these areas the greater changes among white women have narrowed the differences between the racial groups. Rates of teen premarital sex and out-of-wedlock pregnancy and birth rates have all increased more for whites (and in some cases decreased for blacks); abortion ratios have dropped more steeply for white than black women. If a "decoupling" of marriage and sexual/reproductive behavior occurred among black women, it had already largely occurred before 1970; since 1970, change in the function of marriage as boundary for these behaviors has primarily affected white women. Meanwhile, among both races but especially among black women, marriage itself is increasingly postponed or forgone.
TABLE 2-1
Comparison of Trends: Black and White Women, 1970s–1990s.
Limited trend data from the Current Population Survey have been published for a second set of (relatively enduring) characteristics associated with income and poverty: occupation and education. Tables 2-2 and 2-3 present trends in several indicators of nonmarital childbearing according to these characteristics. These data show clearly that, in the period since 1982, changes in out-of-wedlock childbearing have affected all socioeconomic groups. Between 1982 and 1992, the fertility of never-married women increased at all educational levels and in managerial/professional as well as other occupations (Table 2-2). However, very strong differentials by educational and occupational status persisted throughout the period. Between 1990 and 1994, the percentage unmarried among women who had had a child in the last year increased at all educational levels and for employed women in all occupational categories (Table 2-3). However, even though proportional increases in this crude measure of the percentage of births out of wedlock were in some cases as great or greater among higher-status women, the socioeconomic differentials remain very large. Out-of-wedlock childbearing is still much higher among members of the less advantaged educational and occupational groups.
TABLE 2-2
Percentage of Never-Married Women Age 18–44 Who Had Given Birth and Children Ever Born per 1,000 Never-Married Women, by Occupation and Education: June 1982 and June 1992.
TABLE 2-3
Percentage Unmarried at Survey Date Among Women Aged 15–44 Who Had a Child in the Past Year, by Education and Occupation of Employed Women: June 1990 and June 1994.
Conclusions
Out-of-wedlock childbearing has been increasing in the United States for over half a century. By most measures, the increase accelerated sharply over the past 15 years and leveled in the early 1990s. Stereotypes equating unwed births with births to black teenagers reflect the higher ratios of out-of-wedlock births in these populations, but miss the reality that fewer than one in three such births occurs to teens, and only 11 percent to black teens. Although rates and ratios of out-of-wedlock childbearing in different population subgroups have tended to move toward convergence over recent decades, sharp differentials remain. Nonmarital childbearing is far more prevalent among disadvantaged populations: those with low educational attainment and those in low-status occupations.
As most people recognize, the trends in out-of-wedlock childbearing described here are shared by other industrialized countries as well. In 1992, the proportion of births to unmarried women in Canada, France, and the United Kingdom was similar to that in the United States; the proportion in both Denmark and Sweden, where social welfare policies are dissimilar from the United States, was substantially higher (Department of Health and Human Services, 1995). Out-of-wedlock childbearing has increased in all industrialized Western nations since 1960, but there are great differences among countries in the extent of change. As yet, Japan and other newly industrialized Asian countries have not experienced this change. One of the intriguing opportunities that remains to be fully explored is the possibility of careful comparative analyses of these trends across industrialized nations.
The recent focus of public concern on out-of-wedlock childbearing has tended to place emphasis on the reproductive behavior of unmarried women. Yet, as this chapter argues, changes in marriage have occupied a central, and perhaps dominant, role in this drama. The prevalence and timing of marriage have changed more dramatically over recent decades than the prevalence and timing of fertility. Further, the meaning of marriage as a boundary line for behaviors such as sexual activity, coresidential unions, pregnancy, and birth has diminished sharply. Changes in the reproductive behaviors of unmarried women have clearly contributed to the increase in out-of-wedlock births, but the changing behavior of this population may reflect in part its changing composition, since it has expanded to include many who would have married at an earlier age one or more decades ago. Women in their teens and twenties continued to give birth at the same or declining rates during the 1970s and most of the 1980s; the circumstances in which they did so were altered by the decline in marriage. Despite the central role played by marriage trends, relatively little has been invested in understanding their causes and their meaning and in ensuring the availability of data that will permit both careful demographic analysis of trends and theoretically driven analytic studies. A study of the impact of welfare programs on family and reproductive behavior would do well to attend to marriage as well as fertility, and to ways in which trends in both are interrelated.
Acknowledgments
This chapter draws on materials developed by Stephanie Ventura et al., for the Report to Congress on Out-of-Wedlock Childbearing (Department of Health and Human Services, 1995). The author gratefully acknowledges the assistance of Stephanie Ventura, Amy Cox, and Michelle Hindin in providing and updating charts, and the comments of Sally Clarke, Stephanie Ventura, Susan Newcomer, and two anonymous reviewers.
References
- Alan Guttmacher Institute 1992. Abortion Factbook , 1992 edition. New York: Alan Guttmacher Institute.
- Bachu, A. 1991. Fertility of American women: June 1990. Current Population Reports, Series P-20 No. (454). Washington, D.C.: U.S. Government Printing Office. [PubMed: 12158801]
- 1993. Fertility of American women: June 1992. Current Population Reports, Series P-20, No. (470). Washington, D.C.: U.S. Government Printing Office.
- 1995. Fertility of American women: June 1994. Current Population Reports, Series P-20, No. (482). Washington, D.C.: U.S. Government Printing Office.
- Bongaarts, J. 1978. A framework for analyzing the proximate determinants of fertility. Population and Development Review 4(1):105–132.
- Brown, S., editor; , and L. Eisenberg, editor. , eds. 1995. The Best Intentions: Unintended Pregnancy and the Well-Being of Children and Families. Washington, D.C.: National Academy Press. [PubMed: 25121228]
- Bumpass, L., and J. Sweet 1989. National estimates of cohabitation. Demography 26(4):615–630. [PubMed: 2583320]
- 1995. Cohabitation, Marriage and Union Stability: Preliminary Findings from NSFH2. CDE Working Paper 65. Center for Demography and Ecology, University of Wisconsin, Madison.
- Clarke, S.C. 1995. Advance report of final marriage statistics, 1989 and 1990. Monthly Vital Statistics Report 43(12 Suppl.). Hyattsville, Md.: National Center for Health Statistics.
- Davis, K., and J. Blake 1956. Social structure and fertility: An analytic framework. Economic Development and Cultural Change 4:211–235.
- Department of Health and Human Services 1995. Report to Congress on Out-of-Wedlock Childbearing Hyattsville, Md.: U.S. Public Health Service.
- Forrest, J. 1994. Epidemiology of unintended pregnancy and contraceptive use. American Journal of Obstetrics and Gynecology 170:1485–1488. [PubMed: 8178895]
- Forrest, J., and S. Singh 1990. The sexual and reproductive behavior of American women, 1982–1988. Family Planning Perspectives 22(5):206–214. [PubMed: 2272379]
- Henshaw, S., and J. Silverman 1988. The characteristics and prior contraceptive use of U.S. abortion patients. Family Planning Perspectives 20(4):158–168. [PubMed: 3243346]
- Henshaw, S., N.J. Binkin, E. Blaine, and J.C. Smith 1985. A portrait of American women who obtain abortions. Family Planning Perspectives 17(2):90–96. [PubMed: 3842656]
- Henshaw, S., L.M. Koonin, and J.C. Smith 1991. Characteristics of U.S. women having abortions. Family Planning Perspectives 23(2):75–81. [PubMed: 2060615]
- Hofferth, S.L., J.R. Kahn, and W. Baldwin 1987. Premarital sexual activity among U.S. teenage women over the past three decades. Family Planning Perspectives 19(2):46–53. [PubMed: 3595817]
- Jones, E., and J. Forrest 1992. Contraceptive failure rates based on the 1988 NSFG. Family Planning Perspectives 24(1):12–19. [PubMed: 1601121]
- Laumann, E., J. Gagnon, R. Michael, and S. Michaels 1994. The Social Organization of Sexuality: Sexual Practices in the United States. Chicago, Ill.: University of Chicago Press.
- Morgan, S.P. 1996. Characteristic features of modern American fertility. Population and Development Review 22(Suppl.):19–63.
- Morgan, S.P., K. Offutt, and R.R. Rindfuss 1995. Education, Marital Status and the Changing Age Pattern of American Fertility. Paper presented at the Annual Meeting of the Population Association of America, San Francisco, April.
- National Center for Health Statistics 1996. Provisional vital statistics for September 1995. Monthly Vital Statistics Report 44(9). Hyattsville, Md.: Public Health Service.
- Pagnini, D., and R.R. Rindfuss 1993. The divorce of marriage and childbearing: Changing attitudes and behavior in the United States. Population and Development Review 19(2):331–347.
- Ryder, N.B. 1980. Components of temporal variations in American fertility. In R.W. Hiorns, editor. , ed., Demographic Patterns in Developed Societies. London: Taylor and Francis.
- Saluter, A.F. 1996. Marital status and living arrangements: March, 1994. Current Population Reports, Series P20-484. Washington, D.C.: U.S. Government Printing Office.
- Smith, H.L., and P. Cutright 1988. Thinking about changes in illegitimacy ratios: United States, 1963–1983. Demography 25(2):235–247. [PubMed: 3396749]
- Smith, H.L., S.P. Morgan, and T. Koropeckyj-Cox 1996. A decomposition of trends in the nonmarital fertility ratios of blacks and whites in the United States, 1960–1992. Demography 33(2):141–151. [PubMed: 8827161]
- Thornton, A. 1989. Changing attitudes towards family issues in the United States. Journal of Marriage and the Family 51(4):873–893.
- U.S. Bureau of the Census 1993. The fertility of American women: June 1992. Current Population Reports, Series P20-470. Washington, D.C.: U.S. Government Printing Office.
- 1994. Statistical Abstract of the United States: 1994, 114th Edition. Washington, D.C.: U.S. Government Printing Office.
- 1996. The fertility of American women: June 1994. Current Population Reports, P-20-484. Washington, D.C.: U.S. Government Printing Office.
- Ventura, S., J. Martin, S. Taffel, T. Matthews, and S. Clarke 1995. a. Advance report of final natality statistics, 1993. Monthly Vital Statistics Report, 44(3 Suppl.) Hyattsville, Md.: National Center for Health Statistics.
- Ventura, S., S. Taffel, W. Mosher, J. Wilson, and S. Henshaw 1995. b. Trends in Pregnancies and Pregnancy Rates: Estimates for the United States, 1980–92. Monthly Vital Statistics Report 43(11 Suppl.). Hyattsville, Md.: National Center for Health Statistics.
- Ventura, S., K. Peters, J. Martin, and J. Maurer 1997. Births and deaths: United States, 1996. Monthly Vital Statistics Report 46(1 Suppl. 2). Hyattsville, Md.: National Center for Health Statistics. [PubMed: 9404390]
Footnotes
- 1
It is likely that 1990 will be one of the last years for which detailed marriage statistics are available from the Vital Registration System. After 1995, the National Center for Health Statistics plans to collect data on numbers of marriages only.
- 2
It is useful to examine both vital statistics and Current Population Survey data on trends in marriage because they have complementary strengths and weaknesses. Vital statistics estimates of age-specific marriage rates are based on samples of marriage records from states participating in the Marriage Registration Area (MRA). In 1989–1990, the MRA included only 86 percent of the U.S. population and excluded 8 states (Arizona, Arkansas, Nevada, New Mexico, North Dakota, Oklahoma, Texas, and Washington). Moreover, its samples did not include detailed information on the characteristics of brides and grooms obtaining nonlicensed California marriages (about 103,000 of these occurred in 1990). For this and other reasons, data from the MRA samples represent only 77 percent of the marriages that occurred during 1989–1990, and understate marriage rates for the United States as a whole (Clarke, 1995). Estimates from the Current Population Survey are based on a national probability sample of households in the United States. The advantage of this data source is thus in improved geographic coverage; disadvantages include undercoverage of men, blacks, and persons not in households and the frequent reliance on proxy reports of marital status (Saluter, 1996).
- 3
The increase in the percentage of births occurring outside of marriage slowed after 1993, hovering between 32 percent and 33 percent during the years 1994–1996 (Ventura et al., 1997).
- 4
This measure is calculated by combining data on abortion rates by year and marital status with birth rates in which the year of ''birth" is moved up by 6 months. Thus, the rates refer to a time period a few months after conceptions occurred and do not include conceptions ending in spontaneous fetal loss (Stanley Henshaw, personal communication).
- 5
The missing element, spontaneous fetal loss, occurs in about 15 percent of all pregnancies.
- 6
During 1980–1987, declines in the abortion ratio occurred among white women of all ages, and among black women at ages 20 and older. Abortion ratios for black teens did not decline. However, even in 1980, only 44 percent of pregnancies to black teens ended in abortion—a ratio substantially lower than that of older black women and white women of all ages (Henshaw, et al., 1985; Henshaw and Silverman, 1988; Henshaw et al., 1991).
- 7
Published national statistics on marriage and childbearing, and on out-of-wedlock childbearing in particular, are rarely presented by income or poverty status. My search of published statistical resources yielded no adequate trend data of this nature covering the period of interest. Trends could be analyzed using data from the Current Population Survey or (to take another approach) by attaching areal data to vital statistics data. However, such analyses would be difficult to interpret (see text) and are beyond the scope of this chapter.
- PubMedLinks to PubMed
- The Changing Circumstances of Marriage and Fertility in the United States - Welf...The Changing Circumstances of Marriage and Fertility in the United States - Welfare, The Family, And Reproductive Behavior
Your browsing activity is empty.
Activity recording is turned off.
See more...