

NCBI Bookshelf. A service of the National Library of Medicine, National Institutes of Health.
National Academies of Sciences, Engineering, and Medicine; Division on Earth and Life Studies; Board on Agriculture and Natural Resources; Committee on Nutrient Requirements of Dairy Cattle. Nutrient Requirements of Dairy Cattle: Eighth Revised Edition. Washington (DC): National Academies Press (US); 2021 Aug 30.
Nutrient Requirements of Dairy Cattle: Eighth Revised Edition.
Show detailsMODEL ABBREVIATIONS AND UNITS
Over time, the nutrition community has developed commonly used abbreviations, some of which are predefined for use in the journals. There is good uniformity relative to abbreviations of proximate nutrients, fatty acids (FAs), amino acids (AAs), vitamins, and minerals. However, because digestion, metabolism, and utilization schemes have generally been developed independently by different groups over time, there is no uniformity in the abbreviations used to describe movement of each nutrient through the animal. While this is not problematic for publications focusing on subgroups of nutrients where the abbreviation scheme does not have to be all-encompassing, it is problematic for development of a model containing all of the essential nutrients. In the absence of a clear, intuitive abbreviation scheme, model development will be more error prone, and identification of model inconsistencies will be more problematic. It also should yield model code that is intuitive to understand so that the code can be adopted by others and maintained over time.
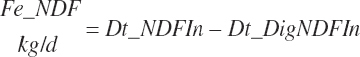
For this work, model abbreviations generally follow the pattern: Location_Nutrient_Modifier. A similar scheme was outlined independently of this work by Tedeschi and Fox (2020). This approach is a compromise among prior abbreviation schemes that generally results in abbreviations with similar patterns as the historical ones yet removes some ambiguity and allows for more detailed description. For example, one must denote whether digestible protein is apparently or truly digested and the location of the digestion. The addition of a clear location designation as the first term provides more clarity (e.g., ruminally degraded protein should be designated as Rum_DigCP or may be denoted as Rum_dCP). Additional examples include Fd_NDF, Dt_NDF, Rum_DigNDF, Du_NDF, and Fe_NDF to denote neutral detergent fiber (NDF) associated with a feed, the diet, digested in the rumen, flowing at the duodenum, and excreted in feces, respectively.
In the interest of maintaining some historical context, and recognizing the universal use of a number of abbreviations that do not follow the scheme, some of the prior abbreviations (e.g., RDP [rumen-degradable protein] and RUP [rumen-undegradable protein]) have been retained, sometimes yielding inconsistencies in the scheme. Additionally, the common use of D to denote digested, M to denote metabolized, and N to denote net was retained to designate energy and protein flows (e.g., DE, ME, NE, MP, and NP to denote digested energy, metabolizable energy, net energy, metabolizable protein, and net protein, respectively).
For nutrients that are tracked from upstream processes through downstream actions, the abbreviation scheme requires a double location designation that was less uniformly applied throughout this work. For example, ruminally undegraded protein must be tracked to the small intestine (SI), where it is digested to calculate AA flows to and absorption from the SI. Thus, there is a challenge in denoting activity in the intestine on nutrients released from the rumen. Per the scheme, one would generate a variable of the form SI_Rum_ UP. However, this is cumbersome, and thus the approach was taken to use the second location within the nutrient name. For example, SI_Rum_UP becomes SI_RUP. The intestinal digestion coefficient for Rum_UP would be si_dcrUP; intestinally digested Rum_UP would be denoted as si_DigrUP and the digested AA associated with RUP as si_DigAArUP. While the scheme of indicating location is not perfect, it does provide the needed range in variable designations without losing name transparency and generally yields intuitive names that should not require excessive use of the abbreviation table for decoding. A deviation of the scheme based on nutrient and metabolite transfers and conversions that provides for clearer specification of transfer from location to location with or without interconversion was described by Li et al. (2019), but the committee did not adopt that approach herein.
Phosphorus presents opportunities for ambiguity given the use of P to also denote protein (i.e., CP [crude protein], MP, etc.). Thus, one must be cautious in assigning and using variables for phosphorus to avoid cross-listing variable names with protein variables or misinterpreting model output. From the scheme, one might be inclined to assign the abbreviation Ph for phosphorus, but future work could result in the addition of a ruminal pH equation, which would be difficult to distinguish from Ph. There does not seem to be a natural solution to the problem that would also be intuitive.
There has also been ambiguity regarding nutrient concentrations versus nutrient intake. For this work, nutrient intakes are clearly defined by the addition of in to the end of the abbreviation (e.g., Rum_DigCPin). The absence of in as an appendage denotes a concentration (e.g., percentage). For ingredient and dietary nutrients, the default reference for the concentration is dry matter (DM). Thus, Rum_DigCP represents the concentration of ruminally digested CP in dietary DM. If the concentration is relative to another entity (e.g., the concentration of Rum_DigCP relative to dietary CP), it is denoted by the addition of an underscore and the reference nutrient (e.g., Rum_DigCP_CP). These are expressed as percentages unless specified otherwise.
By extension, one should append “out” to variables denoting flow from the specified location (e.g., Fec_DMout for fecal DM output). That convention was not fully adopted, but it is endorsed for future use. In the absence of that appendage, one would infer that Fec_OM would represent the concentration of fecal organic matter (OM) in fecal DM; however, as specified below, it denotes fecal OM output. These deviations are documented at first use. Despite the committee's best efforts, there are additional deviations from the scheme that the reader will note.
The model was coded with default time units of 1 day and mass units of kg for macronutrients. Where mass or flux was in grams, a “g” was added to the variable to denote the change. Vitamins and mineral units are defined for each nutrient, IU, mg, or g. Thus, body weight (BW) is in kg and DM intake (DMI) and milk output are in kg/d. The AA flows are generally expressed in grams, which is denoted across abbreviations.
Subscripts are used herein to avoid replication of equations across classes. When dealing with diets, there are generally multiple ingredients, and thus a subscript of f is used to denote each of the different feeds. In a similar manner, the subscript a is used for repetitive AA calculations to denote each individual AA and fa to denote individual FAs for purposes of model presentation, although each AA and FA equation is explicitly defined in the model code. Examples of such use include Fd_CPf = feed CP concentration of feed f, Fd_NDFinf = intake of NDF from feed f, Fd_dcFAf = the digestibility of FAs in feed f, Fd_CPB_CPf = the percentage of CP in feed f that is contained in the B fraction, Dt_Stin = dietary starch intake, Dt_Dein = dietary digestible energy intake, Dt_Argin_g = dietary arginine intake in g/d, Du_LeurUP_g = the flow of leucine from the rumen in the RUP fraction expressed in g/d, Body_NPgain = the net protein gain in body tissue, Mlk_Neout = the NE excreted in milk, and Mlk_Fat_g = the fat excreted with milk expressed as g/d.
Location and nutrient abbreviations are listed in Table 20-1, and a partial list of equation abbreviations is provided in Table 20-2.
MODEL INPUTS
Inputs required by the model include animal, feed, and environmental factors. The animal and environmental factors are similar to those of the seventh revised edition (NRC, 2001). The feed inputs have been expanded to include more carbohydrate information and the FA composition (only used to output dietary concentrations of specific FAs). Required animal inputs include the following (all inputs are not needed for every animal type and state):
- 1.
Breed (An_Breed, “Holstein,” “Jersey,” “Other”)
- 2.
Current physiological state (An_StatePhys, “Calf,” “Heifer,” “Dry Cow,” “Lactating Cow,” “Other”)
- 3.
Birth weight (Fet_BWbrth, kg)
- 4.
Mature body weight (An_BWmature, kg)
- 5.
Current herd 305-day milk true protein production (An_305rhA_MlkTP, kg/305d)
- 6.
Body weight (An_BW, kg)
- 7.
Body condition score (An_Bcs, 1 to 5 scale)
- 8.
Age (An_Age, days)
- 9.
Parity (An_Parity, 0 for calves and heifers, 1 for primiparous, and 2 for multiparous)
- 10.
Gestation length (An_gestLength, days)
- 11.
Age at first conception (An_Ageconcept1st, days; unused. Available for growth simulations)
- 12.
Days in milk at conception (An_DiMconcept, days; unused. Available for full lactation simulations)
- 13.
Day of gestation (An_gestDay)
- 14.
Days in milk (An_LactDay)
- 15.
Current temperature (env_Tempcurr, C0)
- 16.
Distance from the paddock to the parlor (env_Dist Parlor, m/trip)
- 17.
The number of one-way trips between housing and the parlor (env_TripsParlor, d−1)
- 18.
Total climb (uphill only) each day (env_Topo, m/d, uphill only)
- 19.
Target body frame gain (Frm_GainTarget, kg/d)
- 20.
Frame gain prediction equation (Frmgain_eqn; 0 = use Frm_GainTarget, 1 = undefined future prediction equation)
- 21.
Target body reserves gain (rsrv_GainTarget, kg/d)
- 22.
Reserve gain prediction equation (rsrvgain_eqn; 0 = use rsrv_GainTarget, 1 = undefined future prediction equation)
- 23.
Target milk production (Trg_MilkProd, kg/d)
- 24.
Target milk lactose content (Trg_MilkLacp, percent)
- 25.
Target milk true protein content (Trg_MilkTPp, percent)
- 26.
Target milk fat content (Trg_MilkFatp, percent)
- 27.
Milk production prediction equation (mProd_eqn, 0 = Trg_MilkProd, 1 = NRC, 2021)
- 28.
Milk protein production prediction equation (mPrt_eqn, 0 = Trg_MilkTP, 1 = NRC, 2021)
- 29.
Milk fat production prediction equation (mFat_eqn, 0 = Trg_MilkFat, 1 = NRC, 2021)
- 30.
Target diet DMI (Trg_Dt_DMi, kg/d)
- 31.
Diet DMI equation (DMin_eqn, 0) for specified intake or an integer from 1 to 11 as follows:
- 1.
= predicted dry feed intake for a calf consuming liquid feed (NRC, 2021)
- 2.
= predicted for all heifers, animal factors (NRC, 2021)
- 3.
= predicted for all heifers, animal factors, and feed factors (NRC, 2021)
- 4.
= predicted for a Holstein heifer and animal factors, prepartum predicted for a single animal
- 5.
= predicted for a Holstein heifer, animal factors, and diet NDF concentration, prepartum predicted for a single animal
- 6.
= predicted for a Holstein × Jersey crossbred heifer and animal factors, prepartum predicted for a single animal
- 7.
= predicted for a Holstein × Jersey crossbred heifer, animal factors, and diet NDF concentration, predicted for a single animal
- 8.
= predicted for a lactating cow using animal factors such as BW and body condition score (BCS) (NRC, 2021)
- 9.
= predicted for a lactating cow using animal and feed factors (NRC, 2021)
- 10.
= predicted for a dry cow (NRC, 2021)
- 11.
= predicted for a dry cow (Hayirli et al., 2003 equation)
- 32.
Age when dry feed is first offered to calves (An_AgeDryFdstart, days)
- 33.
Control use of in vitro NDF digestibility predictions (Use_DNDF_iV; 0 = do not use in vitro NDF digestibility values, 1 = use in vitro NDF digestibility values to adjust NDF digestibility of forage ingredients, 2 = use in vitro NDF digestibility values to adjust NDF digestibility of all ingredients in the diet)
- 34.
RUP prediction equation (rUP_eqn, currently unused)
- 35.
Monensin effects switch (Monensin_eqn), 0 = no monensin fed, 1 = monensin fed)
- 36.
A dataframe of dietary ingredients with nutrient contents ( f, various units)
- 37.
A vector of dietary inclusion percentages ordered to correspond to each ingredient in f (Fd_DMInp, percentage of DM)
- 38.
A vector of nutrient infusion rates, digestibility coefficients, and the location of the infusions (i; various units). Infusion locations are rumen, abomasum or duodenum, or blood. These are read from an external file with all nutrient infusions set to 0 by default.
- 39.
A vector of target AA and MP post-absorptive use efficiencies (Eff; range of 0 to 1 for each)
- 40.
A switch denoting the effects of an under-developed rumen in a milk-fed calf on diet digestibility (RumDevDisc_Clf = 0 for developed and 1 for under-developed)
- 41.
A switch denoting the use of non-milk based protein sources in milk replacers (NonMilkCP_ClfLiq = 0 for all milk proteins and 1 for use of other protein sources)
TABLE 20-1General Location and Nutrient Abbreviations Used for Constructing Model Terms
| Location | Description | Nutrients | Description |
|---|---|---|---|
| Fd | Feed | Wt | Weight |
| Dt | Diet | GE | Gross energy |
| An | Whole animal | DE | Digestible energy |
| DEnp | DE minus DE from TP | ||
| Rum | Rumen | ME | Metabolizable energy |
| SI | Small intestine | GasE | Gaseous energy |
| LI | Large intestine | NE | Net energy |
| TT | Total digestive tract | DM | Dry matter |
| Fe | Feces | OM | Organic matter |
| Ur | Urine | NDF | Neutral detergent fiber |
| Body | Whole empty body | ForNDF | Forage NDF |
| Frm | Body frame | ADF | Acid detergent fiber |
| Rsrv | Body reserves | Lg | Lignin |
| Gest | Gestation | St | Starch |
| GrUter | Gravid uterus | rOM | Residual OM |
| Uter | Uterus plus caruncles | CP | Crude protein |
| Fet | Fetus | TP | True protein |
| Mlk | Milk and lactation | MP | Metabolizable protein |
| Scrf | Scurf | NP | Net protein |
| Env | Animal environment | CPA | CP A fraction, in situ |
| CPB | CP B fraction, in situ | ||
| Other abbreviations | CPC | CP C fraction, in situ | |
| Conc | Concentrates | NPN | Supplemental nonprotein nitrogen |
| For | Forage | FA | Fatty acids |
| ForDry | Dry forage | Ash | Ash |
| ForWet | Wet forage | Arg | Arginine |
| Past | Pasture | His | Histidine |
| Dc | Digestibility | Ile | Isoleucine |
| Dig | Digested | Leu | Leucine |
| Lys | Lysine | ||
| Met | Methionine | ||
| Minerals and vitamins | Phe | Phenylalanine | |
| Ca | Calcium | Thr | Threonine |
| P | Total phosphorus | Trp | Tryptophan |
| Pinorg | Inorganic P | Val | Valine |
| Porg | Organic P | C12 | Lauric acid |
| Na | Sodium | C14 | Myristic acid |
| Mg | Magnesium | C16 | Palmitic acid |
| K | Potassium | C16.1 | Palmitoleic acid |
| Cl | Chloride | C18.0 | Stearic acid |
| S | Sulfur | C18.1c | Oleic acid |
| Co | Cobalt | C18.1t | Vaccenic + elaidic acid |
| Cu | Copper | C18.2 | Linoleic acid |
| Fe | Iron | C18.3 | Linolenic acid |
| I | Iodine | OtherFA | Other FA |
| Mn | Manganese | VitA | Vitamin A |
| Mo | Molybdenum | VitD | Vitamin D |
| Se | Selenium | VitE | Vitamin E |
| Zn | Zinc | DCAD | Cations—anions |
TABLE 20-2Model Abbreviations for Diet and Digestive Macronutrients
| Nutrient | Dieta | Dieta | Ruminal Outflow | Digested or Absorbed | Feces |
|---|---|---|---|---|---|
| % of DM | kg/d or g/d (_g) | ||||
| Dry matter | Dt_DM | Dt_DMIn | An_DigDM | Fe_DM | |
| Water | An_WaIn | ||||
| Total forage | Dt_For | Dt_ForIn | |||
| Dry forage | Dt_ForDry | Dt_ForDryIn | |||
| Wet forage | Dt_ForWet | Dt_ForWetIn | |||
| Concentrate | Dt_Conc | Dt_ConcIn | |||
| Pasture | Dt_Pasture | Dt_PastureIn | |||
| Ash | Dt_Ash | Dt_AshIn | |||
| Organic matter | Dt_OM | Dt_OMIn | An_DigOM | Fe_OM | |
| Residual OM | Dt_rOM | Dt_rOMIn | An_DigrOMa | Fe_rOM | |
| Nitrogen | Fe_N_g | ||||
| Crude protein | Dt_CP | Dt_CPIn | Du_CP | An_DigCP | Fe_CP, Fe_InfCP |
| True protein | Dt_TP | Dt_TPIn | Du_TP | An_DigTP | |
| Metabolizable protein | Dt_MP | Dt_MPIn | |||
| Nonprotein Nb | Dt_NPN | Dt_NPNIn | Du_NPN | ||
| CP equivalent of NPNb | Dt_NPNCP | Dt_NPNCPIn | Du_NPNCP | ||
| DM of NPN sourceb | Dt NPNDM | Dt NPNDMIn | Du NPNDM | ||
| Fraction A of CPc | _ Dt_CPA | _ Dt_CPAIn | _ | ||
| Fraction B of CP | Dt_CPB | Dt_CPBIn | |||
| Fraction C of CP | Dt_CPC | Dt_CPCIn | |||
| Ruminally degraded CP | Dt_RDP | Dt_RDPIn | |||
| Ruminally undegraded CP | Dt_RUP | Dt_RUPIn | Du_RUP | Du_idRUP | Fe_RUP |
| Microbial CP | Du_MiCP_g | Du_idMiCP_g | Fe_MiCP | ||
| Microbial N | Du_MiN_g | Du_idMiN_g | |||
| Microbial TP | Du_MiTP_g | Du_idMiTP_g | |||
| Endogenous CP | Du_CPend_g | Fe_CPend_g | |||
| Endogenous N | Du_Nend_g | Fe_Nend_g | |||
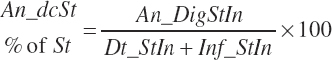
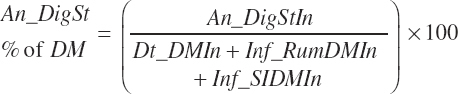
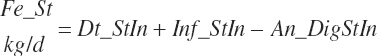
| Starch | Dt_St | Dt_StIn | Du_St | An_DigSt | Fe_St |
| NDF | Dt_NDF | Dt_NDFIn | Du_NDF | An_DigNDF | Fe_NDF |
| Forage NDF | Dt_ForNDF | Dt_ForNDFIn | |||
| ADF | Dt_ADF | Dt_ADFIn | |||
| Lignin | Dt_Lg | Dt_LgIn | |||
| Fatty acids | Dt_FA | Dt_FAIn | Du_FA | An_DigFA | Fe_FA |
| Mcal/kg | Mcal/d | ||||
| Gross energy | Dt_GE | Dt_GEIn | Fe_GE | ||
| Digestible energy | Dt_DE | Dt_DEIn | |||
| Metabolizable energy | Dt_ME | Dt_MEIn |
- a
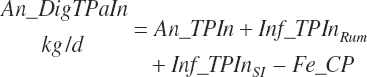
Nutrient concentrations and intake from individual feeds are denoted using the prefix Fd_ in place of Dt_. An additional set of concentrations and intakes is calculated for the summation of Dt_Xxx + Inf_Xxx labeled as An_Xxx.
- b
NPN refers to nitrogen sources not containing peptide bound or free AAs such as urea or ammonium salts. Values are expressed as N for NPN, in CP equivalents for NPNCP, and as DM for NPNDM.
- c
CPA = the CP escaping from an in situ analysis at time 0; CPC = the CP resistant to ruminal degradation at time infinity; CPC = the CP that degrades as a function of time in the rumen.
TABLE 20-3Model Abbreviations for Diet and Digestive AAs and FAs
| Nutrient | Dieta | Dieta | RUP Outflow | Microbial Outflow | Digested or Absorbed |
|---|---|---|---|---|---|
| Amino acids | % of DM | kg/d or g/d (_g) | |||
| Arginine | Dt_Arg | Dt_ArgIn_g | Du_ArgRUP_g | Du_ArgMic_g | Abs_Arg_g |
| Histidine | Dt_His | Dt_HisIn_g | Du_HisRUP_g | Du_HisMic_g | Abs_His_g |
| Isoleucine | Dt_Ile | Dt_IleIn_g | Du_IleRUP_g | Du_IleMic_g | Abs_Ile_g |
| Leucine | Dt_Leu | Dt_LeuIn_g | Du_LeuRUP_g | Du_LeuMic_g | Abs_Leu_g |
| Lysine | Dt_Lys | Dt_LysIn_g | Du_LysRUP_g | Du_LysMic_g | Abs_Lys_g |
| Methionine | Dt_Met | Dt_MetIn_g | Du_MetRUP_g | Du_MetMic_g | Abs_Met_g |
| Phenylalanine | Dt_Phe | Dt_PheIn_g | Du_PheRUP_g | Du_PheMic_g | Abs_Phe_g |
| Threonine | Dt_Thr | Dt_ThrIn_g | Du_ThrRUP_g | Du_ThrMic_g | Abs_Thr_g |
| Tryptophan | Dt_Trp | Dt_TrpIn_g | Du_TrpRUP_g | Du_TrpMic_g | Abs_Trp_g |
| Valine | Dt_Val | Dt_ValIn_g | Du_ValRUP_g | Du_ValMic_g | Abs_Val_g |
| Fatty acids | |||||
| C12:0 | Dt_C12 | Dt_C12In | An_DigC12 | ||
| C14:0 | Dt_C14 | Dt_C14In | An_DigC14 | ||
| C16:0 | Dt_C16 | Dt_C16In | An_DigC16 | ||
| C16:1 | Dt_C16.1 | Dt_C16.1In | An_DigC16.1 | ||
| C18:0 | Dt_C18 | Dt_C18In | An_DigC18 | ||
| C18:1 trans | Dt_C18.1t | Dt_C18.1tIn | An_DigC18.1t | ||
| C18:1 cis | Dt_C18.1c | Dt_C18.1cIn | An_DigC18.1c | ||
| C18:2 | Dt_C18.2 | Dt_C18.2In | An_DigC18.2 | ||
| C18:3 | Dt_C18.3 | Dt_C18.3In | An_DigC18.3 | ||
| Other FA | Dt_FAoth | Dt_FAothIn | An_DigFAoth | ||
- a
Nutrient concentrations and intake from individual feeds are denoted using the prefix Fd_ in place of Dt_. An additional set of concentrations and intakes is calculated for the summation of Dt_Xxx + Inf_Xxx labeled as An_Xxx.
TABLE 20-4Model Abbreviations for Maintenance Use of Energy and Protein
| Nutrient | Maintenance | Feces | Urine | Scurf | Activity | Environment |
|---|---|---|---|---|---|---|
| Digest. energy | Ur_DEout | |||||
| Metab. energy | An_MEmUse | |||||
| Net energy | An_NEmUse | An_NEm_Act | An_NEm_Env | |||
| Net protein | Fe_NPend_g | Ur_NPend_g | Scrf_NP_g | |||
| Nitrogen | Fe_N_g | Ur_Nout_g | ||||
| Phosphorus | Fe_P_g | Ur_P_g | ||||
| Factor | ||||||
| Temp | Env_TempCurr | |||||
| Distance | Env_DistParlor | |||||
| Topography | Env_Topo | |||||
| Amino acids | ||||||
| Arginine | Fe_ArgMet_g | Ur_ArgEnd_g | Scrf_Arg_g | |||
| Histidine | Fe_HisMet_g | Ur_HisEnd_g | Scrf_His_g | |||
| Isoleucine | Fe_IleMet_g | Ur_IleEnd_g | Scrf_Ile_g | |||
| Leucine | Fe_LeuMet_g | Ur_LeuEnd_g | Scrf_Leu_g | |||
| Lysine | Fe_LysMet_g | Ur_LysEnd_g | Scrf_Lys_g | |||
| Methionine | Fe_MetMet_g | Ur_MetEnd_g | Scrf_Met_g | |||
| Phenylalanine | Fe_PheMet_g | Ur_PheEnd_g | Scrf_Phe_g | |||
| Threonine | Fe_ThrMet_g | Ur_ThrEnd_g | Scrf_Thr_g | |||
| Tryptophan | Fe_TrpMet_g | Ur_TrpEnd_g | Scrf_Trp_g | |||
| Valine | Fe_ValMet_g | Ur_ValEnd_g | Scrf_Val_g |
aNutrient concentrations and intake from individual feeds are denoted using the prefix Fd_ in place of Dt_. An additional set of concentrations and intakes is calculated for the summation of Dt_Xxx + Inf_Xxx labeled as An_Xxx.
TABLE 20-5Model Abbreviations for Total and Productive Use of Energy (Mcal/D), Protein (kg or G/D (_G)), and Fat (kg or G/D (_G))
| Nutrient | Total | Production | Growth | Gestation | Milk |
|---|---|---|---|---|---|
| Weight | An_BW | Body_Gain | GrUter_Wt | Mlk_Prod | |
| Uter_Wt | |||||
| Fet_Wt | |||||
| GrUter_BWgain | |||||
| Digest. energy | |||||
| Metab. energy | An_MEprod_Avail | Gest_Meuse | Mlk_MEout | ||
| Net energy | An_NEgain | An_NEprod_Avail | Gest_NEuse | Mlk_NEout | |
| Mlk_NE_Milk | |||||
| Protein | Body_NPgain | Gest_NP_g | Mlk_NP_g | ||
| MlkNP_Milk | |||||
| Fat | Body_Fat | Body_Fatgain | Mlk_Fat_g | ||
| MlkFat_Milk | |||||
| Amino acids | g/d | ||||
| Arginine | An_ArgUse_g | Body_ArgGain_g | Gest_Arg_g | Mlk_Arg_g | |
| Histidine | An_HisUse_g | Body_HisGain_g | Gest_His_g | Mlk_His_g | |
| Isoleucine | An_IleUse_g | Body_IleGain_g | Gest_Ile_g | Mlk_Ile_g | |
| Leucine | An_LeuUse_g | Body_LeuGain_g | Gest_Leu_g | Mlk_Leu_g | |
| Lysine | An_LysUse_g | Body_LysGain_g | Gest_Lys_g | Mlk_Lys_g | |
| Methionine | An_MetUse_g | Body_MetGain_g | Gest_Met_g | Mlk_Met_g | |
| Phenylalanine | An_PheUse_g | Body_PheGain_g | Gest_Phe_g | Mlk_Phe_g | |
| Threonine | An_ThrUse_g | Body_ThrGain_g | Gest_Thr_g | Mlk_Thr_g | |
| Tryptophan | An_TrpUse_g | Body_TrpGain_g | Gest_Trp_g | Mlk_Trp_g | |
| Valine | An_ValUse_g | Body_ValGain_g | Gest_Val_g | Mlk_Val_g | |
| Other factors | |||||
| Time | An_AgeDay | An_GestDay | An_LactDay | ||
a Nutrient concentrations and intake from individual feeds are denoted using the prefix Fd_ in place of Dt_. An additional set of concentrations and intakes is calculated for the summation of Dt_Xxx + Inf_Xxx labeled as An_Xxx.
TABLE 20-6Model Abbreviations for Minerals and Vitamins
| Nutrient | Dieta | Dieta | Absorbed | Maint. | Growth | Gestation | Lact. | Required |
|---|---|---|---|---|---|---|---|---|
| % of DM | g/d | |||||||
| Calcium | Dt_Ca | Dt_CaIn | Abs_CaIn | An_Ca_m | An_Ca_g | An_Ca_y | An_Ca_l | An_Ca_req |
| Chloride | Dt_Cl | Dt_ClIn | Abs_ClIn | An_Cl_m | An_Cl_g | An_Cl_y | An_Cl_l | An_Cl_req |
| Magnesium | Dt_Mg | Dt_MgIn | Abs_MgIn | An_Mg_m | An_Mg_g | An_Mg_y | An_Mg_l | An_Mg_req |
| Phosphorus | Dt_P | Dt_Pin | Abs_Pin | An_P_m | An_P_g | An_P_y | An_P_l | An_P_req |
| Potassium | Dt_K | Dt_Kin | Abs_Kin | An_K_m | An_K_g | An_K_y | An_K_l | An_K_req |
| Sodium | Dt_Na | Dt_NaIn | Abs_NaIn | An_Na_m | An_Na_g | An_Na_y | An_Na_l | An_Na_req |
| Sulfur | Dt_S | Dt_Sin | An_S_req | |||||
| mg/kg | mg/d | |||||||
| Cobalt | Dt_Co | Dt_Coin | An_Co_req | |||||
| Copper | Dt_Cu | Dt_Cuin | Abs_CuIn | An_Cu_m | An_Cu_g | An_Cu_y | An_Cu_l | An_Cu_req |
| Iodine | Dt_I | Dt_Iin | An_I_req | |||||
| Iron | Dt_Fe | Dt_Fein | Abs_FeIn | An_Fe_m | An_Fe_g | An_Fe_y | An_Fe_l | An_Fe_req |
| Manganese | Dt_Mn | Dt_Mnin | Abs_MnIn | An_Mn_m | An_Mn_g | An_Mn_y | An_Mn_l | An_Mn_req |
| Selenium | Dt_Se | Dt_Sein | An_Se_req | |||||
| Zinc | Dt_Zn | Dt_Znin | Abs_ZnIn | An_Zn_m | An_Zn_g | An_Zn_y | An_Zn_l | An_Zn_req |
| IU/kg | IU/d | |||||||
| Vitamin A | Dt_VitA | Dt_VitAin | An_VitA_req | |||||
| Vitamin D | Dt_VitD | Dt_VitDin | An_VitD_req | |||||
| Vitamin E | Dt_VitE | Dt_VitEin | An_VitE_req |
- a
Nutrient concentrations and intake from individual feeds are denoted using the prefix Fd_ in place of Dt_.
These inputs are passed to the model and used by the model to predict animal performance, requirements for nutrients, and animal excretion.
For purposes of model application, animals are considered calves until they achieve 16 percent of mature BW, heifers until their first calf, primiparous cows for their first lactation, and multiparous cows thereafter. Cows that are not lactating are denoted as dry cows. Males follow the same designation as calves and heifers and should be considered dry cows when mature.
NUTRIENT SUPPLY MODEL
The model is described in two sections: nutrient supply and nutrient utilization. These sections were written by transcribing the model code from R. As such, it is possible that it is not a faithful reproduction of the code, although every attempt was made to ensure that it was. Should there be differences between the description of the model herein and the actual model code written in R, the latter is more likely to be correct, and the difference reflects a mistake in the transcription. The R code was developed and verified over a 4-year period and thus should generally be the more reliable source, although mistakes are certainly possible.
In general, the supply model starts with the specified dietary ingredients and predicts the supply of nutrients absorbed from the digestive tract.
Water Intake
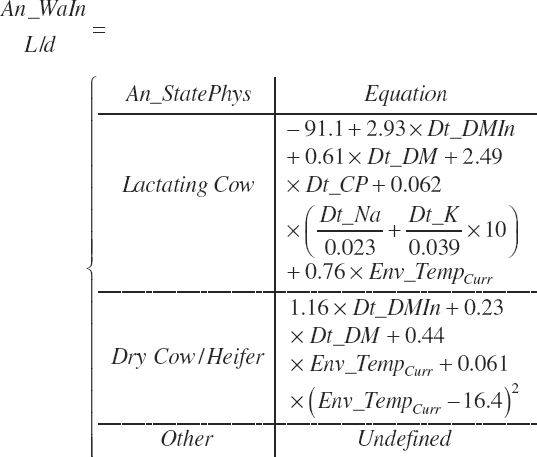
Water intake (An_WaIn, L/d) is predicted for heifers, lactating cows, and dry cows. Calves and other physiological states are undefined. The equations use DMI, dietary sodium (Na) and potassium (K), dietary CP, and the current ambient temperature. The prediction is categorized with one equation for lactating cows and a separate equation for dry cows, which was presumed also to apply to postweaned heifers:
Dry Matter Intake
DMI can be specified by the user to match observed or target values (Trg_DMIn, kg DM/d) or predicted by the model. Intake concepts underpinning the predictions are summarized in Chapter 2. Eight prediction equations are encoded. These are categorized by physiological state (An_StatePhys). The model is set to calculate all intakes regardless of animal age and state. The user must select which intake to use for the remaining calculations. From a model standpoint, it is possible to select a calf equation for use with a lactating cow, but that would obviously not be advised.
In all cases, environmental temperatures exceeding the upper critical temperature (UCT) of the animal have been observed to result in reduced DMI if the exposure is prolonged. However, such stress is only reflected in the calf equations. Intake may also be stimulated when temperatures fall below the lower critical temperature (LCT) for extended periods of time, but that concept is not captured in any of the equations. The UCT and LCT are defined as follows:

The upper critical temperature (UCT, °C) is assumed to be the same for all ages.
with the difference between the UCT and LCT being defined as the thermoneutral zone (TMZ).
Calves
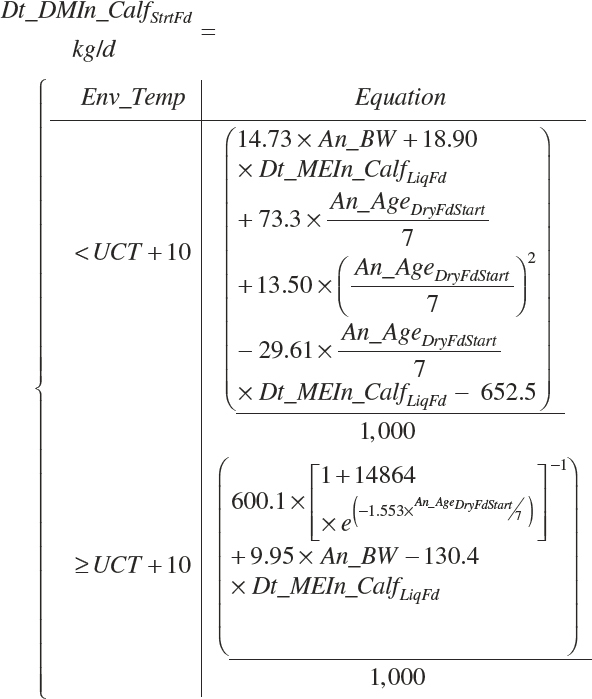
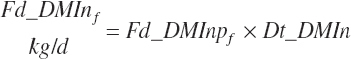
A single scheme for predicting calf intake is encoded. Total DMIn for calves is predicted based on Trg_DMIn for liquid (milk and milk replacer) and a predicted dry starter feed intake (Dt_DMIn_CalfStrtFeed, kg DM/d). The latter is predicted from the user-specified animal BW (An_BW, kg), the ME intake from liquid feeds (Dt_Mein_calfLiqFd, Equation 20-5), a user-specified target BW gain (Trg_BWgain, kg/d), the user-specified age (d) when starter feed is initially offered (An_AgeDryFdStart), and the ambient temperature relative to the UCT for calves:
Liquid feed ME intake (Dt_MEIn_CalfLiqFd, Mcal/d) is estimated as 91 percent of the gross energy (GE) values:
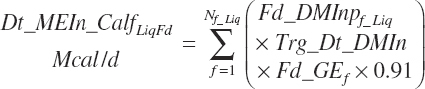
with Fd_DMInp representing the proportion of DM provided from each feed, and Fd_GE for liquid calf feed is estimated as
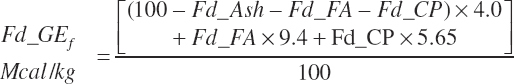
Equation 20-6 may overestimate GE for liquid feeds containing lactose as the enthalpy of lactose is 3.95 rather than 4, but the enthalpy of glycerol is 4.3 Mcal/kg, and it also is given a value of 4. Using enthalpies of specific compounds requires accurate information on the concentrations of those compounds that often will not be available. The error in using an enthalpy of 4 Mcal/kg for all OM that is not CP or FAs should be minor.
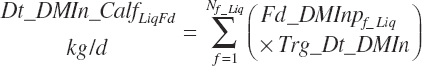
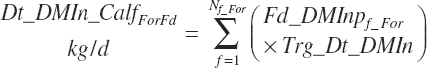
Total DMIn is predicted as the summation of that from liquid and dry feeds:
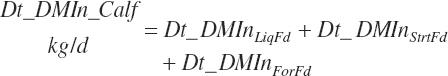
where liquid (Dt_DMInLiqFd) and forage intakes (Dt_DMInForFd) are derived from Trg_DMIn and the specified dietary proportions of each ingredient in those classes of feed:
Because the predicted starter intake will not necessarily equal that calculated from the product of Trg_DMIn and Fd_DMInp for starter feeds, the diet proportions of all ingredients will not exactly match those specified by the user when predictions of starter intake are used. When the model is set to use the Trg_Dt_DMIn, starter intake is adjusted to represent the difference between the specified An_DMIn and the specified liquid feed intake.
Heifers
Two general equation types are encoded for heifers from weaning to calving, but there are options for each based on breed and on the handling of the late-gestation predictions. The first set of equations is based solely on animal factors, and the second set uses both diet and animal factors to predict intake. These are subdivided to equations for use across breeds, which are the predictions recommended by the committee. Additional sets for Holsteins and Holstein-by-Jersey crossbreds were also encoded for comparison purposes. Each of these equations was coded to reflect individual animal intakes and mean intakes by a pen of animals during the late-gestation period.
Animal Factor Based
Intake of growing heifers of any breed prior to 3 weeks before calving (Dt_DMIn_Heif1Faroff, kg/d) can be predicted based on animal factors as
(Equation 20-10)

Animal and Diet Factor Based
Intake of growing heifers prior to 3 weeks before calving (Dt_DMIn_Heif2Faroff, kg/d) was predicted based on feed and animal factors as
(Equation 20-11)
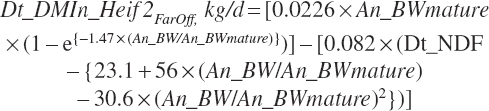
where Dt_NDF was expressed as a percentage of DM, and BW was in kg. Intake of late-gestation heifers (within 60 days of parturition) can also be predicted using the dry and transition cow intake equations.
Late-Gestation Intake
From 3 weeks prior to calving until calving, the normal decline in intake (Dt_DMIn_BWLategest_ind, percentage of BW) for an individual animal is as described in Chapter 12:
(Equation 20-12)
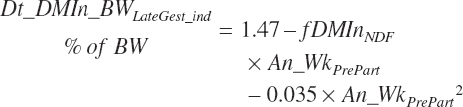
where fDMinNDF (percentage of BW/Wk) is a function of dietary NDF (Dt_NDF, percentage of DM):
(Equation 20-13)
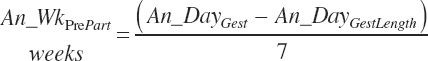
and An_WkPrePart (weeks before calving expressed in negative values) is calculated from the user-specified day of gestation (An_DayGest, d) and the expected gestation length for the selected breed (An_DayGestLength, d):
(Equation 20-14)
An_WkPrePart is limited to the range of −3 to 0, and Dt_NDF is limited to the range of 30 to 55 percent.
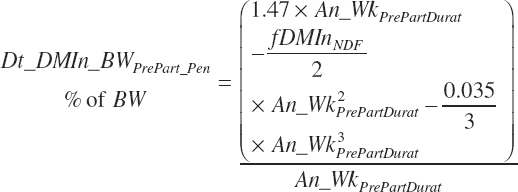
Because Equation 20-12 is a nonlinear function of time, the intake of a group of animals is not accurately reflected by setting An_WkPrePart to the mean of the group. The function must be integrated over the range in time animals are spending in the pen to achieve a proper group estimate. It is assumed that An_WkPrePart reflects the mean weeks before calving for the prefreshening pen if the pen is in steady state, and thus the duration of time (An_WkPrePartDurat, wk) over which to integrate is 2× the mean:
(Equation 20-15)
Pen intake (Dt_DMIn_BWLategest_ pen, percentage of BW) is calculated as the integral from An_WkPrePartDurat to 0:
(Equation 20-16)
Because the Hayirli et al. (2003) work reflected multiparous animals, total daily intake for individual animals (Dt_DMIn_ heifClose_Ind, kg/d) and for groups of animals (Dt_DMIn_Heifclose_Pen, kg/d) from 3 weeks before calving until calving is calculated from An_BW using a 12 percent reduction:
(Equation 20-17a)
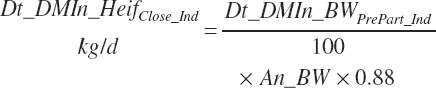
(Equation 20-17b)

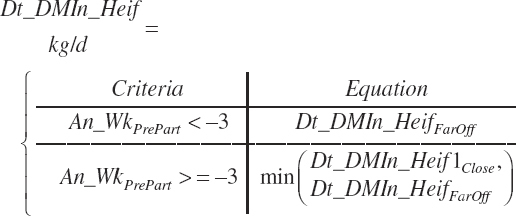
The model calculates intakes with each adjustment equation, and either approach can be chosen for the R code, but Equation 20-17 is used for late-gestation adjustments by the software. Heifer intake (both Dt_DMIn_Heif1 and Dt_DMInHeif2) for the entire period is thus predicted by selection of the far-off or close-up equations based on the user-specified days before calving. Because the close-up equation is discontinuous with the far-off equation, the exact time before calving where the transition in equations occurs is not specified but rather subject to a minimum test:
(Equation 20-18)
Nonlactating Cows
DMI for nonlactating, multiparous cows is predicted based on Chapter 12 as
(Equation 20-19)

(Equation 20-20)
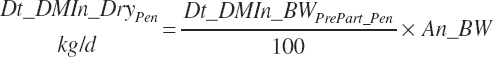
The first equation will predict constant intake for An_WkPrePart less than −3, and the second will approach an asymptote a little further away from calving as the late-gestation drop in intake is diluted over longer periods at normal intakes.
Lactating Cows
As for heifers, DMI for lactating cows is predicted based solely on animal factors or a combination of animal and dietary factors. The animal factor equation is
(Equation 20-21)
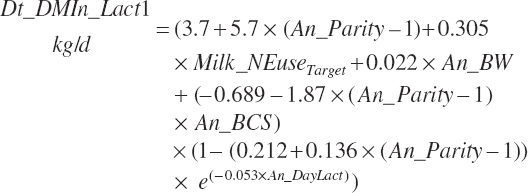
where An_Parity is parity expressed as a real value ranging from 1 to 2 with 1 denoting primiparous and 2 multiparous. For individual animals, this value is obviously binary, but for groups of animals, it reflects the mean for the group. Mlk_NEuseTarget (Mcal/d) is the NE output for the desired milk output, which is calculated from user-specified, target milk production (Mlk_ProdTarget, kg/d) and composition (Equation 20-217).
As discussed for the dry cow equation, the nonlinear change in predicted intake associated with the exponential term will result in biased predictions for pen intakes when the pen mean days in milk (DIM) is used unless all animals in the pen have identical DIM. Thus, the equation should be integrated over the time range for the pen for pens containing cattle that are less than 90 DIM, the point where the function reaches a plateau. However, the error will be very small provided all cows are greater than 45 DIM. From calving until 45 DIM, use of the pen mean DIM directly with Equation 20-21 will result in a substantial overprediction of DMIn for the pen.
Lactating cow intake is also predicted from a combination of feed and animal factors as
(Equation 20-22)
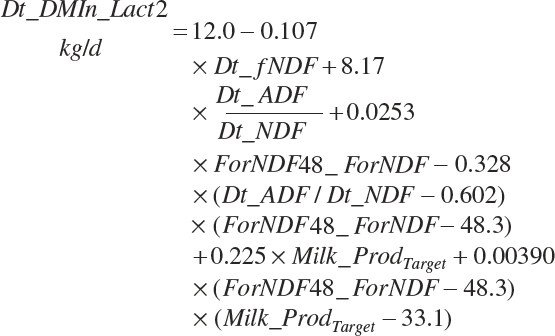
This equation can be expected to be valid for predictions of cows greater than 60 DIM. Predictions for early lactation likely will not be representative due to the lack of a term describing the lag in DMIn from calving to 60 DIM.
Intake Selection
Dt_DMIn (kg/d) is either specified or predicted by setting An_DMIeqn to the number of the desired equation where a choice of 0 utilizes Dt_DMInTarget.
(Equation 20-23)
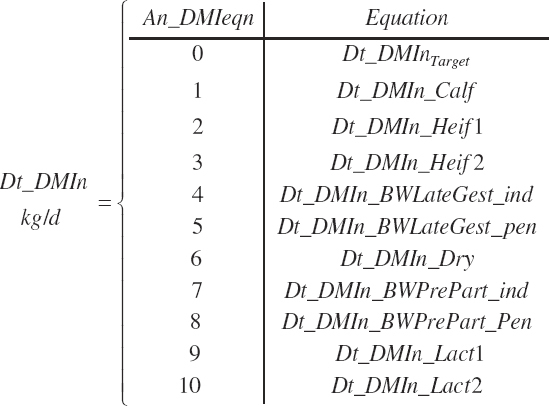
The choice of physiological state can be used to narrow the selection list for intake equations to those available for the chosen state. For example, if Heifer is chosen as the physiological state, the intake equations offered will be a user-specified intake or intake predicted by Equation 20-10 or 20-11.
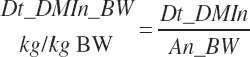
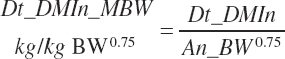
The selected DMIn is also expressed as proportions of An_BW or metabolic An_BW (An_MBW = An_BW0.75):
(Equation 20-24)
(Equation 20-25)
Dietary Nutrient Concentrations and Intake of Feed Nutrients
The intake of each feed ingredient ( f ) is calculated from Dt_DMIn and the user-specified dietary DM proportions (kg/kg) for each ingredient:
(Equation 20-26)
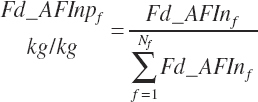
As fed intake and proportions are calculated based on the user-entered DM content of each ingredient:
(Equation 20-27a)
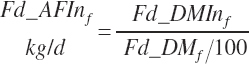
(Equation 20-27b)
Some predictions are based on feed type or category. Several of these categories are those used by NRC (2001), but additional categories were added. The list of categories is provided in Table 20-7.
Additionally, wet forage was defined as forages with less than 71 percent DM and dry forages as those with 71 percent DM or greater. Although the ingredients are categorized in the feed library, the designations are converted to dietary percentages (i.e., 100 percent for ingredients in the category and 0 percent for ingredients not in the category). This allows calculation of a proportion of the diet derived from each category as a continuous variable (i.e., 45 percent of the diet is concentrate), which is required for application in prediction equations. The general form of this equation is
(Equation 20-28)
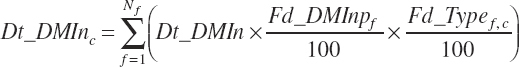
where Fd_Typef,c was equal to 100 for ingredients in category c and 0 for ingredients not in category c.
TABLE 20-7Feed Categories Used for Model Calculations
| Category | Description |
|---|---|
| Additive |
|
| Animal protein |
|
| By-product/other |
|
| Calf liquid feed |
|
| Calf liquid feed |
|
| Energy source |
|
| FA supplement |
|
| Fat supplement |
|
| Grain crop forage |
|
| Grass/legume forage |
|
| Pasture |
|
| Plant protein |
|
| Sugar/sugar alcohols |
|
| Vitamin/mineral |
|
Categories are used to make finding a feed easier and to ensure the proper equations for estimating energy and other variables are used. Users must choose a correct category for accurate results.
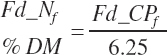
Additional nutrient-based variables are derived from the base nutrients specified in the feed library. These included
(Equation 20-29)

(Equation 20-30)
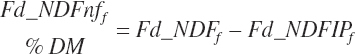
(Equation 20-31)
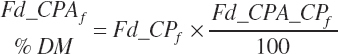
(Equation 20-32)
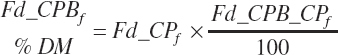
(Equation 20-33)
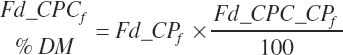
(Equation 20-34)

(Equation 20-35)
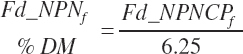
(Equation 20-36)
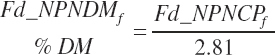
(Equation 20-37)

(Equation 20-38)
Because dietary FAs are specified as an input to the model rather that triglycerides (TGs), the mass of FA present in the feed varies depending on the form of the fat where free FAs are hydrated and thus require no correction while FAs present in TGs are hydrated when cleaved from the TG for further metabolism. Thus, a hydration factor must be specified at the feed level and used to calculate FA content:
(Equation 20-39)

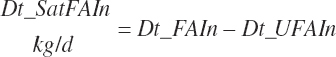
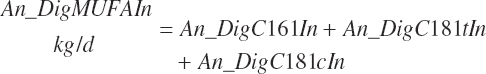
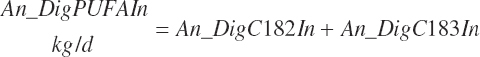
Intake of individual FAs was also calculated and used to generate dietary intakes of total unsaturated (Dt_UFAIn), monounsaturated (Dt_MUFAIn), polyunsaturated (Dt_PUFAIn), and saturated FAs (Dt_SatFAIn):
(Equation 20-40a)
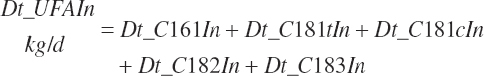
(Equation 20-40b)
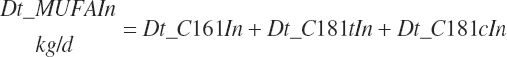
(Equation 20-40c)
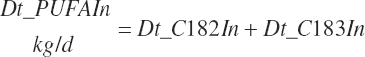
(Equation 20-40d)
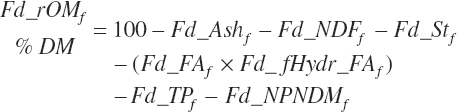
Residual organic matter (rOM)1 represents the remainder after subtraction of ash, NDF, St, FA, TP, and NPN DM:
(Equation 20-41)
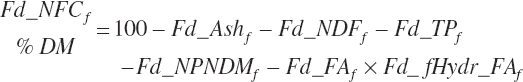
For historical purposes, nonfiber carbohydrate (NFC) is calculated as
(Equation 20-42)
Nutrient (Nut) intakes from each feed are subsequently calculated from the nutrient concentrations and the DMI of each feed as defined by Equation 20-26:
(Equation 20-43)

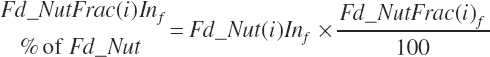
Forage and concentrate intakes are calculated in the same manner. Intake of nutrients expressed as a percentage of the parent nutrient (ForNDF, CP fractions, AA, and FA) is calculated as
(Equation 20-44)
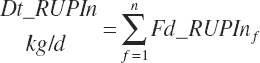
Each of the above nutrients is subsequently summed to yield dietary nutrient intakes:
(Equation 20-45)
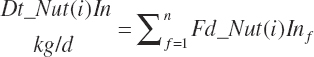
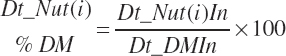
where n represents the number of ingredients in the diet. Dietary nutrient concentrations and concentrations of concentrate and forage in the diet are calculated as
(Equation 20-46)
Vitamin and mineral concentrations are stoichiometrically adjusted to achieve the units denoted in Table 20-2.
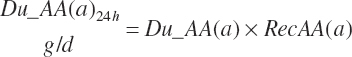
AA intakes (g/d) are calculated as
(Equation 20-47)
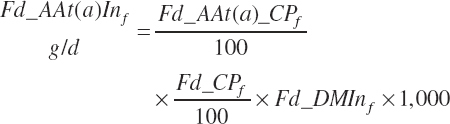
where Fd_AAt(a)_CP represented the true AA content of the ingredient (percentage of CP), which is predicted from feed library values as
TABLE 20-8Fractional Recovery (recaa, G Observed/G True) and Hydration Factors (G Anhydrous AA/G Hydrated AA) for Adjustment of AA Composition Determined by a Standard 24-Hour Acid Hydrolysis and for Conversion from Protein Bound to Free Forms
| Amino Acid | Recovery | Hydration |
|---|---|---|
| Arg | 0.943 | 0.8967 |
| His | 0.932 | 0.884 |
| Ile | 0.893 | 0.8628 |
| Leu | 0.939 | 0.8628 |
| Lys | 0.938 | 0.8769 |
| Met | 0.952 | 0.8794 |
| Phe | 0.943 | 0.891 |
| Thr | 0.937 | 0.849 |
| Trp | 0.943 | 0.9118 |
| Val | 0.907 | 0.8464 |
(Equation 20-48)

a denoted each of the 10 essential AAs, and recAA(a) represented the predicted recovery of each AA during acid hydrolysis (see Table 20-8 and discussion in Chapter 6). Reported AA composition also reflects the addition of water across the peptide bond. AAs are measured in free form and reported as such. Therefore, summation of the complete set of reported AAs derived from a protein evaluation that is corrected for incomplete recovery during hydrolysis would be approximately 115 percent of the mass of the starting protein, the difference being the water added to each AA during hydrolysis. The committee decided to calculate the AA flows in hydrated form despite them generally existing in dehydrated, protein-bound form before digestion. In this manner, the predicted AA flows would be expected to match observed AA flows as determined from AA analyses of the hydrolyzed protein after correction for hydrolysis recovery. As will be discussed later, this will also be the case for exported AA in milk protein and so forth, and thus corrections must be made for hydration change when utilizing absorbed AA for synthesis of those proteins. Hydration factors are reported in Table 20-8.
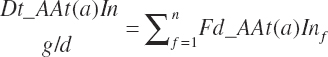
Dietary intakes (g/d) are calculated by summation of the AA intakes for each ingredient in the diet as for other nutrients:
(Equation 20-49)
Infusions
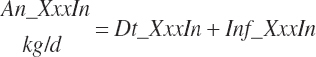
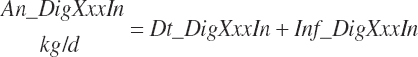
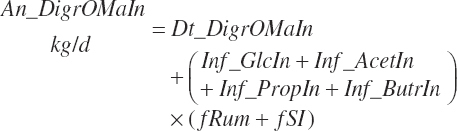
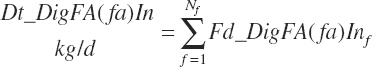
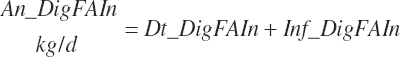
Although not within the specific charge of the committee, nutrient infusions are often used in nutrition trials to provide additional information on animal responses to varying nutrient supply, and consideration of those infusions is required to make use of the broadest range in nutrient inputs during model development. Such studies often provide clean, independent evaluations of responses at different entry points, and support for their inclusion was important to better define responses. For example, many studies have been conducted to relate rates of production to incremental changes in a nutrient introduced by infusion (Derrig et al., 1974; Storry et al., 1974; Spires et al., 1975). As these types of trials typically have more power in terms of regression analyses, it was deemed important to accommodate such infusions as possible inputs in the model. The infusion inputs are denoted throughout the model using the abbreviation form inf_Xxx, where Xxx denotes the nutrient. Total input was calculated by summation of diet and infusion inputs and denoted using a prefix of “An_” in place of “Dt_” as demonstrated in the following generic nutrient input and nutrient digestion equations:
(Equation 20-50)
(Equation 20-51)
No additional documentation is provided as the variables and their inputs to the model should be self-explanatory.
Ruminal Nutrient Digestion of Neutral Detergent Fiber and Starch
Ruminal digestibility of NDF and starch is predicted as described in Chapter 6:
(Equation 20-52)

(Equation 20-53)
Both digestion coefficients were bounded by 0 and 100 to ensure biological consistency and set to the mean values of 37.6 and 65.6 percent of the parent nutrient, respectively, if missing. NDF and starch (st) digested in the rumen (kg/d) are calculated as
(Equation 20-54)

(Equation 20-55)
NDF and st passage from the rumen are calculated by difference:
(Equation 20-56)

(Equation 20-57)
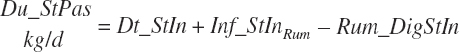
Diets containing only immature grass are found to result in slightly negative st passage, which is trapped and set to 0.
Rumen-Degradable and Undegradable Protein and Amino Acids
RDP and RUP (kg/d) were predicted from in situ data, but the passage rate model used in the prior work was replaced with static estimates for forage and concentrates (see Chapter 6).
(Equation 20-58)
(Equation 20-59)
(Equation 20-60)
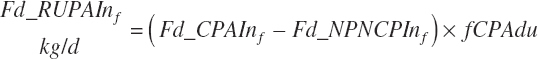
(Equation 20-61)
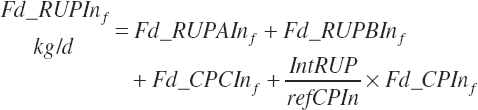
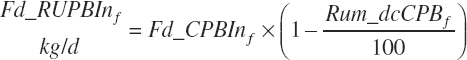
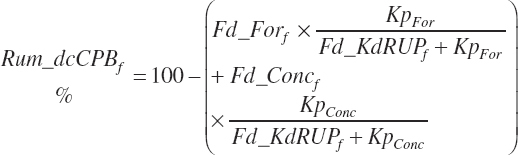
where Kpconc represented the rate of passage of protein in concentrates from the rumen and is 5.28 percent/h, KpFor represented the rate of passage of protein in forages from the rumen and is 4.87 percent/h, fCPAdu represented the fractional escape of the A fraction of CP from the rumen and is 0.064 kg/kg of the A fraction of CP, and intrUP represented the intercept from the regression equation fitted to the ruminal outflow data (see Chapter 6), which is −0.086 kg/d at the diet level. Application of the dietary intercept to feeds within the diet requires scaling. This is achieved by dividing the intercept by the mean CP intake for the ruminal outflow data (refCPin, 3.39 kg/d) and multiplication times the CP intake for each ingredient (Fd_CPInf). This scaling approach does not exactly match the dietary level calculation as derived, but it is very close (<1 percent error) and preserves the ability to calculate contributions of protein and AA from each feed.
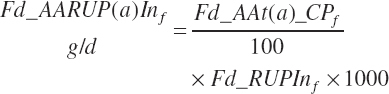
The flow of AA associated with RUP (g/d) is calculated from RUP (Fd_RUPIn) and the true AA composition (Fd_AAt(a)_CP, g/100 g CP) of each ingredient:
(Equation 20-62)
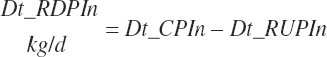
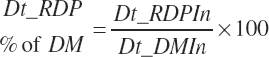
Dietary intakes of RUP, RDP, and AA in RUP (kg/d, kg/d, and g/d) are derived by summation across ingredients in the diet (RUP and AARUP) and by difference from CP intake (RDP):
(Equation 20-63)
(Equation 20-64)

(Equation 20-65)
(Equation 20-66)
(Equation 20-67)
(Equation 20-68)
The combination of dietary and infused supplies has been denoted with a location of An reflecting an overall animal supply:
(Equation 20-69)
(Equation 20-70)

(Equation 20-71)
(Equation 20-72)
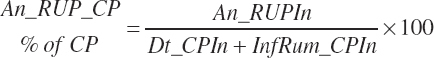
The proportion of feed AA captured in RUP is also calculated for reporting purposes:
(Equation 20-73)

Ruminal Microbial Protein
Microbial nitrogen outflow (Du_MiN_g, g/d) from the rumen is predicted using the equations described in Chapter 6.
(Equation 20-74)

where
(Equation 20-75)
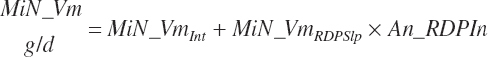
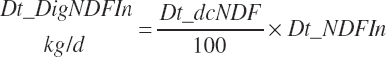
and MiN_Vmint = 100.8, MiN_VmRDPslp = 81.56, MiN_ KmrDNDF = 0.0939, and MiN_Kmrdst = 0.0274. Rum_DigNDFin and Rum_Digstin represent NDF and starch digested in the rumen (kg/d) as predicted from Equation 20-54 and Equation 20-55. An_RDPin represented the total RDP supply (kg/d) as predicted from Equation 20-69; however, the effect was capped to yield no additional responses above 12 percent dietary RDP.
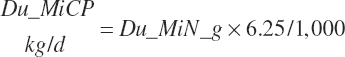
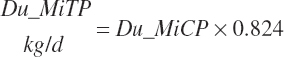
Microbial N flow is converted to CP and true protein (TP) flows (g/d) using static stoichiometric coefficients of 6.25 g of CP/g of N and 0.824 g of TP/g of CP. Maximum microbial CP was set at RDP intake.
(Equation 20-76)
(Equation 20-77)
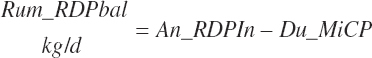
RDP balance in the rumen was estimated by difference from An_RDPin and Du_MicP:
(Equation 20-78)
Ruminal AA outflow associated with microbial flows (g/d) is calculated from the microbial true protein flows as
(Equation 20-79)
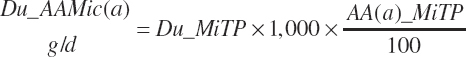
where AA(a)_MiTP represented the AA composition of microbial true protein (g/100 g; Table 6-2 in Chapter 6) with a denoting each of the 10 essential AAs (EAAs).
Endogenous and Total Protein and Amino Acid Flow from the Rumen
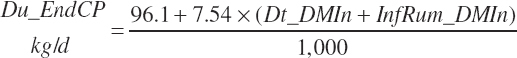
Endogenous protein flow (kg/d) from the rumen represented protein and nitrogen (N) secreted into the rumen from N sources that were previously absorbed. As such, they represent a maintenance cost to the animal and do not reflect a net addition to the nutrient supply. However, for comparisons to observed ruminal outflows of N, protein, and AAs, such flow must be predicted as it is represented in the flow measurements made in the animal. This flux (kg/d) is predicted as a linear function of DMIn:
(Equation 20-80)
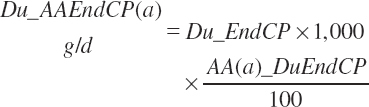
The AA flow (g/d) associated with the protein flow is predicted from Equation 20-80 and the AA composition listed in Table 6-5.
(Equation 20-81)
Total ruminal N (g/d) and AA outflows (g/d) are predicted as the summation of the RUP, microbial, and endogenous flows:
(Equation 20-82)
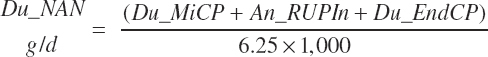
Nonammonia-nonmicrobial N (NANMN) flows (g/d) are generally reported in the literature and represented in the model as
(Equation 20-83)
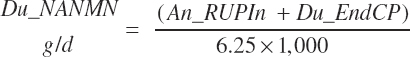
Ammonia outflow from the rumen is not explicitly represented in the model; however, the derived passage of RDP at 5 percent of the total RDP supply should contain ammonia given the basis of the difference calculation. Thus, the estimate of Du_NANMN given by Equation 20-83 is not a clean representation of the in vivo measurement. It more likely represents nonmicrobial N flow. However, for model evaluation purposes, predictions by Equation 20-83 are compared to reported NANMN flows in the literature.
(Equation 20-84)
and the proportion (percent) of AA leaving the rumen as AA is represented as
(Equation 20-85)
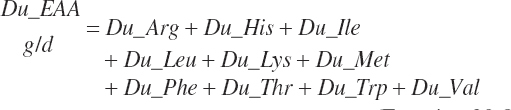
The flows are summed to yield a total essential AA (EAA) flow:
(Equation 20-86)
Because AA flows predicted by Equation 20-84 are expressed as true flows that have been corrected for incomplete recovery during AA analyses, uncorrected flows (g/d) are required for comparison to data reported in the literature. These values are provided solely for comparison purposes and have no other function in the model.
(Equation 20-87)
Total Tract Carbohydrate, Protein, and Fatty Acid Digestion and Absorption
Digestion and absorption of carbohydrates, protein, and FAs from the intestine and the total tract are defined in this section.
Carbohydrate Digestion and Absorption
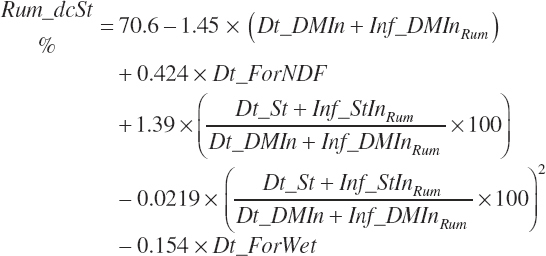
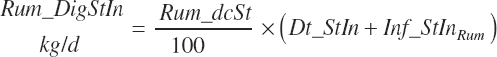
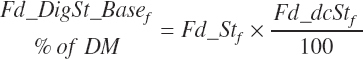
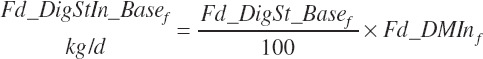
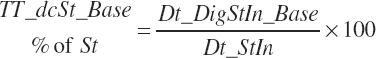
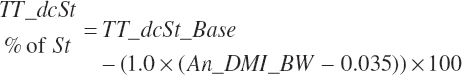
Total tract starch digestion is based on ingredient-specific, base digestibility constants (Fd_dcStf, percentage of St) from Table 3-1 (in Chapter 3), which are adjusted to reflect a digestibility reduction as Dt_DMIn increases:
(Equation 20-88)
(Equation 20-89)
(Equation 20-90)

(Equation 20-91)
The base digestibility is subsequently adjusted based on An_DMIn as a proportion of BW and centered to 3.5 percent of BW to reflect reduced digestion at high intakes:
(Equation 20-92)
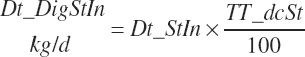
which was bounded by 0 on the low end. Digested starch is subsequently estimated for the specified An_DMIn as
(Equation 20-93)
(Equation 20-94)
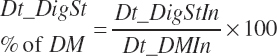
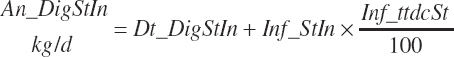
Total digested starch was
(Equation 20-95)
(Equation 20-96)
(Equation 20-97)
(Equation 20-98)
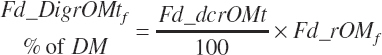
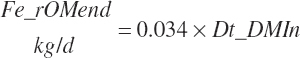
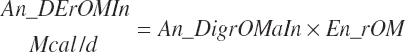
True digestibility of rOM (Dt_dcrOMt, percentage of rOM) was set at 96.1 percent with an endogenous fecal excretion of 3.43 percent of Dt_DMIn (see Chapter 3):
(Equation 20-99)
(Equation 20-100)
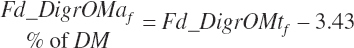
Apparent digested rOM intakes are also estimated for individual feeds as
(Equation 20-101)
(Equation 20-102)

These apparent rOM digestibility equations generate negative estimates for some feeds with very low rOM concentrations, including mineral sources. However, summation across all feeds in the diet generates reliable estimates for the diet given derivation of the source work from dietary observations.
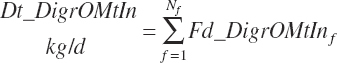
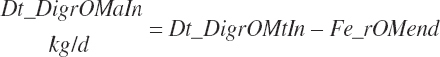
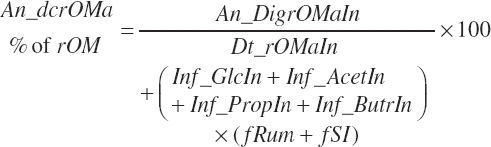
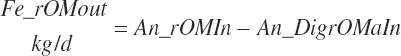
True and apparent digested rOM intakes are thus
(Equation 20-103)

(Equation 20-104)
(Equation 20-105)
Infusions were considered as
(Equation 20-106)
(Equation 20-107)

(Equation 20-108)
(Equation 20-109)
Total tract digestion of NDF is calculated in a base state from ingredient lignin concentrations (Fd_dcNDF_Lg, percentage of NDF) or from observed 48-hour in vitro NDF digestibility assessments (Fd_dcNDF_iV48h, percentage of NDF) and subsequently adjusted to reflect the negative impacts of Dt_St and An_DMIn.
(Equation 20-110)
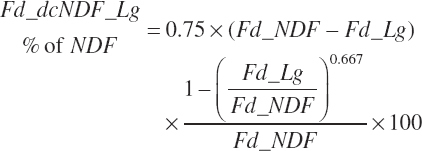
(Equation 20-111)
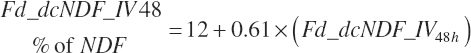
A selector (Use_dcNDF_iV) is used to select Equation 20-110 or Equation 20-111 to represent the base digestibility for forages only (1) or for all feeds (2). In both cases, the Lg based prediction is used if an IV value is missing.
(Equation 20-112)

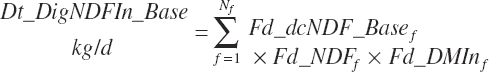
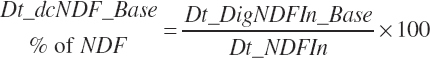
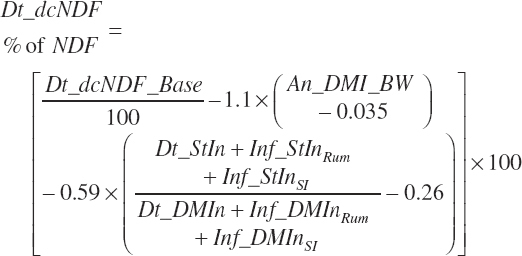
The base digested NDF is calculated at an ingredient level, summed to a diet total, and subsequently discounted to reflect the negative impacts of dietary starch concentration and DMIn:
(Equation 20-113)
(Equation 20-114)
(Equation 20-115)
(Equation 20-116)
(Equation 20-117)
(Equation 20-118)
(Equation 20-119)
(Equation 20-120)
Protein and Amino Acid Digestion and Absorption
Protein
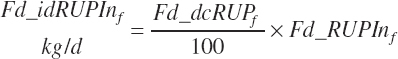
Because each ingredient has an intrinsic RUP digestibility as defined in the feed library, the total intestinal digestibility of RUP (Dt_idRUPIn, kg/d) must be summed from the individual ingredients:
(Equation 20-121)
(Equation 20-122)

(Equation 20-123)

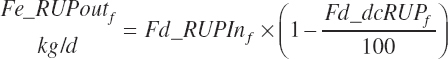
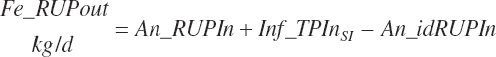
Fecal output of undigested RUP is calculated for each feed (Fe_rUPoutf, kg/d) from the feed digestibilities and for the diet (Fe_rUPout, kg/d) by difference.
(Equation 20-124)
(Equation 20-125)
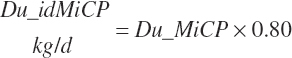
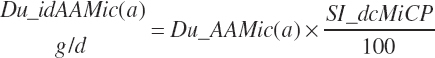
Intestinal digestibility of microbial protein flowing from the rumen (Du_idMicP, kg/d) is assumed to be 80 percent:
(Equation 20-126)
and the proportion of digested microbial protein that is true protein is assumed to be 82.4 percent:
(Equation 20-127)

Fecal undigested microbial CP output (Fe_MiCPout, kg/d) derived from ruminal microbes is calculated by difference:
(Equation 20-128)
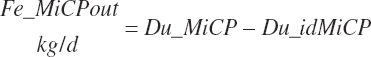
and does not include any microbial CP synthesized in the large intestine.
(Equation 20-129)
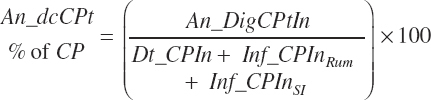
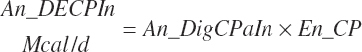
Total tract apparent and true CP and TP digested (kg/d) and digestibility (percent) are calculated as
(Equation 20-130)
(Equation 20-131)
(Equation 20-132)

(Equation 20-133)
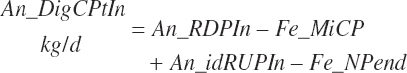
(Equation 20-134)
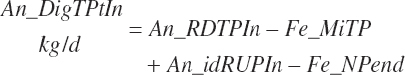
(Equation 20-135)
MP intake (An_MPin, kg/d) and dietary concentration (percentage of DM) are calculated as
(Equation 20-136)
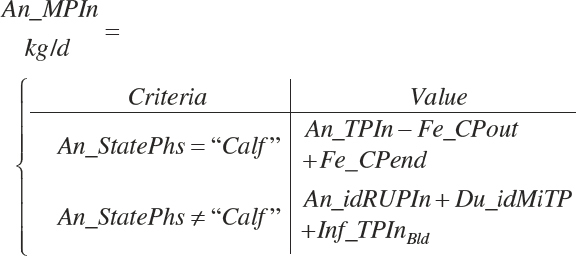
(Equation 20-137)
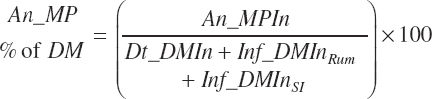
The choice to express An_MPin relative to only the DM provided in the intestinal tract is arbitrary; it is also logical to calculate it using all sources (i.e., An_DMIn).
Although ruminal digestion is calculated for all animal types, the data used for those predictions do not include any from calves, and thus a more empirical, total tract digestibility approach was used for animals in that physiological state. The software is configured to exclude ruminal digestion predictions, and the user should do the same for prediction derived from R code. Additionally, the user should ensure that infused proteins or AA are specified with appropriate digestion coefficients given the form of Equation 20-136.
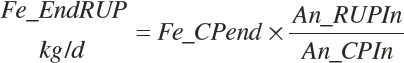
Fecal CP and N output (Fe_CPout and Fe_Nout, kg/d) are calculated as
(Equation 20-138)

where Dt_CPIn was 95 percent digested for liquid feeds and 75 percent digested for dry feeds fed to calves.
(Equation 20-139)

(Equation 20-140)
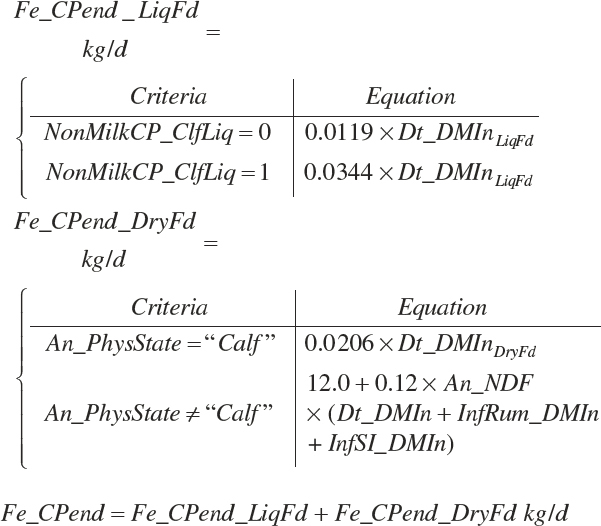
Fe_EndCP was arbitrarily assigned to An_RDP and An_RDP to provide an approximation of the contributions of each to endogenous secretions.
(Equation 20-141)

(Equation 20-142)
Amino Acids
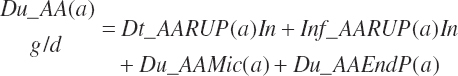
The intestinally digested EAA arising from each feed is defined as a function of the feed EAA input (Fd_AARUPIn(i)f, g/d) and the digestibility of the RUP:
(Equation 20-143)

where F_idAArUP(a) (g/g) represented a factor to adjust the intestinal digestibility of individual AAs relative to that of RUP, and (a) represented each EAA. However, as noted in Chapter 6, the data are inadequate at this time to uniquely define such factors, and thus the values are all set to 1.
The total intestinally digested supply of each EAA arising from RUP (Dt_idAARUPIn(a), g/d) is the sum of that arising from each feed:
(Equation 20-144)

Intestinally digested EAAs derived from microbial protein leaving the rumen (Du_idAAMic(a), g/d) are calculated from the duodenal microbial AA flows:
(Equation 20-145)
The supply of intestinally digested AA is by summation:
(Equation 20-146)
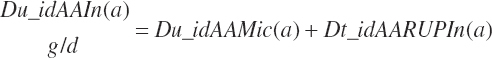
(Equation 20-147)

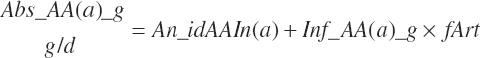
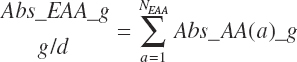
Finally, the total absorbed AA, EAA, and nonessential AA (NEAA) supplies were
(Equation 20-148)
(Equation 20-149)
(Equation 20-150)

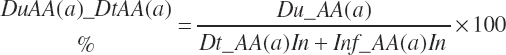
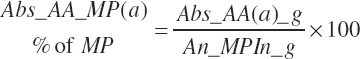
where fArt is the proportion of infused TP introduced into the blood supply (g/g) defined by Equation 20-147. The factor of 1.15 represents the average mass of hydration when converting protein to free AA. The absorbed supply of each EAA is also expressed as a percentage of the total EAA supply and the MP supply:
(Equation 20-151)
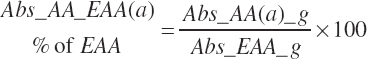
(Equation 20-152)
Fatty Acid Digestion and Absorption
Digestibility of total FAs in the total tract is specified in the feed library by ingredient as described in Chapter 4. Missing values are filled with a default value of 73 percent except for ingredients placed in the fat or FA supplement categories, which are set as described in Chapter 4. All ingredients in the concentrate feed category use a digestibility of 81 percent regardless of the library entry when An_StatePhys is set to calf. Digested total, unsaturated, monounsaturated, polyunsaturated, saturated, and individual FA intakes (kg/d) are subsequently calculated by ingredient assuming the digestibility of each FA ( fa) is equivalent to the total as for AA digestibility:
(Equation 20-153)

(Equation 20-154)
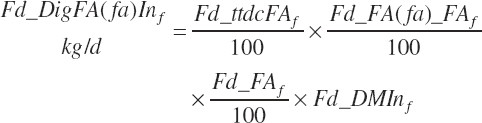
where FA represented total FA and fa represented each individual FA (C12, C14, C16, C16:1, C18:0, C18:1c, C18:1t, C18:2, C18:3, and other FA). Total and individual digested FA dietary intakes from each ingredient are summed to yield dietary digested FA intakes (kg/d):
(Equation 20-155)
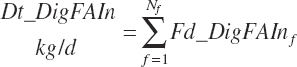
(Equation 20-156)
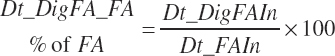
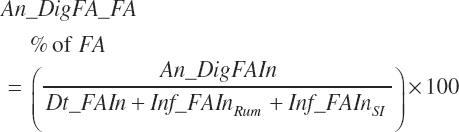
Dietary digestibilities (percent) of total and individual FA are calculated as
(Equation 20-157)
(Equation 20-158)

(Equation 20-159)
Intake and digestibility of individual FAs were not considered but could easily be added to the model given FA composition and digestibility of the infusate.
(Equation 20-160)
Digested unsaturated (An_DigUFAIn, kg/d), monounsaturated (An_DigMUFAIn, kg/d), polyunsaturated (An_DigPUFAIn, kg/d), and saturated (An_DigsatFAIn, kg/d) digested FAs are calculated by summation or difference as
(Equation 20-161a)

(Equation 20-161b)
(Equation 20-161c)
(Equation 20-161d)

However, only total FA digestibility information is output because biohydrogenation is not modeled. Fecal total FA output is calculated by difference:
(Equation 20-162)

Total tract apparent digestibility of total FA is calculated as
(Equation 20-163)
Fecal output and apparent digestibilities of individual FAs can be calculated in a similar manner, but such data are not adequately represented in the literature, and thus those equations were not included.
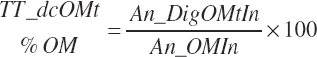
Having predicted fecal outputs of all of the primary OM components, digested OM and fecal output of OM (kg/d) are predicted as
(Equation 20-164)
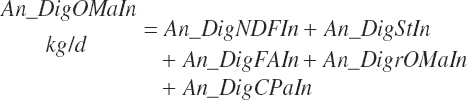
(Equation 20-165)
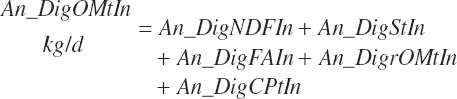
(Equation 20-166)
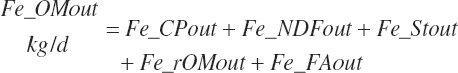
(Equation 20-167)

(Equation 20-168)
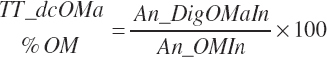
(Equation 20-169)
Gross, Digestible, and Metabolizable Energy Supply
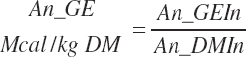
GE supply (Mcal/d) and dietary concentration (Mcal/kg) of GE are calculated from total nutrient intakes and the heats of combustion for each nutrient (see Table 20-9):
(Equation 20-170)
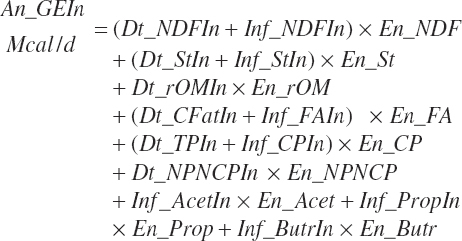
TABLE 20-9Heats of Combustion (Mcal/kg) for Digested Nutrients
| Nutrient | Variable Name | Enthalpy (Mcal/kg) |
|---|---|---|
| rOM | En_rOM | 4.0 |
| Starch | En_St | 4.23 |
| NDF | En_NDF | 4.2 |
| CP | En_CP | 5.65 |
| NPN (CP basis) | En_NPNCP | 0.89 |
| FA | En_FA | 9.4 |
| Acetate | En_Acet | 3.48 |
| Propionate | En_Prop | 4.96 |
| Butyrate | En_Butr | 5.95 |
(Equation 20-171)
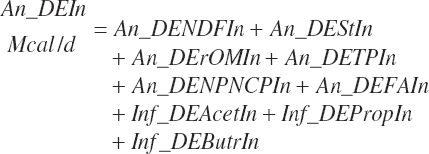
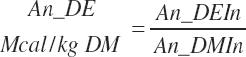
DE supply (Mcal/d) and concentrations (Mcal/kg) are calculated from digestible nutrient intakes and heats of combustion for each nutrient class:
(Equation 20-172)

(Equation 20-173)
(Equation 20-174)

(Equation 20-175)
(Equation 20-176)

(Equation 20-177)
(Equation 20-178)
(Equation 20-179)
(Equation 20-180)
(Equation 20-181)
(Equation 20-182)
(Equation 20-183)
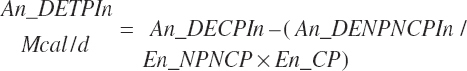
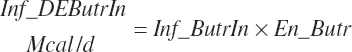
The DE supplied from protein is subtracted from the total DE supply, yielding a nonprotein DE (An_DEInp, Mcal/d) for use as an energy term in milk protein predictions that contained independent effects of MP or AA:
(Equation 20-184)

NUTRIENT UTILIZATION AND ANIMAL PRODUCTION
The general scheme is to estimate the NE and NP associated with each process (e.g., maintenance and production) and to convert NE or NP to ME or MP using an efficiency coefficient that is abbreviated as K with a subscript denoting the function: Kg, Kl, Km, or Ky for growth, lactation, maintenance, and gestation, respectively. Each is defined in the following sections.
Energy and Amino Acid Use for Milk Production: Milk Protein
Net protein in milk is predicted as outlined in Chapter 6:
(Equation 20-185)
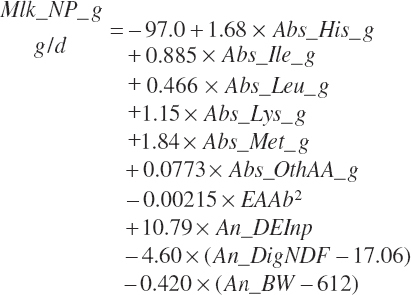
where Abs_OthAA (g/d) represented the sum of Abs_NEAA and absorbed supplies of Arg, Phe, Thr, Trp, and Val:
(Equation 20-186a)
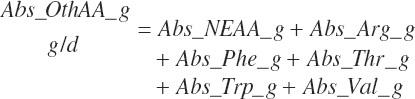
Abs_eAAb2 represented the sum of squares of the five EAAs with linear terms in the equation:
(Equation 20-186b)

The presence of a quadratic term in Equation 20-185 provides a significant application challenge. This will be problematic for even average herds as the model approaches the end of its expected usable life span (i.e., 15 years). Milk yield has increased linearly by 90 kg/y in the United States over the past several decades. At a feed DM conversion ratio of 1.5 kg of milk to 1 kg feed DM, this equates to 0.17 kg DMIn/d/y. Thus, over 15 years, one would expect DMIn to increase by 2.5 kg/d. At the mean MP concentration in the data set of 9.94 percent MP, this results in an additional 250 g of MP/d, which approximately equates to an additional 5.75 g absorbed methionine (Met)/d. Using 23 kg DMIn as a starting point for today, MP intake would be predicted to be 2,290 g/d and 52 g of absorbed Met. Adding 250 g of MP/d and 5.7 g absorbed Met/d to the starting point yields future mean supplies of 2,550 g MP/d and 58 g absorbed Met/d, which are 28 and 27 percent above the means for the data set, respectively. Such a Met supply is still below the apex of the quadratic for that term but only slightly so. Thus, the marginal efficiency predicted at those intakes would be very low.
Of greater concern than the average herd are the high genetic merit herds that exist today. Many U.S. commercial herds have average daily milk production of 45 kg/d or greater. To achieve that given a normal lactation curve, groups of animals at peak lactation must have pen averages of 60 kg/d or more with animals in that pen exceeding 80 kg/d. The maximum production for the data used herein is 53.8 kg/d. From Equation 20-186a, the maximum response to MP intake occurs at 3,087 g/d, which generates approximately 1,450 g milk protein/d depending on the An_DEInp value chosen. NRC (2001) predicts a DMIn of 33.6 kg/d for a mature cow weighing 750 kg and producing 60 kg of milk with 3.0 percent protein and 3.5 percent fat. At such a DMI, the MP intake would be 3,087 g/d, the content at the maximum response, which yields a dietary MP concentration of 9.2 percent of DM as compared to the mean concentration of 9.9 percent for the data set. Production above 60 kg/d would not be predicted to benefit from further additions of dietary protein given this plateau. Thus, a group at 70 kg/d would be predicted to require 3,087 g MP/d, as would a group or cows at 80 kg of milk/d. At a predicted DMIn of 37 kg/d for 70 kg of milk, the dietary MP concentration would fall to 8.3 percent of DM and a CP content below 14 percent. Progression to 80 kg of milk/d would further decrease the dietary CP content as DMIn scaled upward. Thus, the plateau must increase as genetic potential improves.
The problem was verified by the committee through exploration of the effect of study age on the quadratic term. When the data were split roughly in half using year 2000 as a dividing point, the plateau for predictions of milk protein was 1,051 g/d at an absorbed EAA supply of 1,673 g EAA/d for the data prior to 2000 when using a DE intake from nonprotein components (DEInp) value of 74 Mcal/d. When fit to the data published after 2000, the derived response was nearly linear with a maximum occurring at 6,415 g of absorbed EAA/d. Adding an age variable to the model with a value of 0 for pre-2000 publications and 1 for the remainder and using it to estimate different EAA and DEInp slope coefficients by age factor across the entire data set resulted in plateau estimates of 1,312 g/d milk protein at 1,559 g EAA/d and 1,854 g/d milk protein at 3,767 g EAA/d for the old and new data, respectively. Thus, both approaches support the concept of a plateau that increases over time, but the estimates are quite different depending on the approach. Attempts to refine the latter approach to yield the change in quadratic value by decade resulted in insignificance for all terms, indicating the model was overparameterized and the results unreliable.
Milk Protein Production Scaling Factors
Given the need to scale the quadratic term to accommodate high genetic merit animals, a method of accomplishing this in a reliable manner was required. This is not a new concept, and it has been visually presented for the effects of energy on milk protein production by Orskov (1992), where energy intake can be expected to scale with genetic potential. A similar response was derived by Hanigan et al. (1998) with respect to the impact of energy supply on milk protein production.
Reproducing the conceptual responses with a quadratic requires derivation of combinations of the linear and quadratic terms that yield the desired response pattern. These can be used to formulate a system of equations that can be solved for a series of plateaus that yield similar responses in the linear range. For demonstration purposes, a simple quadratic MP-based model is used:
(Equation 20-187)

where An_MPin is expressed in g/d.
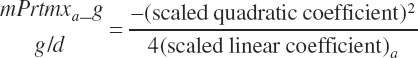
From the conceptual framework, it was assumed that a reference point on the lower range of the linear portion of the response could be chosen and that the response in the rescaled equation at that absorbed EAA input would be the same. Furthermore, it can be assumed that the intercept will be the same regardless of scaling. One can define two points on the rescaled curve (actually three if one considers the intercept), which can be used to solve for the two unknown parameters (i.e., the linear and quadratic coefficients). Using the commonly accepted generic terms to define the quadratic in symbolic form, the system of equations is
(Equation 20-188)
(Equation 20-189)
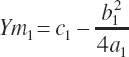
(Equation 20-190)

where Ym is the plateau and Xm is the EAA concentration yielding that plateau. The subscript of 1 denotes the derived parameters (a, b, c) and corresponding predicted value (Y) for an existing equation (i.e., Equation 20-187).
The second set of equations defining the rescaled parameters and thus state is represented as
(Equation 20-191)
(Equation 20-192)
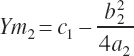
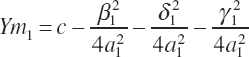
(Equation 20-193)

Note that the intercept is common to the two sets of equations. Using the parameters from Equation 20-188, Ym1 and Xm1 are defined by Equation 20-189 and Equation 20-190 as 1,043 g/d and 2,987 g/d, respectively. Evaluating Equation 20-188 at 10 percent of Xm1 (299 g/d; denoted as x1) yields an estimate for Y1 of 219 g/d.
(Equation 20-194)
Assuming, for example, that the plateau should be doubled to 2,086 g/d (represented by Ym2) and that the rescaled equation should also predict Y to be 219 g/d at X1 yields
(Equation 20-195)
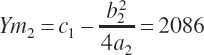
(Equation 20-196)
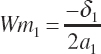
Assuming the intercept remains unchanged and thus can be removed, Equation 20-195 and Equation 20-196 can be solved algebraically for a and b:
(Equation 20-197)
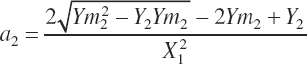
(Equation 20-198)
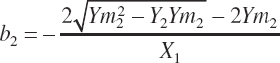
The resulting rescaled a and b yield a greater plateau with a similar response pattern in the linear portions of the curve (see Figure 20-1).
FIGURE 20-1
Example of quadratic scaling using the parameter estimates for Equation 20-187 for milk protein responses to MP intake and Equation 20-197 and Equation 20-198 to calculate rescaled linear and quadratic terms given maximal responses of 1.25, 1.5, 1.75, (more...)
The above can be adapted to an equation with multiple EAAs, such as Equation 20-185. Expansion of the model demonstrates that the form is a summation of individual quadratics using a common a term across the EAA:
(Equation 20-199)
Given parameter estimates for a1, β1, δ1, γ1, and c, the maximal response (Ym1) can be determined by summation of the individual responses and the intercept:
(Equation 20-200)
Excluding the intercept, which is assumed to be unaffected by animal potential, the maximal response to each EAA can be represented by the individual terms:
(Equation 20-201)

(Equation 20-202)

(Equation 20-203)

and the concentrations of each EAA that yields the respective Ym calculated as
(Equation 20-204)

(Equation 20-205)
(Equation 20-206)

Because each term in Equation 20-200 is additive, a new maximal response for each substrate can be set relative to the prior maximums using a common scalar. For example, if the user desires a doubling of the maximal overall rate, then Equations 20-201 to 20-203 would be set to two times their prior maximal values, Equation 20-199 minus the intercept would be evaluated at 10 percent of the maximal concentrations defined by Equations 20-204 to 20-206 using the prior coefficients, and new a2, β2, δ2, and γ2 would be calculated using Equations 20-197 and 20-198. a2 would be the same for each AA, but the linear term would vary for each unless they all had identical slopes at the start. Application of the approach is demonstrated in Figure 20-2.

FIGURE 20-2
Predictions of milk protein from Equation 20-185 using the original parameters or after scaling to a plateau that was twice that of the original equation. Individual amino acid and energy concentrations were the observed minimum, first quartile, mean, (more...)
This approach can be applied in the field based on herd characteristics. Ideally, this would be the genetic or genomic profiles for the groups of interest; however, such a scalar would have to be developed. An interim approach is to scale the maximum responses to average herd productivity. Such an approach reflects both genetic potential and management and thus also potentially captures some undefined components of management.
In the model, the scalar is based on an observed 305-day rolling herd average for milk protein (Mlk_NPrhA(305d)). The average DIM for the data set used to derive the model was 136 days, which is close to the midpoint of a 305-day record. Thus, the potential of animals used in the summarized data is reflected in the mean milk protein production of 918 g/d. This equates to 305-day milk protein production of 280 kg. The scalar for application to any herd of animals is thus
(Equation 20-207)
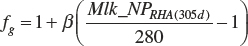
where Mlk_NPrhA(305d) is expressed as milk protein per 305 days (kg), and βg is expected to be 1. Should the scaling prove to be over- or underresponsive, one could adjust β to achieve more or less responsiveness based on observational data, but at this time, a value of 1 should be used.
The above scaling is incorporated into the model, and therefore the model requires a 305-day milk protein production (kg) as an input.
Target milk protein production selection should be assessed for feasibility relative to the maximal milk protein production. Selection of a target that exceeds the scaled maximal production cannot be expected to yield predictions that achieve the target production. Such a monitor is provided as a ratio of Mlk_NP_ g over Mlk_NPmax_ g:
(Equation 20-208)
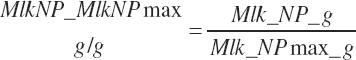
where Mlk_NPmax_ g (g/d) represents the maximal production and is calculated as
(Equation 20-209)
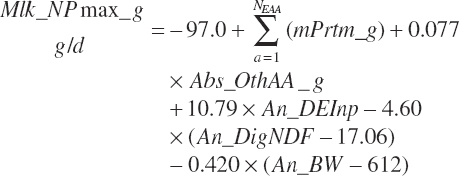
and the max response for each EAA was calculated from Equation 20-209 using the rescaled model linear and quadratic EAA parameters:
(Equation 20-210)
As production can generally be increased by more than 10 percent for short periods of time by feeding very high-grain diets (prior to development of acidosis-related problems), it can generally be assumed that the genetic potential for milk protein production is greater than expressed production, and thus MlkNP_MlkNPmax should generally be less than 0.9, and if not, Mlk_NPrhA(305d) should be increased to achieve a ratio of 0.9 or lower.
It is expected that Equation 20-185 with appropriate scaling to current herd production will result in the most accurate and precise prediction of milk protein output given its reliance on energy supply plus the availability of five key EAAs. However, milk protein output is also predicted from MP supply after subtraction of MP used for maintenance using an assumed, static target MP efficiency of use provided in Chapter 6. As detailed below, such a prediction is not particularly accurate or precise. The user can also use the mPrt_eqn setting to use the Trg_MilkTPp as a specified production level. Subsequent equations calculating AA use, AA efficiency, and MP balance are based on the user-specified target in this case.
AA export in milk protein (AAL(a), g/d) is calculated as the product of Mlk_NP_g (predicted or user specified) and the composition of milk protein (AA(a)_NP, g hydrated AA/100 g Mlk_NP; see Table 6-5).
(Equation 20-211)
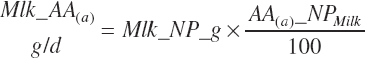
where a denoted each EAA (arginine [Arg], histidine [His], isoleucine [Ile], leucine [Leu], lysine [Lys], methionine [Met], phenylalanine [Phe], threonine [Thr], tryptophan [Trp], and valine [Val]). As the composition of the AAs is expressed in hydrated (free) form, the summation of all 20 AAs in milk protein would equate to approximately 115 g/100 g of milk TP. The AAs are handled in this form throughout. This correction has been ignored in the past, leading to some bias in the balance of AAs.
MP required for Mlk_NP (An_MPlUse, kg/d) is calculated as
(Equation 20-212)
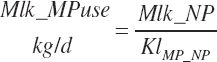
where KlMp_NP (g/g) is set to the predicted fractional efficiency of MP conversion to protein defined by Equation 20-355. This efficiency reflects the prevailing feeding conditions and thus does not reflect the achievable minimum MP required. Thus, MPuse predicted by Equation 20-212 is not a true reflection of that process.
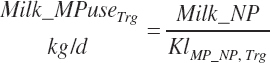
To address that deficiency and to provide more information, MP to support milk production is also predicted using a static conversion coefficient as for NRC (2001) as a reference point. In this latter case, KlMP_NP,Trg was set to 0.69, reflecting the observed target efficiency for conversion of MP to export proteins as outlined in Chapter 6. Such a level of production reflects the average best mix of EAA and energy present in the literature, which may or may not reflect the true biological maximum. However, as it clearly was achieved in the population of data from the literature, it can serve as a minimum achievable target for Mlk_MPuse defined by Equation 20-212. Similarly, the efficiency of use of MP for export proteins determined in Equation 20-356 should be expected to be near or exceed 0.68 with ideal diets under ideal production conditions. Additional work is needed to define the true maximums for efficiency of use of MP and each EAA, but in the interim, the observed target efficiencies provided in Chapter 6 can be used as a guide.
(Equation 20-213)
(Equation 20-214)
Milk Fat
Given estimates of individual FA intakes, a milk fat prediction was developed and found to have merit. Although likely not as robust at the milk protein prediction, it offers some guidance on expected milk fat production, which is the second most important economic component of milk. Such a prediction allows optimization of diets with consideration of milk component value (protein and fat value) relative to dietary ingredient selection and cost.
The equation was developed using the same methods as for milk protein (i.e., an all-models approach with selection based on statistics and apparent biological validity). It was also cross-validated and evaluated with a selection of field observations. The following equation cross-evaluated well and had a root mean squared error (RMSE) of 205 g/d, representing 18.9 percent of the observed mean with a concordance correlation coefficient (CCC) of 0.62, 1.6 percent of the mean squared error (MSE) segregating in mean bias, and 5.2 percent of the MSE segregating in slope bias.
(Equation 20-215)
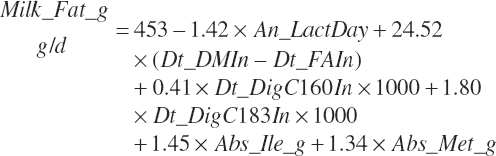
where Dt_DMIn and Dt_FAIn represented total DM and FA intakes (kg/d), respectively; Dt_Digc160in and Dt_Digc183in represented the predicted digested C16:0 and C18:3 intakes (kg/d), respectively; and Abs_ile_g and Abs_Met_g represented absorbed Ile and Met (g/d), respectively. An_LactDay was capped at a maximum of 375 d reflecting the general range of the data used for derivation of the equation.
The user-specified Trg_MilkFatp may also be used to specify the milk fat yield in place of Equation 20-215 by setting the mFat_eqn variable to 0 for an input as outlined for milk protein. In that case, all downstream calculations will utilize the specified level of production.
Milk Volume
Although economically unimportant in component-based markets, milk volume is still a benchmark used widely in the industry. The primary osmotic draw determining volume is provided by lactose, with lesser influence from protein and fat. However, because lactose is produced by lactose synthase, which contains alpha-lactalbumin as a required subunit, lactose synthase activity is largely determined by milk alpha-lactalbumin production. Thus, milk protein is a primary determinant of milk volume, with the proportion of alpha-lactalbumin contained in milk protein diverging slightly across animals and breeds, thus creating some variation. Using a similar approach as for milk protein and fat, the best equation to predict milk volume was
(Equation 20-216)
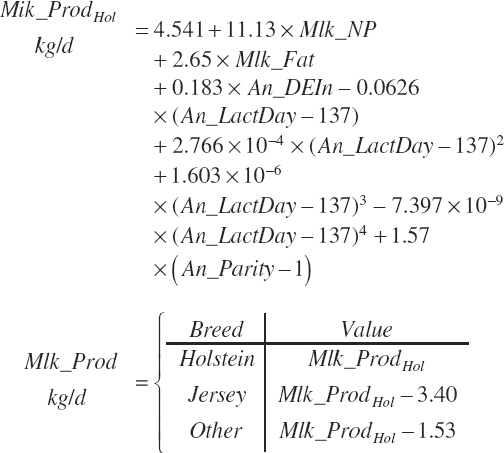
where Mlk_NP and Mlk_Fat were as predicted above (kg/d); An_LactDay and An_BW were centered to the mean of 137 days and 612 kg, respectively; and An_Parity was represented as a continuous variable reflecting the animal state or the pen average with 1 for primiparous animals and 2 for multiparous animals. Maximum An_LactDay was set at 375 d. The predicted volume of milk produced represents the base breed of Holstein. Production was reduced by 3.40 kg/d for Jersey cows and by 1.53 kg/d for cows from breeds other than Holstein or Jersey. The RMSE was 4.5 kg/d, which was 14.6 percent of the mean observed value with a CCC of 0.75, 0.1 percent of the MSE segregating in mean bias, and 3.3 percent of MSE segregating in slope bias.
The user-specified Trg_MilkTPp input variable may also be used to specify milk volume in place of Equation 20-216 by setting the mProd_eqn input variable to 0 as outlined for milk protein. In that case, all downstream calculations will utilize the specified level of production.
Milk Energy
If milk lactose is provided as an input, milk energy content (Mcal/kg) is predicted from the target or predicted concentrations of milk fat and milk TP (if milk CP is known, replace 5.85 with 5.5 in Equation 20-215) and the user-provided concentration of milk lactose:
(Equation 20-217)

This can be compared to the target milk energy content using user-specified target concentrations:
(Equation 20-218)
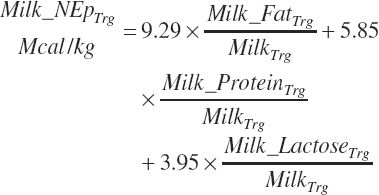
If milk lactose and protein are not available, the energy content can be predicted from milk fat using the equation of Tyrrell and Reid (1965):
(Equation 20-219)
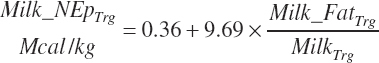
(Equation 20-220)
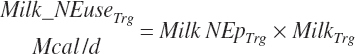
(Equation 20-221)

(Equation 20-222)
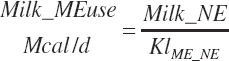
where KlMe_Ne reflects the efficiency of conversion of ME to NE for lactation, which was set to 0.66.
(Equation 20-223)

Energy and Amino Acid Use for Gestation
The model of Koong et al. (1975) was used to derive gravid uterine, fetal, and maternal tissue growth parameter estimates by fitting to the observations of Bell et al. (1995) and House and Bell (1993).
(Equation 20-224)

where Q represented the quantity of wet weight (kg), energy (Mcal), or protein (kg) at any day of gestation (DayGest); QDaygest = 0 was the quantity of each at conception; Kgrowth (d−1) was the initial rate growth in each; and Kgrowth decay (d−1) was the decay rate for growth. Initial gravid uterine and uterine weights were as reported by Bell (1995). The resulting model parameters are provided in Table 20-10.
The model was subsequently rearranged to allow the use of calf birth weight (Fetus_Wt, kg) and expected or observed gestational length as inputs rather than the quantity of tissue mass at conception. This allowed scaling of the growth curves to accommodate differences in fetal size and gestational length associated with animal size, age, and breed. Additionally, the model was modified to provide for uterine involution postpartum to maintain mass balance in the animal model. AAs arising from involution contributed to the total AA supply as described by Hanigan et al. (2009).
Gravid uterine and uterine (uterus plus caruncles) weights at parturition (Wt(t = parturition), kg) were calculated from calf birth weight (Fetus_Wt, kg) and the proportions of each ( fgrUter_Fetus and fUter_Fetus, kg/kg) derived from the fitted model.
(Equation 20-225)
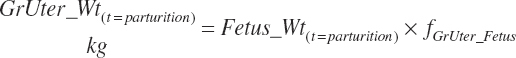
(Equation 20-226)
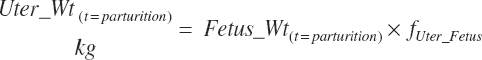
For a gestational length of 280 days, fgrUter_Fetus = 1.816 kg/kg and fUter_Fetus = 0.231 kg/kg.
TABLE 20-10Nonlinear Regression of Gravid Uterine, Uterine, and Fetal Wet Weights, Protein, and Net Energy on Day of Gestationa
| Gravid Uterus | Weight, kg | Energy, Mcal | Protein, kg | |||
|---|---|---|---|---|---|---|
| Estimate | SE | Estimate | SE | Estimate | SE | |
| QuantityInitial | 0.674 | 0.444 | 0.059 | |||
| KSyn, d−1 | 2.43 × 10⁻² | 1.0 × 10⁻³ | 2.25 × 10⁻² | 1.3 × 10⁻³ | 2.19 × 10⁻² | 1.1 × 10⁻³ |
| KSyn Decay | 2.45 × 10⁻⁵ | 4.1 × 10⁻⁶ | 1.35 × 10⁻⁵ | 5.0 × 10⁻⁶ | 1.16 × 10⁻⁵ | 4.3 × 10⁻⁶ |
| QuantityT = 280 | 89.0 | 88.6 | 10.9 | |||
| Fetus | Weight, kg | Energy, Mcal | Protein, kg | |||
| Estimate | SE | Estimate | SE | Estimate | SE | |
| QuantityInitial | 0.010 | 9.2 × 10⁻³ | 1.1 × 10⁻³ | |||
| KSyn, d−1 | 5.16 × 10⁻² | 1.1 × 10⁻³ | 4.95 × 10⁻² | 1.5 × 10⁻³ | 4.82 × 10⁻² | 1.5 × 10⁻³ |
| KSyn Decay | 7.59 × 10⁻⁵ | 4.5 × 10⁻⁶ | 6.35 × 10⁻⁵ | 5.8 × 10⁻⁶ | 5.85 × 10⁻⁵ | 6.0 × 10⁻⁶ |
| QuantityT = 280 | 49.0 | 66.2 | 8.14 | |||
| Maternal Tissue | Weight,b kg | Energy, Mcal | Protein, kg | |||
| Estimate | SE | Estimate | SE | Estimate | SE | |
| QuantityInitial | 0.204 | |||||
| KSyn, d−1 | 2.42 × 10⁻² | 4.0 × 10⁻⁵ | ||||
| KSyn Decay | 3.53 × 10⁻⁵ | 1.6 × 10⁻⁷ | ||||
| QuantityT = 280 | 11.3 | 15.3c | 1.88c |
- a
Data used for model fitting were those reported by Bell et al. (1995) and House and Bell (1993). The model was fit using the nls function of the lme4 package of R (ver. 3.5.1).
- b
Derived from the regression model of Bell (1995).
- c
Estimated as (uterus + caruncle weights) × fetal energy or protein at Daygest = 280. Gestational length of 280 was chosen based on observed Holstein gestational lengths.
The derived tissue weights at parturition were used to predict gravid uterine weight and growth rates at any point of the gestational period
(Equation 20-227)
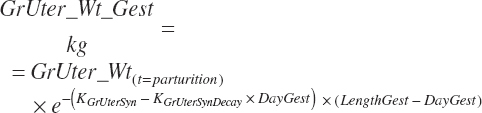
(Equation 20-228)
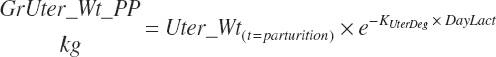
(Equation 20-229)
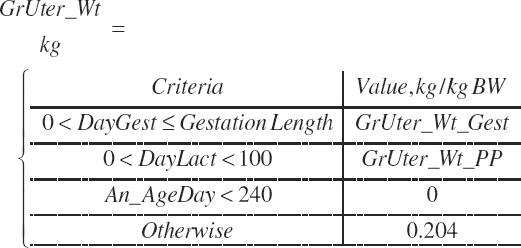
The Ksyn and KsynDecay used in Equations 20-227 and 20-228 are those listed in Table 20-10. Equation 20-228 represents the involution of the uterine tissue after parturition, where KUterDeg is assumed to be 0.2; KUterDeg is not known with certainty, but a value of 0.2 results in essentially complete involution by day 21 of lactation and resulted in expected blood AA concentrations postcalving (Hanigan et al., 2009). Tissue protein and AA released by such involution are a relatively small contributor to overall AA balance in the postpartum period (202 g NP/d on day 1 postpartum for a 50-kg calf), and thus halving or doubling KUterDeg would marginally change NP contributions from maternal gestational tissue postpartum.
A nonpregnant BW (An_BWNPr, kg) is calculated from the observed BW and the predicted gravid uterine weight:
(Equation 20-230)
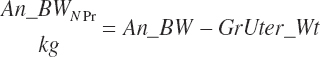
Daily rates of wet tissue deposition (kg/d) are derived from Equations 20-227 and 20-228 as
(Equation 20-231)
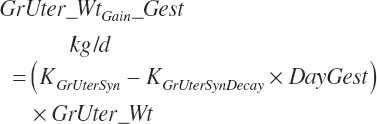
(Equation 20-232)

(Equation 20-233)
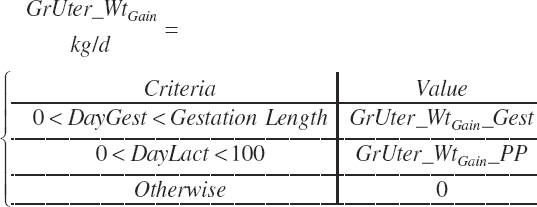
Finally, gestational (gest) requirements for NE (Mcal/d), ME (Mcal/d), and NP (g/d) deposition are calculated from the rate of change in gravid uterine tissue mass using the concentrations of energy (0.950 Mcal/kg) and CP (123 g/kg) in the final gravid uterus at parturition, as listed in Table 20-10, and the fraction of TP in CP (0.86 g/g):
(Equation 20-234)
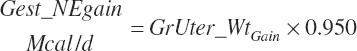
(Equation 20-235)
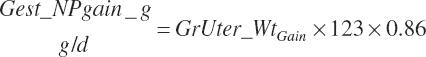
The conversion of ME to NE (KyMe_Ne, Mcal/Mcal) in support of gestation was set at 0.14 when gest_Negain is positive (during gestation), which was derived from Ferrell et al. (1976). Efficiency was set to 0.89 for postpartum uterine regression:
(Equation 20-236)

ME use in support of gestation is subsequently calculated from gest_Ne as
(Equation 20-237)
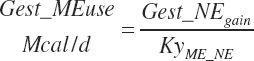
The same criteria and strategy are used for calculation of gest_MPuse required from gest_NP_g, where KyMP_NP is set to 0.33 when gest_NPgain was positive as for NRC (2001) and to 1 when gest_NPgain was negative during postpartum regression.
(Equation 20-238)
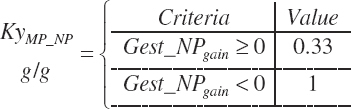
(Equation 20-239)
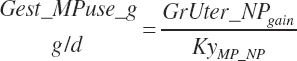
Gestational metabolizable AA requirements (g/d) are calculated based on the AA composition of gravid uterine protein (AA(i)_NPgrUter), which was assumed to be equal to body protein (see Table 6-5):
(Equation 20-240)
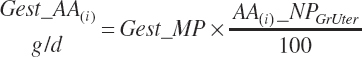
As the NE and NP values are accumulated over the full gestation, the ratios represent the average composition of the tissue over the entire pregnancy. This approach ensures that the accumulated energy and protein in the gravid uterus are reflected at parturition. However, as the composition changes slightly as gestation progresses, there are small errors of prediction of nutrient deposition rates in the middle of the gestational period, but these errors will compensate provided the pregnancy proceeds to full term. This approach will also slightly underestimate energy and protein release from the involuting uterus as the energy and protein composition of the uterus is greater than the gravid uterus. Both of these errors are also quite small and lack biological significance relative to the overall use of energy and AAs in the animal.
Energy and Amino Acid Use for Growth and Body Reserves
Because gut fill, fetal tissue weight, and body composition are determined at slaughter and used to calculate gain of water, ash, fat, and protein, it is useful to predict mass of each of those components, but these relationships are not well defined for all physiological states and thus remain incomplete.
Gut fill as a proportion of BW (gutFill_BW, kg/kg) is determined based on relative BW and dietary intake of starter and milk (Dt_DMInMilk, kg/d) and calf starter (Dt_DMInstarter, kg/d):
(Equation 20-241)
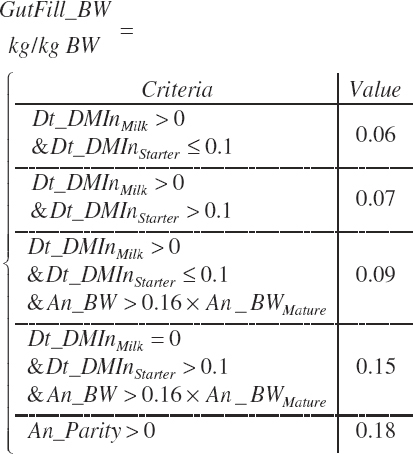
Actual gut fill is calculated from An_BWNPr and subtracted from An_BW and An_BWNPr to determine empty BW (EBW) (An_eBW, kg) for each:
(Equation 20-242)
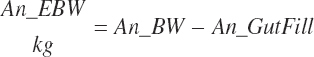
(Equation 20-243)

(Equation 20-244)

EBW is adjusted to a standard BCS of 3.0, assuming the mass of a unit of BCS is a function of the BW of the animal:
(Equation 20-245)
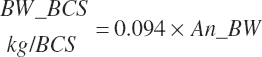
(Equation 20-246)
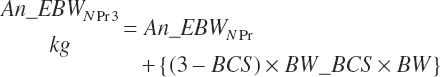
Composition of Gain
The model uses the specified An_BW and target body gain for frame (Frm_GainTarget, kg/d) and reserves (rsrv_GainTarget, kg/d) to calculate body weight gain by summation:
(Equation 20-247)
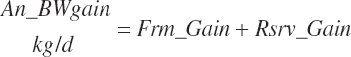
and to predict energy, protein, and AA utilization for gain. The model also calculates energy and MP allowable rates of gain.
To accommodate potential future predictions of Frm_Gain and rsrv_Gain, these inputs were passed to a general variable so that a prediction selection scheme can be used as for milk production.
(Equation 20-248)
(Equation 20-249)
Selectors were included among the model inputs to control such future frame and reserve gain predictions but not implemented in the code. To use the selectors, Equations 20-248 and 20-249 can be replaced with if statements to select among predictions as for milk NP or DMIn code.
Empty frame gain (kg/d) is calculated by subtraction of gut fill, assuming fill is proportional to body and frame weights. Calf empty frame gain was calculated, assuming gut fill was 9 percent of frame gain.
(Equation 20-250)
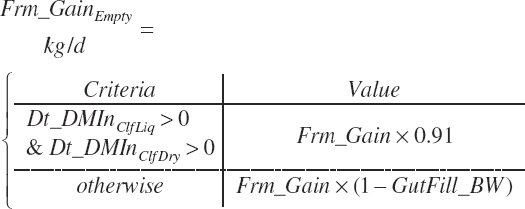
Empty reserves gain was assumed to be equal to reserves gain (i.e., no gut fill changes).
(Equation 20-251)
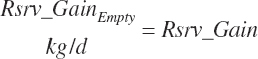
(Equation 20-252)
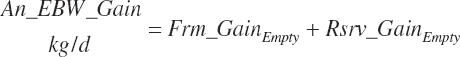
The composition of gain (g of fat or protein/g gain) is specified as
(Equation 20-253)
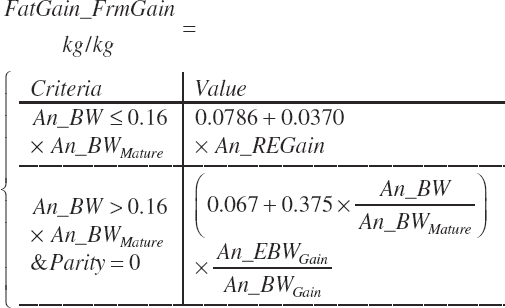
(Equation 20-254)
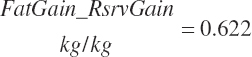
(Equation 20-255)
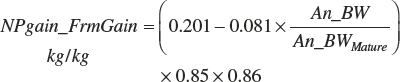
(Equation 20-256)

Fat, NP, water, and ash gains are calculated as
(Equation 20-257)
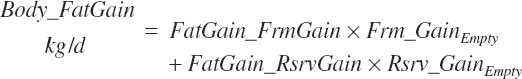
(Equation 20-258)

(Equation 20-259)
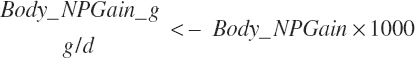
(Equation 20-260)
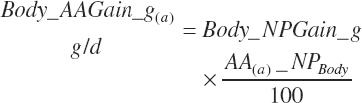
(Equation 20-261)
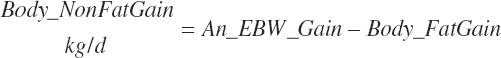
(Equation 20-262)
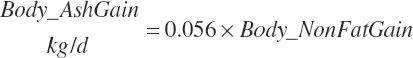
(Equation 20-263)
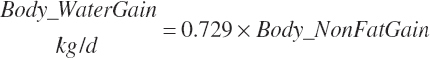
Except for calves, body fat and NP gain are used to estimate retained energy captured in gain (An_REGain, Mcal/d).
(Equation 20-264)
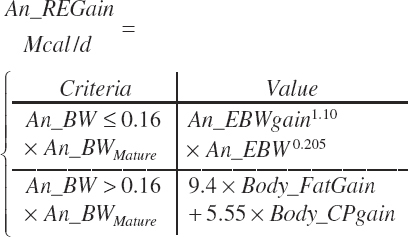
Conversion of An_REGain to An_NELGain factors was
(Equation 20-265)

The conversion of ME to NEL for support of maintenance and lactation (Km_ME_NE and Kl_ME_NE, Mcal/Mcal) were set to 0.66. The efficiency of conversion of ME to RE for frame gain (Kf_ME_RE) was defined as
(Equation 20-266)

The efficiency of conversion of ME to RE in support of reserve gains (Kr_ME_RE) was:
(Equation 20-267)

The overall conversion efficiency for ME to RE is thus the weighted average of Kf_+ME_RE and Kr_ME_RE. ME required for NE gain (An_Megain, Mcal/d) is calculated as
(Equation 20-268)
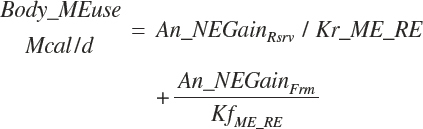
The energy content of BW change (Negain_BWgain, Mcal/kg) is calculated as
(Equation 20-269)
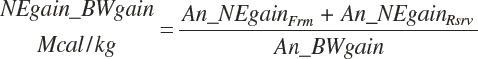
MP required for the gain in NP (Body_MPuse, Mcal/d) is calculated as
(Equation 20-270)
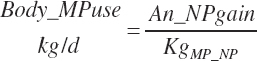
where KgMP_NP (g/g) represents the average observed efficiency of conversion of MP to NP in support of protein gain, which was
(Equation 20-271)

KgMP_NP should not be viewed as the maximal achievable efficiency. The AA composition of MP affects efficiency and that was not considered in model development. Minimum efficiency was set at 0.39.
Energy and Amino Acid Use for Maintenance: Energy
Maintenance costs for animals that are not subjected to environmental stress (An_NEmUseNS, Mcal/d) are calculated from BW and age as
(Equation 20-272)
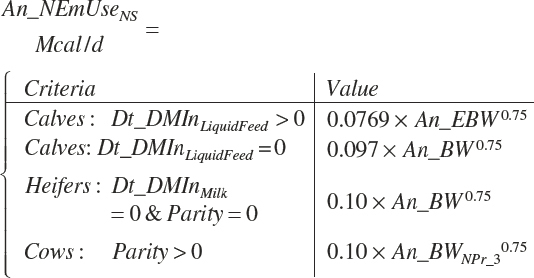
When the mean environmental temperature (T, 0C) is outside of the TNZ (defined by the lower and upper critical temperatures, Equation 20-2 and Equation 20-3), additional maintenance costs occur. These are calculated as
(Equation 20-273)
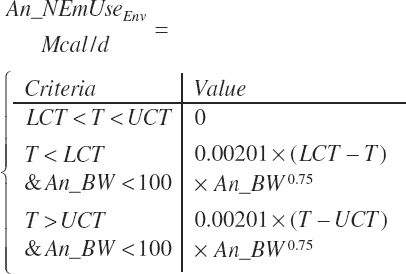
Some locomotion costs are intrinsic to the above maintenance requirements. For cows, maintenance costs were largely derived from metabolic chamber work, and thus that cost includes the energy associated with standing, eating and drinking, and moving from standing to recumbency and the reverse. In many cases, the cows may have also been in early gestation, resulting in some gestational cost being included in maintenance. Calf and heifer values have more typically been derived from comparative slaughter techniques, with animals moving from stalls to feed and water, and thus reflective of a confinement system. Energy required for activity above those levels should be included as additional maintenance costs. Ignoring the costs of locomotion in a confinement operation perhaps slightly underestimates maintenance when pens are located a long distance from the parlor, but the error is likely very small. It is more important to consider activity in pasture conditions where the distance walked and the topography can result in significant increases in energy expenditures.
The cost of locomotion for grazing activity (An_Nem Usegraze, Mcal/d) is detected and calculated based on the inclusion of feeds categorized as pasture in the ration:
(Equation 20-274)

where Dt_PastIn and Dt_PastSupplIn are the consumption of pasture and nonpasture DM (kg/d). This cost is for flat topography (i.e., no hills).
Additional locomotion costs (An_NemUseParlor, Mcal/d) are calculated from the round-trip distance from the barn or paddock to the parlor (env_DistParlor, m), the number of milkings, and animal size. As for grazing activity, this cost is estimated for a flat surface.
(Equation 20-275)

The cost associated with elevation change while grazing and in transit to and from milking is calculated from the daily total climb while grazing and during transit between the milking parlor and the barn or paddock (env_TopParlor, m) and animal size. Climb only considers the meters of uphill climb (i.e., the fall is not subtracted as the latter has little locomotion cost).
(Equation 20-276)
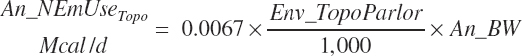
Distance walked during the entire day could also be estimated from step activity recorded by activity monitors. Estimates for meters of climb (without consideration of fall) based on loose categories for topography are as follows:
| Hilliness | Vertical Distance Climbed |
| Mild | 50 m/d |
| Moderate | 200 m/d |
| Severe | 500 m/d |
Climb could also be estimated from distance traveled and satellite imaging data if one assumes random movement in the pasture and channeled movement to and from the milking parlor, or it could be calculated directly from animal movements using the global positioning system.
Total activity costs are derived by summation:
(Equation 20-277)

and the adjusted NEm is
(Equation 20-278)
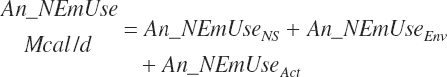
ME requirements for maintenance (An_Mem, Mcal/d) are calculated from An_Nem using a conversion efficiency (Km, Mcal/Mcal) as
(Equation 20-279)
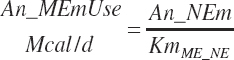
The efficiency used varies by animal state, with calves consuming only liquid being
(Equation 20-280)
and calves consuming only dry feed as
(Equation 20-281)
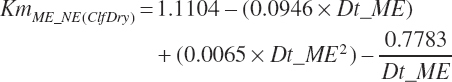
These two partial efficiencies were weighted by the amount of liquid and dry feed consumed to yield the overall maintenance efficiency for calves. Heifers and cows used constant efficiencies regardless of diet type:
(Equation 20-282)

Protein
Net CP and TP depositions in scurf (scrf_CP_g and scrf_NP_g, g/d respectively) are defined as
(Equation 20-283)
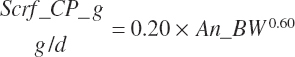
(Equation 20-284)

(Equation 20-285)
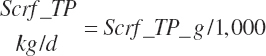
and the losses of individual AA in scurf TP as a function of the concentration of each AA in scurf protein (AA(i)_NPscrf; see Table 6-5) as
(Equation 20-286)

Urinary endogenous N losses (Ur_Nend, g/d) include contributions from urea, 3-methyl-histidine (3MH), endogenous purine derivatives (PDs), creatinine (Creatn), creatine (Creat), and hippuric acid:
(Equation 20-287)

(Equation 20-288)
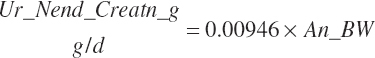
(Equation 20-289)

(Equation 20-290)
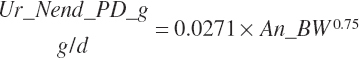
(Equation 20-291)

(Equation 20-292)
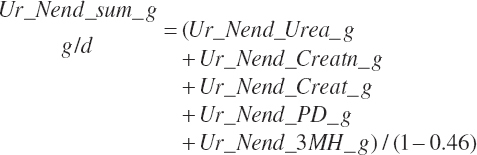
(Equation 20-293)
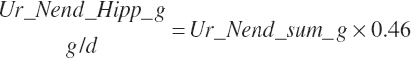
The urinary endogenous N losses are also approximated by summation of the above as
(Equation 20-294)
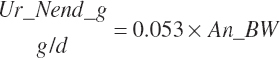
the latter being used for downstream calculations. Net endogenous TP loss in urine is assumed to be 16 percent N, and all of Ur_Nend is assumed to have derived from TP/AAs:
(Equation 20-295)
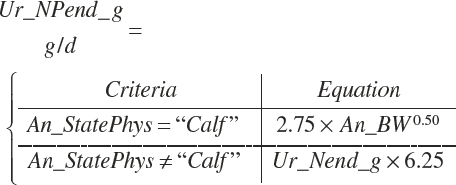
(Equation 20-296)

The fraction of urinary endogenous loss arising only from metabolizable EAA (Ur_eAAend, g/d; i.e., urea and 3-methyl-histidine) is predicted as
(Equation 20-297)
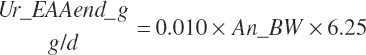
and the loss of individual AA as urinary endogenous TP is a function of the concentration of each AA in body protein (see Table 6-5) plus an adjustment for the loss of 3-meythl-histidine:
(Equation 20-298)
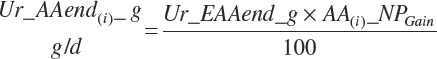
where i represented the individual AA excepting His, which included the contribution of 3-methyl-histidine:
(Equation 20-299)
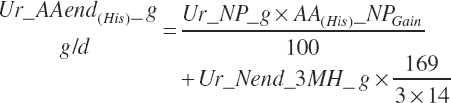
NP loss as fecal endogenous (Fe_Nend, g/d; and Fe_NPend, g/d; also referred to as metabolic fecal) are defined from dietary NDF concentrations and DMIn as
(Equation 20-300)

(Equation 20-301)
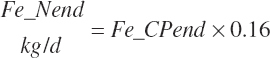
and 73 percent of the Fe_CPend is assumed to be TP:
(Equation 20-302)
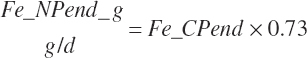
Use of AA for fecal endogenous losses is calculated from the NP flow and the composition of that protein (AA(i)_NPMFP; see Table 6-5):
(Equation 20-303)
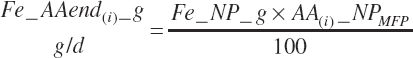
Total net maintenance NP and MP use for export proteins is by summation:
(Equation 20-304)
(Equation 20-305)
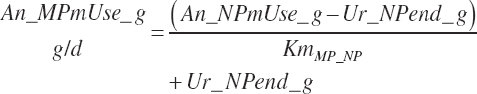
where KmMP_NP represents the target efficiency of conversion of MP to maintenance NP (assumed to be equal to that of export proteins):
(Equation 20-306)
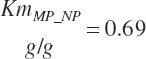
Ur_NPend_g is assumed to be equal to MP use as the AAs representing that cost are transferred directly from blood to urine without a conversion loss.
Metabolizable Energy Supply
Having determined urinary N and gaseous energy losses, ME intake and dietary concentrations can be calculated by difference,
(Equation 20-307)
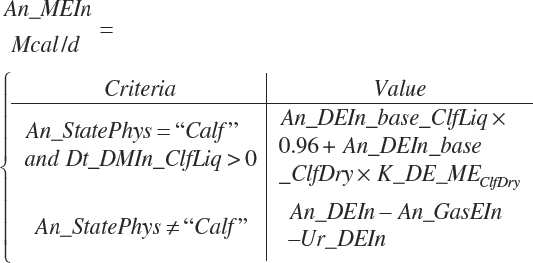
where An_DEIn_base = the DE unadjusted for DMIn and K_DE_MEClfDry is the efficiency of conversion of DE to ME

Urinary N (Ur_N_g, g/d) and energy (Ur_Dein, Mcal/d) losses are defined as
(Equation 20-308)
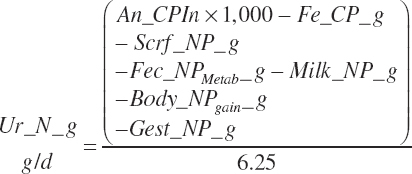
(Equation 20-309)
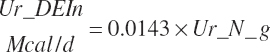
From Equation 20-308, it can be seen that NP use must be calculated before Ur_N_g can be defined. Thus, in the case of the model, the entire ME section must be placed after the sections defining NP use (below). The equations are placed here for organizational reasons.
Gaseous energy (GasE) losses (Mcal/d) are predicted from nutrient intakes and concentrations:
(Equation 20-310)
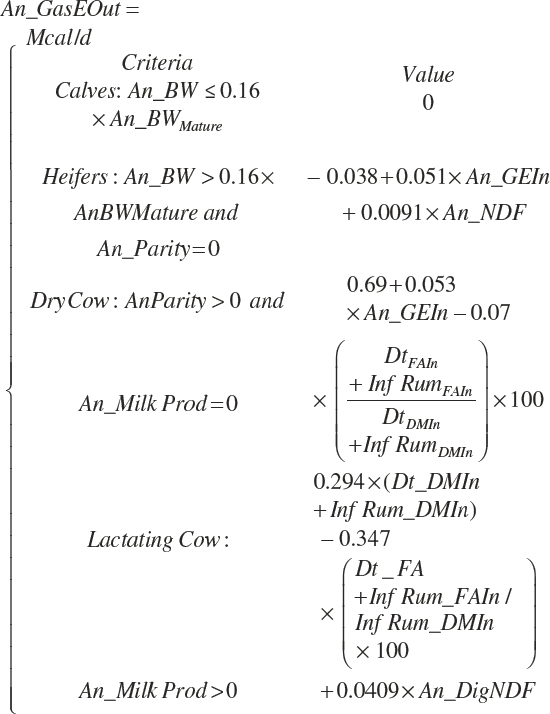
GasE loss was reduced by 5 percent if monensin is included in the diet:
(Equation 20-311)
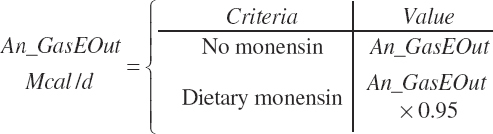
An_gaseout was converted to units of g/d and L/d assuming 55.6 MJ/kg, 4.184 MJ/Mcal, and 1,497 L/kg:
(Equation 20-312)

(Equation 20-313)
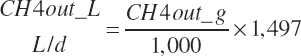
(Equation 20-314)
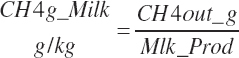
(Equation 20-315)

(Equation 20-316)

(Equation 20-317)

The above equations apply for weaned animals of all ages. Alternative energy supply equations are used for milk-fed calves.
Energy, Protein, and Amino Acid Balance
Total protein exported from the body and body growth (An_NPxprt, g/d) is calculated by summation:
(Equation 20-318)
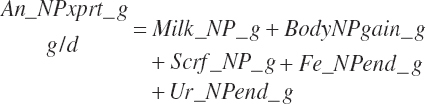
Total NP use for production as
(Equation 20-319)
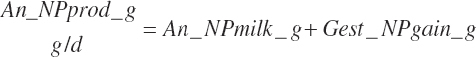
(Equation 20-320)
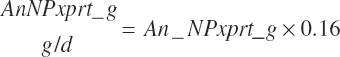
Total AA use as
(Equation 20-321)

And total MP use as
(Equation 20-322)

(Equation 20-323)
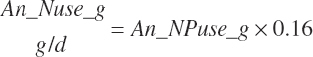
NE and ME available for production (Mcal/d) are calculated as
(Equation 20-324)

(Equation 20-325)
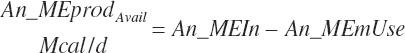
Energy balance (Mcal/d) is calculated as the supply minus all use:
(Equation 20-326)
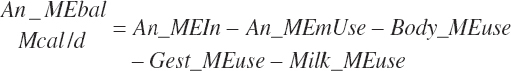
(Equation 20-327)
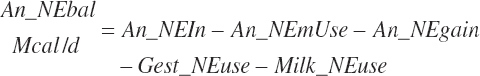
(Equation 20-328)
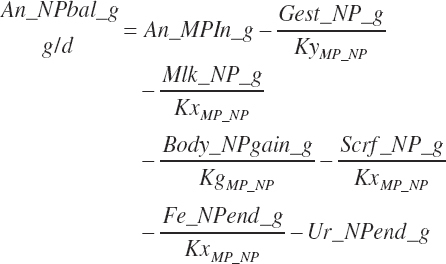
(Equation 20-329)
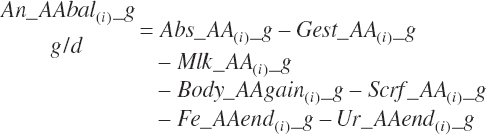
Allowable Production Estimates
Energy and protein available for production can be partitioned to gain, milk, or gestation, although the latter would seem to be largely prescribed within normal ranges and thus was ignored for these scenarios. Based on conservation of mass principles, one can rearrange Equations 20-327 and 20-328 to isolate each productive function and estimate how much production is allowed by the energy and protein supplies given constant rates for the other functions and target efficiencies for MP to NP conversion. Obviously, nutrient availability is not the sole determinant of production, and thus these predictions should be considered guides at best.Response surface-based predictions such as for Mlk_NP and Mlk_Fat are better reflections of expected changes in production and should be used as an expectation guide rather than these historical simplifications.
Based on mass balance, ME available for gain (An_Meavailgain, Mcal/d) is
(Equation 20-330)
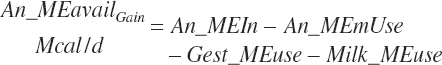
Energy allowable rates of body gain (Body_GainMe_Allow, kg BW/d) with Frm and rsrv gain proportioned to body gain according to Frm and rsrv gain input proportion are calculated as
(Equation 20-331)
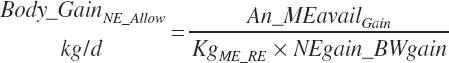
Managing body condition of lactating animals is important to avoid negative impacts on productivity and animal health, and thus it is useful to know how long it would take on a given diet to achieve a 1-unit change in BCS assuming all of the extra energy was channeled into body reserves (An_Bcs_1Δ_d). This is estimated in days, assuming that a 1-unit change is equivalent to 9.8 percent of An_BW:
(Equation 20-332)
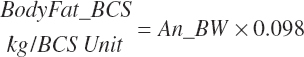
(Equation 20-333)

The rate of MP allowable body gain (Body_GainMP_Allow, kg BW/d) can be estimated from the MP supply (g/d) assuming the composition of the EAA in the MP is appropriately matched to animal needs and that the conversion of MP to NP in support of milk (if the animal is lactating) is at the target efficiency.
(Equation 20-334)
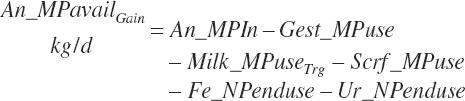
(Equation 20-335)
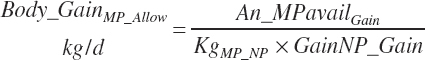
Using the same approach, energy (MilkNe_Allow, kg/d) and NP allowable milk (MilkMP_Allow, kg/d) can be predicted subject to the same assumptions:
(Equation 20-336)
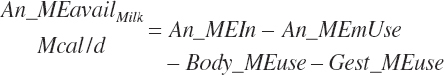
(Equation 20-337)
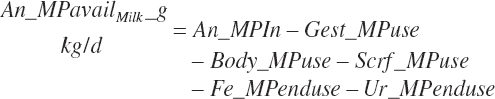
(Equation 20-338)

(Equation 20-339)
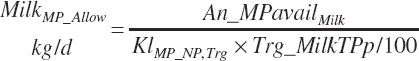
The predicted milk protein content of milk could be used instead of the user-entered target value in Equation 20-339.
Manure
(Equation 20-340)
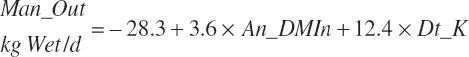
(Equation 20-341)
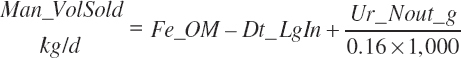
(Equation 20-342)
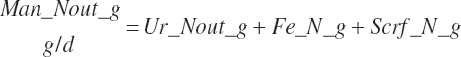
Manure output of the macro-and microminerals with predictions for absorption was calculated by difference from dietary intakes (Dt_XxIn) and retained in product (An_xx_prod):
(Equation 20-343)
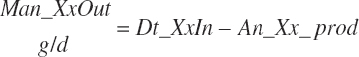
where xx refers to each of the individual minerals. The total manure content of these macro- and microminerals was by summation:
(Equation 20-344)

(Equation 20-345)
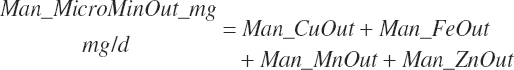
Water, Energy, Protein, and Amino Acid Efficiencies
Water use and fractional efficiencies were calculated as
(Equation 20-346)
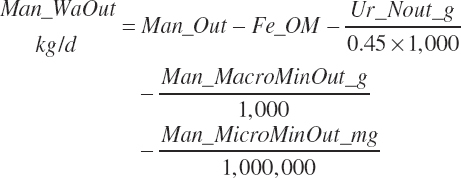
(Equation 20-347)
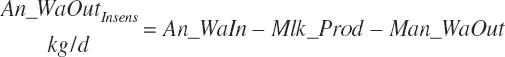
(Equation 20-348)
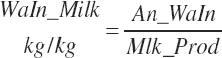
(Equation 20-349)
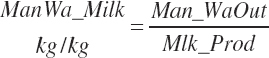
The fractional efficiencies of energy transfers are calculated as
(Equation 20-350)
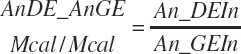
(Equation 20-351)
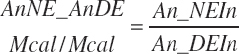
(Equation 20-352)
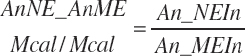
The fractional efficiencies of use of dietary and MP are calculated as
(Equation 20-353)
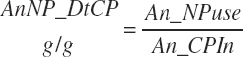
(Equation 20-354)
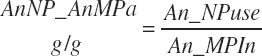
(Equation 20-355)

(Equation 20-356)
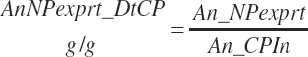
(Equation 20-357)
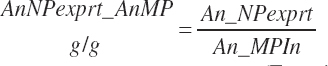
(Equation 20-358)
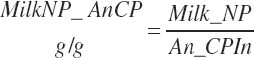
(Equation 20-359)
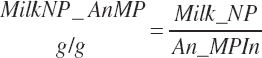
(Equation 20-360)
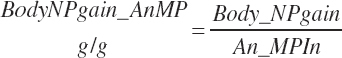
(Equation 20-361)
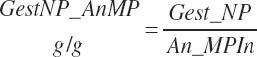
Because the fractional conversion of MP to endogenous urinary NP is assumed to be 1, it is subtracted from An_NP and from An_MPin in Equation 20-355 to reflect its direct conversion. The full use in support of gestation was also considered as the inefficiency of gestation NP deposition occurs primarily outside of the animal. One might argue the use of a similar adjustment for the remaining equations utilizing An_MPin, but such adjustments were not undertaken, and consideration of those values should be adjusted accordingly. The value predicted by Equation 20-355 is used for comparison to the target efficiency in Chapter 6.
The fractional efficiencies of use of dietary and metabolizable AA are calculated as
(Equation 20-362)
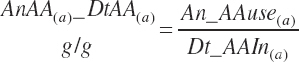
The efficiencies of individual absorbed EAA use for export protein plus retained in body protein are calculated for comparison to the target efficiencies listed in Chapter 6.
(Equation 20-363)

(Equation 20-364)
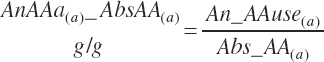
(Equation 20-365)
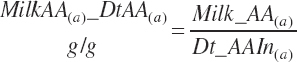
(Equation 20-366)
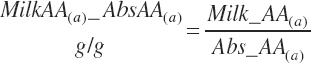
(Equation 20-367)
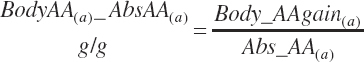
(Equation 20-368)
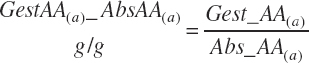
(Equation 20-369)
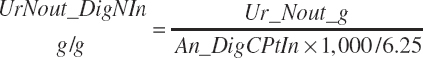
As for MP the fractional efficiency of AA conversion to export and body gain protein was calculated (Equation 20-363) based on the assumption that AAs transferred to endogenous urinary AAs were at an efficiency of 1 and that total gestation use operates at a lower efficiency, and these efficiencies should be compared to the target efficiencies provided in Chapter 6.
A number of additional fractional efficiencies are also calculated for display in reports but not presented here.
Vitamin and Mineral Supply and Use
Absorption coefficients (ACs) have been assessed for the macrominerals and for some of the microminerals. For these, absorbed supplies (Xx_absMinin) of minerals are defined for each ingredient (Fd_absMinin) and summed to yield daily intakes (An_absMinin), which are compared to requirements for absorbed minerals (An_Min_req). For the remainder of the microminerals and for the vitamins, requirements are defined in terms of dietary intakes (xx_VMin). In most cases, requirements are defined factorially for maintenance (An_VM_m), growth (An_VM_gr), lactation (An_VM_l), and gestation (An_VM_y) and summed to yield an overall requirement (An_ VM_req), and the balance (An_VM_bal) of absorbed or dietary and required is calculated. The units for all driving variables and the variable definitions are provided in the prior sections. The vitamin and mineral calculations are grouped by class.
For those minerals based on absorbed supplies (calcium [Ca], phosphorus [P], magnesium [Mg], sodium [Na], potassium [K], chloride Cl−, cobalt [Co], copper [Cu], iron [Fe], manganese [Mn], and zinc [Zn]), the ACs (Fd_acxx, g/g) are specified by feed in the feed library. These are used below as specified except in the case of calves (An_StatePhys = “Calf”), where requirements for some minerals are based on dietary concentrations. In those cases, absorbability was set to a value of 1 to allow use of a common framework across physiological states. This approach should not be construed to imply that absorbability of those minerals by calves is complete. For those based on absorbability, the feed-specific values were generally not used for unweaned calves (An_StatePhys = “Calf” and Dt_ DMin_clfLiq > 0) in lieu of the following dietary mineral absorption coefficients: Ca = 1.0 for liquid feeds and 0.60 for dry feeds, P = 1.0 for liquid feeds and 0.75 for dry feeds, Mg = 1.0 for liquid feeds and 0.26 for dry feeds, K = 1.0, Na = 1.0, Cl = 1 for liquid feeds and 0.92 for dry feeds, Cu = 0.10, Fe = 0.10, Mn = 0.005, and Zn = 0.20.
Macrominerals
Calcium, g/d
Ca supply is predicted as
(Equation 20-370)
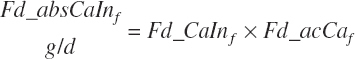
(Equation 20-371)
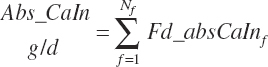
Calcium required by calves consuming liquid feed is calculated as.
(Equation 20-372)
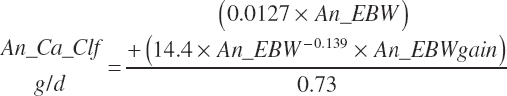
Ca requirements for weaned calves, heifers, and cows are calculated as
(Equation 20-373)

(Equation 20-374)
(Equation 20-375)
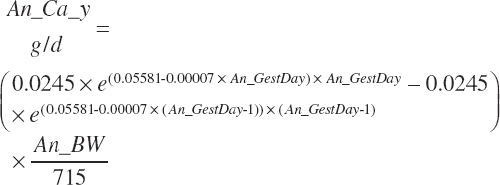
The lactation requirement for absorbed Ca can be predicted from milk volume or from milk protein production.
(Equation 20-376)
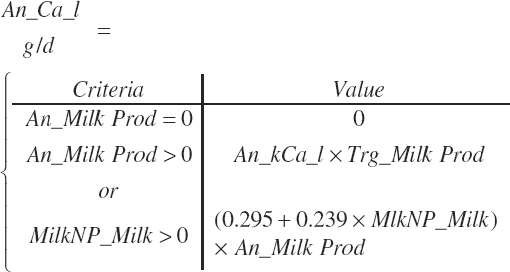
where An_kcal_l (g Ca/L of milk) is defined by breed:
(Equation 20-377)
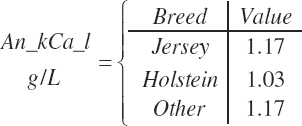
(Equation 20-378)
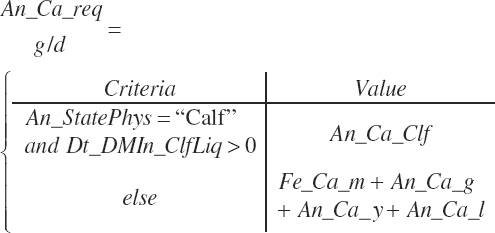
(Equation 20-379)
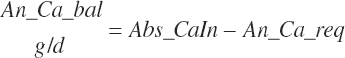
Ca captured in animal product is calculated as
(Equation 20-380)

Phosphorus, g/d
(Equation 20-381)
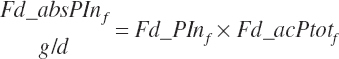
(Equation 20-382)
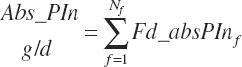
(Equation 20-383)
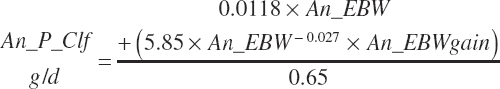
(Equation 20-384)
(Equation 20-385)
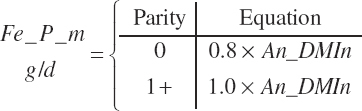
(Equation 20-386)

(Equation 20-387)
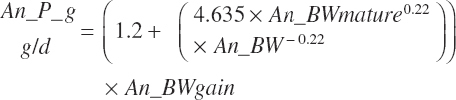
(Equation 20-388)
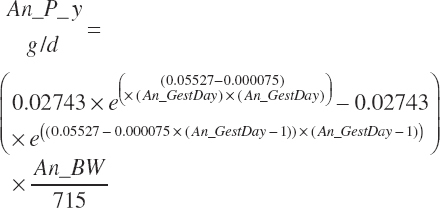
(Equation 20-389)
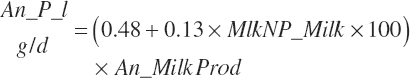
or if milk protein is not known:
(Equation 20-390)

(Equation 20-391)
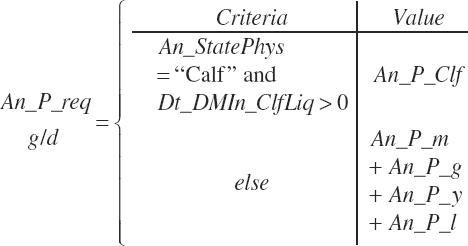
(Equation 20-392)
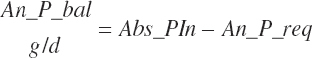
(Equation 20-393)
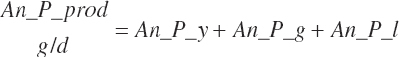
(Equation 20-394)
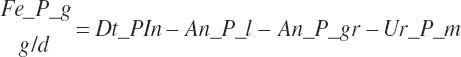
Magnesium, g/d
As discussed in Chapter 7 (Minerals), absorption of magnesium (Mg) from inorganic mineral sources is affected by dietary K content. Thus, Mg provided by ingredients in the vitamin/mineral category was summed and an absorption coefficient for Mg was calculated based on Dt_K:
(Equation 20-395)
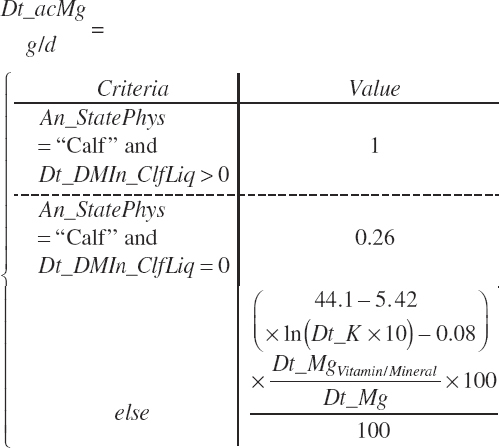
and used to estimate absorbed Mg intake:
(Equation 20-396)
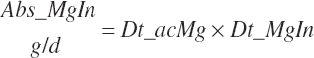
(Equation 20-397)
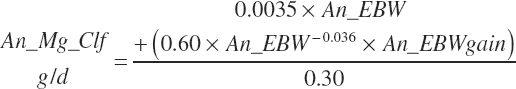
(Equation 20-398)
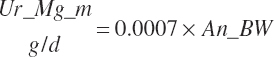
(Equation 20-399)
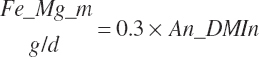
(Equation 20-400)

(Equation 20-401)
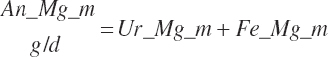
(Equation 20-402)
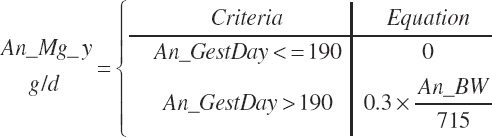
(Equation 20-403)
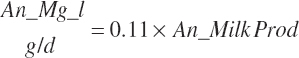
(Equation 20-404)

(Equation 20-405)

(Equation 20-406)

Sodium, g/d
(Equation 20-407)

(Equation 20-408)
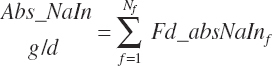
(Equation 20-409)

(Equation 20-410)
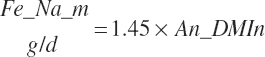
(Equation 20-411)

(Equation 20-412)
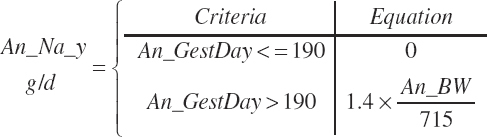
(Equation 20-413)
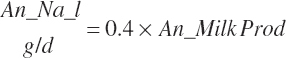
(Equation 20-414)
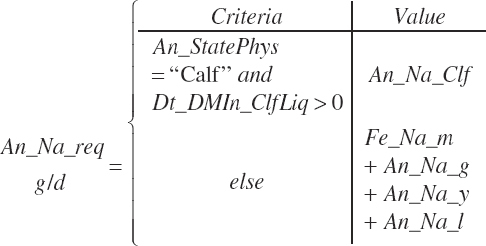
(Equation 20-415)
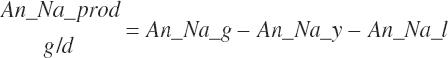
(Equation 20-416)
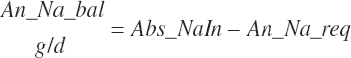
Chloride, g/d
(Equation 20-417)
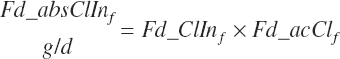
(Equation 20-418)

(Equation 20-419)

(Equation 20-420)
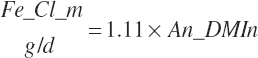
(Equation 20-421)

(Equation 20-422)

(Equation 20-423)
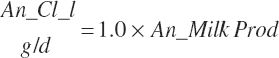
(Equation 20-424)

(Equation 20-425)
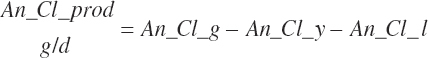
(Equation 20-426)
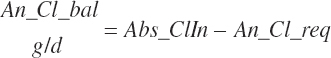
Potassium, g/d
(Equation 20-427)
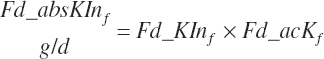
(Equation 20-428)
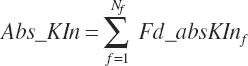
(Equation 20-429)
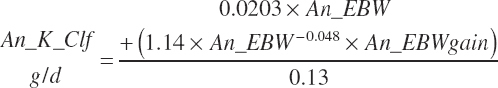
(Equation 20-430)

(Equation 20-431)
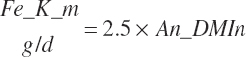
(Equation 20-432)

(Equation 20-433)
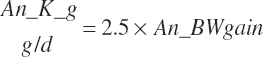
(Equation 20-434)

(Equation 20-435)
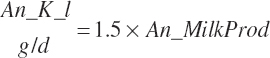
(Equation 20-436)
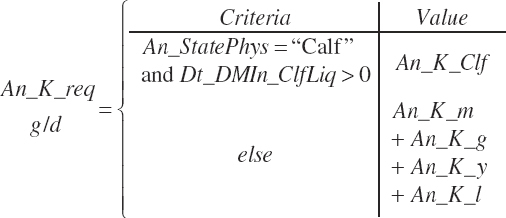
(Equation 20-437)
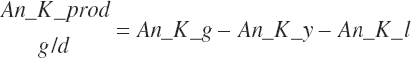
(Equation 20-438)
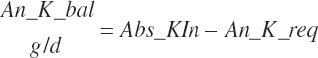
Sulfur, g/d
(Equation 20-439)
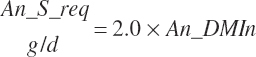
(Equation 20-440)
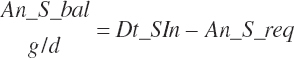
Microminerals
Cobalt, mg/d
(Equation 20-441)
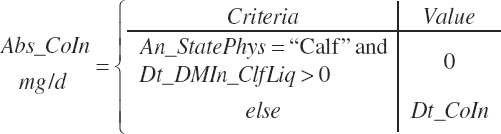
(Equation 20-442)
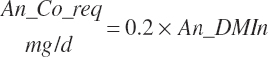
(Equation 20-443)

Copper, mg/d
(Equation 20-444)

(Equation 20-445)
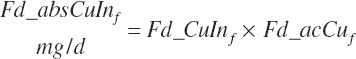
(Equation 20-446)
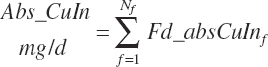
(Equation 20-447)
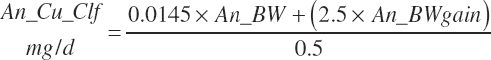
(Equation 20-448)
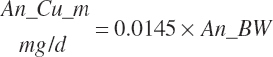
(Equation 20-449)
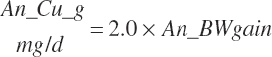
(Equation 20-450)

(Equation 20-451)
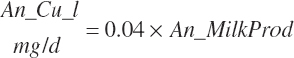
(Equation 20-452)
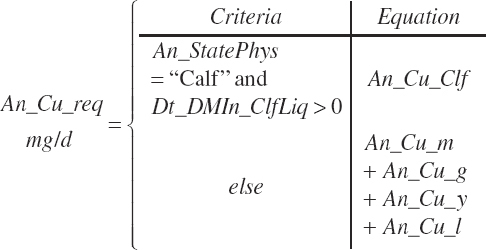
(Equation 20-453)
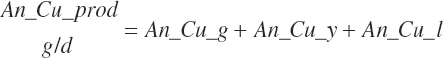
(Equation 20-454)

Iodine, mg/d
(Equation 20-455)
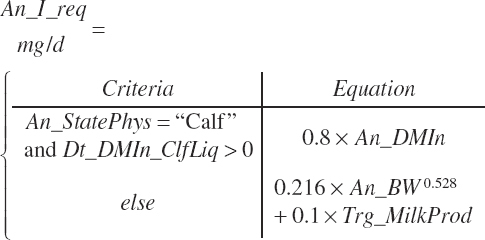
(Equation 20-456)
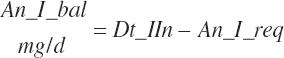
Iron, mg/d
(Equation 20-457)
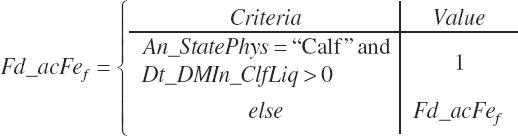
(Equation 20-458)
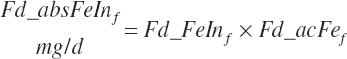
(Equation 20-459)

(Equation 20-460)
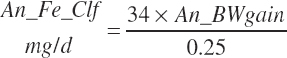
(Equation 20-461)
(Equation 20-462)

(Equation 20-463)
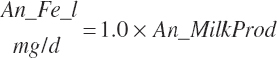
(Equation 20-464)
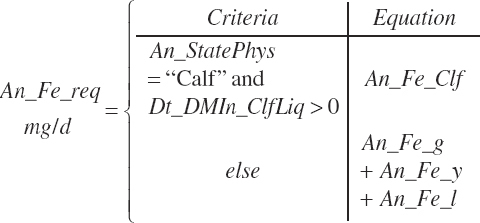
(Equation 20-465)
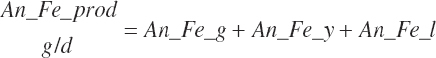
(Equation 20-466)
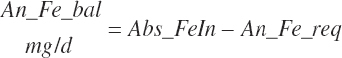
Manganese, mg/d
(Equation 20-467)
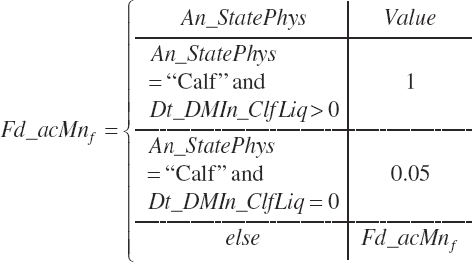
(Equation 20-468)
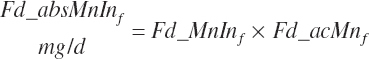
(Equation 20-469)
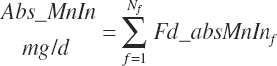
(Equation 20-470)
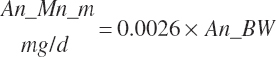
(Equation 20-471)
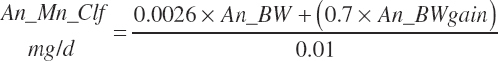
(Equation 20-472)
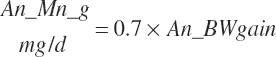
(Equation 20-473)
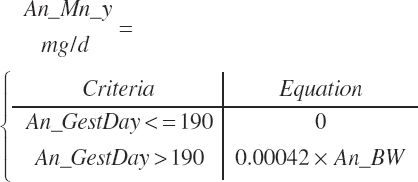
(Equation 20-474)
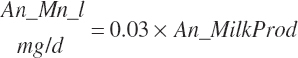
(Equation 20-475)
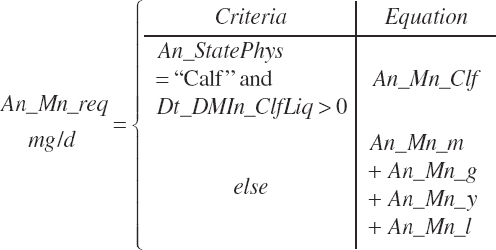
(Equation 20-476)
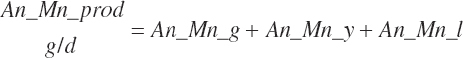
(Equation 20-477)
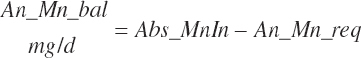
Selenium, mg/d
(Equation 20-478)

(Equation 20-479)
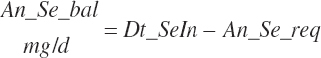
Zinc, mg/d
(Equation 20-480)
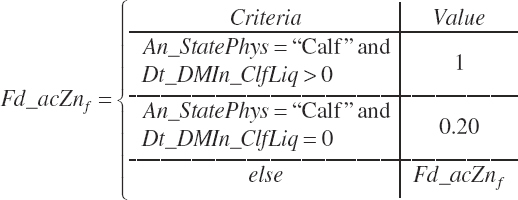
(Equation 20-481)
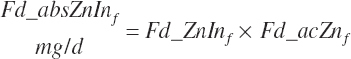
(Equation 20-482)
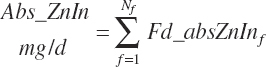
(Equation 20-483)
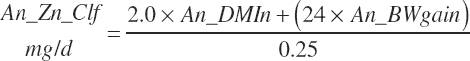
(Equation 20-484)
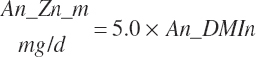
(Equation 20-485)
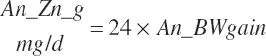
(Equation 20-486)
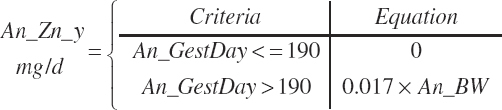
(Equation 20-487)
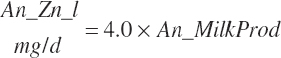
(Equation 20-488)

(Equation 20-489)
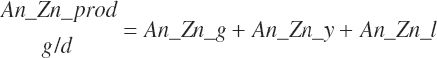
(Equation 20-490)
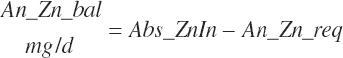
Vitamins
Vitamin A, IU/d
(Equation 20-491)
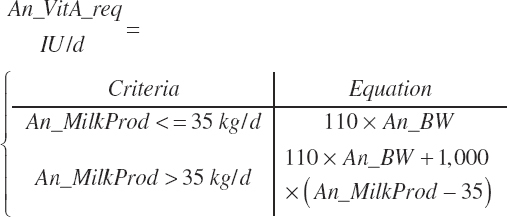
(Equation 20-492)
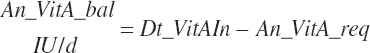
Vitamin D, IU/d
(Equation 20-493)

(Equation 20-494)
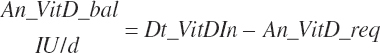
Vitamin E, IU/d
(Equation 20-495)
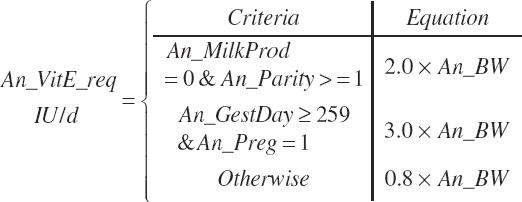
(Equation 20-496)
If animals are grazing, the vitamin E requirement is reduced by 50 IU/kg of pasture DM intake. The contribution is capped at the total vitamin E requirement.
MODEL EVALUATIONS
A large data set was assembled from the literature for use in model fitting primarily for protein and fat digestion and for derivation of milk protein, milk fat, and milk production predictions. Those data were also used for model testing. Thus, evaluations of protein and fat digestion and milk production presented in this chapter are not independent of the derivation data. However, extensive evaluations of those predictions using cross-evaluation techniques were conducted during derivation, which helps ensure the equations will perform equally well with independent data. Predictions of DMIn and carbohydrate digestion were developed from independent data, and thus the evaluations of those predictions presented below are independent of the derivation data.
The evaluations are summarized and presented as root RMSE and its partition into mean and slope bias as described by Bibby and Toutenberg (1977) and the CCC as described by Lin (1989). Unless specified otherwise, evaluations were not adjusted for random study effects.
Fitting and Evaluation Data
The protein and fat digestion data encompassed 1,149 treatment means from 275 publications. The primary selection criteria for data gathering were (1) ruminal outflow, (2) total tract FA digestibility, (3) infusions of AAs or proteins, (4) rumen-protected AA feeding trials, and (5) mammary arteriovenous difference studies. The data are primarily from mature, lactating animals (N = 1,023), but some observations were collected from dry cows and young growing animals, although the minimum animal size was 319 kg of BW. A summary of the animal characteristics for the data is provided in Table 20-11, and a summary of the diets is provided in Table 20-12. The resulting predictions of digestibility and absorption are provided in Table 20-12.
Dry Matter Intake and Ruminal Outflow
Residual analyses for predictions of lactating cow DMIn and ruminal outflow of N, starch, and NDF are presented in Table 20-13. DMI of lactating cows based on animal factors only was predicted with a small mean bias and moderate slope bias, whereas the prediction based on animal and feed factors had a larger mean bias but no slope bias. However, the former had greater precision with an RMSE of 12.4 percent and a CCC of 0.70 versus 17.3 and 0.56, respectively, for the latter equation, indicating that the feed factors are introducing more variation than explaining.
TABLE 20-11A Summary of the Animal Characteristics for the Evaluation Data Used
| BW, kg | DMIn, kg/d | Milk, kg/d | Lactose, % | Protein, % | Fat, % | Days in Milk | Parity | |
| N | 932 | 1,149 | 1,023 | 421 | 934 | 926 | 1,023 | 1,149 |
| Mean | 602 | 20.0 | 29.9 | 4.65 | 3.05 | 3.52 | 134 | 0.95 |
| Median | 600 | 20.2 | 30.2 | 4.78 | 3.1 | 3.57 | 138 | 1 |
| SD | 58.2 | 4.18 | 8.57 | 0.78 | 0.46 | 0.68 | 51.8 | 0.22 |
| Minimum | 319 | 5.81 | 0 | 0 | 0 | 0 | 0 | 0 |
| Maximum | 788 | 31.8 | 53.8 | 5.34 | 3.9 | 5.62 | 344 | 1 |
| 1. Quartile | 571 | 17.5 | 24.6 | 4.66 | 2.94 | 3.24 | 106 | 1 |
| 3. Quartile | 636 | 22.9 | 36.3 | 4.86 | 3.23 | 3.8675 | 153 | 1 |
| Skewness | −0.30 | −0.33 | −0.57 | −5.54 | −4.92 | −2.22 | 0.39 | −4.14 |
| Kurtosis | 2.05 | 0.41 | 1.14 | 30.2 | 30.6 | 10.5 | 1.24 | 15.2 |
TABLE 20-12A Summary of the Dietary Characteristics for the Evaluation Dataa
| Variable | Mean | Median | SD | Min | Max | 1. Quart | 3. Quart | Skewness | Kurtosis |
|---|---|---|---|---|---|---|---|---|---|
| Dt_DMIn, kg/d | 20.0 | 20.2 | 4.2 | 5.8 | 31.8 | 17.5 | 22.9 | −0.33 | 0.41 |
| Dt_ForWet | 40.3 | 44.8 | 21.4 | 0.0 | 100.0 | 30.0 | 55.0 | −0.51 | −0.14 |
| Dt_ForDry | 11.3 | 0.0 | 16.8 | 0.0 | 99.7 | 0.0 | 17.5 | 1.77 | 3.02 |
| Dt_Conc | 48.4 | 50.0 | 12.5 | 0.0 | 100.0 | 40.0 | 55.4 | −0.41 | 1.93 |
| Dt_Ash | 7.55 | 7.40 | 1.97 | 4.00 | 22.47 | 6.31 | 8.40 | 2.93 | 17.73 |
| Dt_NDF | 32.7 | 31.9 | 6.1 | 14.6 | 54.3 | 28.4 | 35.9 | 0.65 | 0.62 |
| Dt_ForNDF_NDF, % of NDF | 74.0 | 76.6 | 12.9 | 0.0 | 100.0 | 66.2 | 83.0 | −0.83 | 1.10 |
| Dt_ADF | 20.0 | 19.3 | 4.2 | 7.2 | 39.0 | 17.2 | 22.0 | 0.91 | 1.64 |
| Dt_Lg | 3.65 | 3.45 | 0.96 | 1.57 | 7.65 | 2.94 | 4.22 | 0.84 | 0.59 |
| Dt_St | 26.7 | 27.3 | 8.5 | 1.1 | 53.0 | 21.4 | 32.6 | −0.41 | 0.40 |
| Dt_rOM | 13.6 | 13.5 | 5.2 | −5.8 | 42.4 | 10.7 | 16.5 | 0.28 | 2.41 |
| Dt_CP | 16.5 | 16.6 | 2.5 | 7.7 | 26.2 | 15.1 | 18.0 | −0.08 | 1.27 |
| Dt_TP | 16.1 | 16.3 | 2.7 | 7.7 | 26.2 | 14.6 | 17.8 | −0.14 | 0.64 |
| Dt_NPNCP | 0.37 | 0.00 | 0.91 | 0.00 | 7.10 | 0.00 | 0.00 | 3.78 | 17.81 |
| Dt_NPN | 0.06 | 0.00 | 0.15 | 0.00 | 1.14 | 0.00 | 0.00 | 3.78 | 17.81 |
| Dt_CPA_CP, % of CP | 37.0 | 35.5 | 8.3 | 18.2 | 81.8 | 31.2 | 41.4 | 1.12 | 2.34 |
| Dt_CPB_CP, % of CP | 53.9 | 54.5 | 9.0 | 13.0 | 74.0 | 49.2 | 59.8 | −0.68 | 0.89 |
| Dt_CPC_CP, % of CP | 8.88 | 8.49 | 2.77 | 3.63 | 29.85 | 7.00 | 10.50 | 1.34 | 4.96 |
| Dt_FA | 3.39 | 2.85 | 1.53 | 0.77 | 15.22 | 2.30 | 4.36 | 1.64 | 5.80 |
| Dt_C12 | 0.052 | 0.038 | 0.051 | 0.003 | 1.004 | 0.015 | 0.075 | 6.45 | 105.43 |
| Dt_C14 | 0.041 | 0.034 | 0.035 | 0.005 | 0.413 | 0.015 | 0.052 | 2.71 | 14.52 |
| Dt_C16 | 0.666 | 0.456 | 0.450 | 0.118 | 3.574 | 0.385 | 0.815 | 2.24 | 6.48 |
| Dt_C161 | 0.034 | 0.018 | 0.041 | 0.005 | 0.527 | 0.013 | 0.033 | 3.77 | 24.37 |
| Dt_C180 | 0.157 | 0.074 | 0.208 | 0.010 | 2.420 | 0.057 | 0.156 | 4.11 | 27.00 |
| Dt_C181t | 0.023 | 0.006 | 0.044 | 0.000 | 0.540 | 0.003 | 0.019 | 4.29 | 29.34 |
| Dt_C181c | 0.758 | 0.547 | 0.593 | 0.020 | 7.546 | 0.402 | 1.005 | 3.04 | 20.89 |
| Dt_C182 | 1.235 | 1.165 | 0.534 | 0.129 | 4.573 | 0.884 | 1.449 | 1.21 | 2.56 |
| Dt_C183 | 0.333 | 0.300 | 0.185 | 0.056 | 2.273 | 0.211 | 0.415 | 3.65 | 28.20 |
| Dt_OtherFA | 0.113 | 0.077 | 0.110 | 0.027 | 1.333 | 0.063 | 0.127 | 6.04 | 55.25 |
| Dt_ArgIn, g/d | 164 | 159 | 59 | 30 | 338 | 124 | 202 | 0.33 | −0.20 |
| Dt_HisIn, g/d | 80 | 80 | 26 | 21 | 183 | 61 | 98 | 0.19 | −0.07 |
| Dt IleIn, g/d | 139 | 139 | 43 | 34 | 269 | 107 | 168 | 0.17 | −0.24 |
| _ Dt LeuIn, g/d | 274 | 277 | 89 | 73 | 621 | 213 | 331 | 0.35 | 0.51 |
| _ Dt LysIn, g/d | 153 | 152 | 54 | 29 | 298 | 113 | 193 | 0.12 | −0.56 |
| Dt_MetIn, g/d | 54 | 54 | 17 | 14 | 114 | 41 | 64 | 0.35 | 0.23 |
| Dt_PheIn, g/d | 160 | 161 | 49 | 38 | 311 | 121 | 193 | 0.18 | −0.01 |
| Dt_ThrIn, g/d | 129 | 129 | 39 | 33 | 251 | 99 | 155 | 0.10 | −0.23 |
| Dt_TrpIn, g/d | 40 | 40 | 13 | 9 | 87 | 30 | 48 | 0.31 | 0.38 |
| Dt_ValIn, g/d | 173 | 176 | 51 | 43 | 344 | 133 | 208 | 0.16 | 0.00 |
- a
Values are expressed as a percentage of DM unless specified otherwise. The variables are those specified for the model. N = 1,149.
TABLE 20-13Residual Analyses for Predictions of DMI of Lactating Animals and Ruminal Outflow of Nitrogen (N), Starch, and NDFa
| Variable Equation | DMIn Equation 20-21 | DMIn Equation 20-22 | Du_MicN Equation 20-74 | Du_NANMN Equation 20-83 | Du_NAN Equation 20-82 | Du_St Equation 20-57 | Du_NDF Equation 20-56 |
|---|---|---|---|---|---|---|---|
| Units | kg/d | kg/d | g/d | g/d | g/d | kg/d | kg/d |
| N | 951 | 951 | 596 | 587 | 585 | 178 | 319 |
| Observed mean | 20.6 | 20.6 | 278 | 205 | 487 | 2.66 | 3.76 |
| Predicted mean | 20.8 | 22.3 | 269 | 203 | 474 | 2.31 | 3.98 |
| CCC | 0.71 | 0.54 | 0.51 | 0.56 | 0.74 | 0.54 | 0.43 |
| RMSE | 2.50 | 3.29 | 81 | 68 | 88 | 1.18 | 1.03 |
| RMSE, % mean | 12.1 | 15.9 | 29.2 | 33.1 | 18.0 | 44.3 | 27.3 |
| Mean bias, % MSE | 0.4 | 26.8 | 1.2 | 0.1 | 2.0 | 8.8 | 4.7 |
| Slope bias, % MSE | 9.0 | 3.2 | 2.1 | 2.1 | 1.6 | 0.1 | 0.0 |
| Mean bias | −0.2 | −1.7 | 8.9 | 2.2 | 12.3 | 0.3 | −0.2 |
| Slope bias | 0.31 | 0.26 | 0.22 | −0.17 | 0.11 | 0.05 | −0.01 |
| P, mean bias | 0.06 | 0.00 | 0.01 | 0.44 | 0.00 | 0.00 | 0.00 |
| P, slope bias | 0.0001 | 0.0001 | 0.0003 | 0.0004 | 0.002 | 0.61 | 0.88 |
- a
Errors of prediction for ruminal outflow of AA are presented in Table 20-14. The CCC for these ranged from 0.43 to 0.59 with very minimal or no slope bias and small proportions of mean bias.
TABLE 20-14Residual Analyses for Predictions of Ruminal Outflow of AAs (g/d) by Equation 20-87
| Variable | Arg | His | Ile | Leu | Lys | Met | Phe | Thr | Val |
|---|---|---|---|---|---|---|---|---|---|
| N | 216 | 221 | 221 | 221 | 223 | 220 | 221 | 221 | 221 |
| Observed mean | 119 | 57.4 | 122 | 225 | 158 | 48.6 | 130 | 124 | 138 |
| Predicted mean | 130 | 60.7 | 135 | 229 | 184 | 54.5 | 141 | 132 | 150 |
| CCC | 0.54 | 0.51 | 0.49 | 0.60 | 0.45 | 0.43 | 0.57 | 0.58 | 0.52 |
| RMSE | 32.8 | 18.1 | 36.2 | 62.5 | 56.6 | 17.4 | 34.8 | 31.1 | 40.3 |
| RMSE, % mean | 27.7 | 31.5 | 29.8 | 27.7 | 35.9 | 35.7 | 26.7 | 25.1 | 29.1 |
| Mean bias, % MSE | 11.9 | 3.3 | 13.9 | 0.4 | 21.8 | 11.5 | 10.3 | 7.1 | 8.6 |
| Slope bias, % MSE | 0.2 | 2.2 | 0.1 | 0.1 | 0.0 | 0.0 | 0.0 | 0.8 | 0.0 |
| Mean bias | −11.3 | −3.3 | −13.5 | −4.0 | −26.5 | −5.9 | −11.2 | −8.3 | −11.8 |
| Slope bias | −0.06 | −0.18 | −0.05 | 0.04 | −0.02 | −0.01 | 0.01 | 0.11 | 0.02 |
| P, mean bias | 0.00 | 0.01 | 0.00 | 0.34 | 0.00 | 0.00 | 0.00 | 0.00 | 0.00 |
| P, slope bias | 0.45 | 0.03 | 0.60 | 0.60 | 0.83 | 0.95 | 0.92 | 0.16 | 0.81 |
TABLE 20-15Residual Analyses for Predictions of Fecal Nutrient Output (kg/d)
| Variable Equation | Fe_CP Equation 20-138 | Fe_NDF Equation 20-120 | Fe_St Equation 20-98 | Fe_FA Equation 20-162 | Fe_OM Equation 20-166 |
|---|---|---|---|---|---|
| N | 458 | 412 | 203 | 121 | 448 |
| Observed mean | 1.08 | 3.24 | 0.451 | 0.340 | 5.58 |
| Predicted mean | 0.89 | 3.20 | 0.666 | 0.312 | 5.00 |
| CCC | 0.53 | 0.77 | 0.27 | 0.80 | 0.71 |
| RMSE | 0.29 | 0.56 | 0.45 | 0.093 | 1.04 |
| RMSE, % mean | 26.8 | 17.4 | 99.8 | 27.4 | 18.7 |
| Mean bias, % MSE | 40.9 | 0.3 | 22.8 | 9.0 | 30.9 |
| Slope bias, % MSE | 9.8 | 0.2 | 22.2 | 4.4 | 0.1 |
| Mean bias | 0.2 | 0.0 | −0.2 | 0.0 | 0.6 |
| Slope bias | 0.51 | 0.03 | −0.65 | 0.16 | 0.02 |
| P, mean bias | 0.00 | 0.26 | 0.00 | 0.00 | 0.00 |
| P, slope bias | 0.0001 | 0.41 | 0.0001 | 0.02 | 0.49 |
Predictions of ruminal outflow of N had CCC from 0.5 to 0.75 with minimal mean bias but significant slope bias as may be expected given that they were fitted to the same data used to derive them. Predictions of ruminal outflow of st and NDF had a CCC of 0.54 and 0.41, respectively, with st flow underpredicted (excessive ruminal degradation) and NDF flow overpredicted (inadequate ruminal degradation). These latter two are independent evaluations as the source equations were developed from other data.
Fecal Output
Errors of prediction for fecal nutrient excretion are summarized in Table 20-15. The CCC for predictions of fecal CP, NDF, and FA ranged from 0.49 to 0.81. There was positive mean and slope bias for fecal CP predictions with output underpredicted by 0.20 kg/d on average and the underprediction becoming greater (positive slope on the residuals) as predicted output increased. This is consistent with an overestimate of the digestibility of RUP or microbial CP, which results in a larger absolute error as flow through the system increases. Thus, it seems that one or both of the intestinal protein digestibility estimates are too great. However, predictions of fecal CP also require predictions of endogenous protein flows, including incorporation of blood urea into microbial protein in the large intestine. Endogenous flows may not be well captured by the predictions, and thus it is unclear if the problem is solely due to intestinal digestibility. Fecal NDF was predicted without mean or slope bias and a CCC of 0.77 and an RMSE of 17.7 percent.
Fecal starch predictions had a CCC of 0.19. The lower predictability for this variable at least in part reflects the high extent of digestion of the nutrient. The model is attempting to predict relatively small fractional outputs from large inputs, and the variance in estimates will be large relative to the output and thus low apparent predictability of the output itself. However, the negative mean bias and negative slope bias suggest the opposite of that observed for fecal CP (i.e., the intestinal digestibility is too low and should be increased). The needed increase should be even greater than indicated by these evaluations if one considers that starch outflow from the rumen was underpredicted in the model.
TABLE 20-16Residual Analyses for Predictions of Milk and Milk Component Production
| Variable Equation | Protein Equation 20-185 | Fat Equation 20-215 | Milk Equation 20-216 | MilkME_Allow Equation 20-338 | MilkMP_Allow Equation 20-339 |
|---|---|---|---|---|---|
| Units | g/d | g/d | kg/d | kg/d | kg/d |
| N | 935 | 935 | 935 | 935 | 935 |
| Observed mean | 929 | 1,098 | 30.9 | 30.9 | 30.9 |
| Predicted mean | 930 | 1,114 | 31.0 | 34.7 | 32.6 |
| CCC | 0.75 | 0.62 | 0.75 | 0.67 | 0.64 |
| RMSE | 133 | 188 | 4.50 | 7.50 | 6.80 |
| RMSE, % mean | 14.4 | 17.1 | 14.6 | 24.4 | 22.1 |
| Mean bias, % MSE | 0.0 | 0.7 | 0.1 | 24.5 | 5.9 |
| Slope bias, % MSE | 3.1 | 0.0 | 3.3 | 37.9 | 28.6 |
| Mean bias | −1.1 | −16.0 | −0.1 | −3.7 | −1.7 |
| Slope bias | 0.16 | 0.02 | 0.16 | −0.45 | −0.43 |
| P, mean bias | 0.54 | 0.01 | 0.38 | 0.00 | 0.00 |
| P, slope bias | 0.0001 | 0.51 | 0.0001 | 0.0001 | 0.0001 |
Because of lack of data when nutrients are summed to determine fecal rOM, only 14 observations were available in the literature, and no meaningful estimate of variance is possible. Fecal FAs were predicted with good accuracy and precision with a CCC of 0.81 and an RMSE of 26.6 percent. There was significant mean and slope bias, with the slope bias having a greater effect. The slope bias was positive, indicating that digestibility is slightly overpredicted.
The overall quality of the predictions is reflected in the CCC of 0.82 for OM output and the lack of slope bias for that variable. There was mean bias of 0.58 kg/d, indicating OM excretion is underpredicted on average. As the two major mean biases were contributed by protein and starch with opposing and nearly equal errors, it is unclear what the source of this error is. The RMSE is relatively modest at 18.6 percent, indicating, as does the CCC, that the predictions track with observed data fairly well despite the mean bias. Although there may be a mean bias in the predictions of energy supply to the animal associated with the overprediction of OM digestibility, the bias should remain constant and the relative differences among diets well captured.
Milk and Milk Component Production
A summary of the accuracy and precision of predictions of milk, milk protein, and milk fat production is provided in Table 20-16. Milk production is predicted empirically from predicted protein and fat production and has a CCC of 0.75 with an RMSE of 14.6 percent with minor mean and slope bias. These are all large improvements over the ME and MP allowable milk productions using the scheme of NRC (2001). In particular, the slope bias for the NRC (2001) approach is very severe, as has been identified previously. Although these predictions are provided by the model and the software, users are strongly encouraged not to make use of those predictions as they clearly are very biased. Milk protein and fat production were not previously predicted, and thus the new predictions are a substantial step forward with a CCC of 0.75 and 0.62 and an RMSE of 14.4 and 17.1 percent, respectively. However, it is important to note that all of these predictions were derived from the evaluations, and thus additional independent evaluations are required. In addition, the upper range in milk and milk component yields does not extend to the levels achieved by high-producing herds today; thus, in many situations, results are extrapolated beyond the range of the data.
MODEL VARIANCE RELATIVE TO ANIMAL PERFORMANCE AND DIET SPECIFICATIONS
A number of factors contribute to the precision or imprecision of model predictions relative to animal performance on a specified diet. These factors include errors of measurement of inputs and outputs, biological variation among animals and groups of animals, and variation in environmental stress. Because these factors also contribute to variation in the data used to define and parameterize the model, predictions by the model are subject to uncertainty. Knowing the contribution of each of the major components to system uncertainty allows one to estimate the uncertainty in each part given the other system components. Such knowledge can be used to determine when diet reformulation is required and whether animal performance has deviated significantly from the expected production. Although assessing the variation in each part of the system would require a major effort, it is possible to estimate the likely minimum variance in each from the variance measured with best practices and the designed precision of the measurement systems.
The sources of variation that affect the predictions can be divided into eight general categories reflecting the different components of the feeding and animal system. These sources are associated with (1) assessments of the nutrient composition of ingredients used to construct the diet, (2) assessments of the amount of each ingredient in the diet, (3) assessments of the amount of diet consumed, (4) assessments of the size of the animal, (5) assessments of animal performance, (6) genetic and epigenetic variation in the animals, (7) environmental effects, and (8) the model. The sum of this variation contributes to deviations in animal behavior relative to model predictions on farm and in the laboratory, and the first seven elements contribute to model uncertainty in terms of structure and parameter estimates (St-Pierre, 2016). The first five sources of variation can be assessed and used to explore their impact on model performance. The last three sources are much more difficult to assess individually, but they can be assessed in aggregate by difference from the overall observed variance given knowledge of the variance in the first five elements. This is the approach that was taken by the committee using the literature data summarized in Chapter 6.
TABLE 20-17Standard Deviation for Analyses of Repeated Samplings of Feed Grains and By-Products Reported by St-Pierre and Weiss (2015)
| Nutrient | Whole Cottonseed | Dry Corn | High-Moisture Corn | Dried Distillers Grains | Soybean Meal | Wet Brewers Grains | Concentratea |
|---|---|---|---|---|---|---|---|
| DM | 2.11 | 1.96 | 6.14 | 1.9 | 0.81 | 1.98 | 1.38 |
| Ash | 0.55 | 0.58 | 0.33 | 0.91 | 0.56 | 0.58 | 0.57 |
| CP | 1.68 | 0.54 | 0.73 | 3.57 | 1.41 | 4.09 | 0.975 |
| Starch | 1.49 | 0.49 | 0.99 | ||||
| NDF | 4.14 | 2 | 5.36 | 2.56 | 1.67 | 3.98 | 1.835 |
| Lignin | 4.73 | 3.69 | 4.21 | ||||
| Ca | 0.091 | 0.026 | 0.034 | 0.043 | 0.096 | 0.112 | 0.061 |
| K | 0.092 | 0.055 | 0.057 | 0.285 | 0.18 | 0.049 | 0.118 |
| Mg | 0.046 | 0.018 | 0.015 | 0.09 | 0.033 | 0.031 | 0.026 |
| Na | 0.015 | 0.015 | 0.081 | 0.053 | 0.023 | 0.034 | |
| P | 0.085 | 0.038 | 0.036 | 0.147 | 0.051 | 0.088 | 0.045 |
| Cu | 3.69 | 2.22 | 1.33 | 2.2 | 2.71 | 4.89 | 2.465 |
| Fe | 38.2 | 29.16 | 39.92 | 23.2 | 41.7 | 67.1 | 35.43 |
| Mn | 9.8 | 4.39 | 3.07 | 7.25 | 6.01 | 15.3 | 5.2 |
| Zn | 10.8 | 8.45 | 5.84 | 18.4 | 6.07 | 22.3 |
- a
An average of corn and soybean meal.
Variation associated with measurement of nutrient composition of the source ingredients and the impact of that variance on animal performance have been explored (St-Pierre and Weiss, 2015). In that work, the authors assessed the variance of analyses of multiple samples over a 12-month period and over multiple farms of six grain and by-product ingredients. A summary of that information is provided in Table 20-17. Those standard deviations include farm-to-farm variance, month-to-month variance, and sampling and analytical variance.
Users need to be aware of the variation associated with both sampling and analyses when formulating and evaluating diets. The feed composition tables (see Chapter 19) include standard deviations, but that variance includes more sources than sampling and analytical. It is important to stress the need for representative sampling on farm or in the research laboratory. A biased sample will always result in biased nutrient composition no matter how precise the assay method.
Variation in measurements of ingredient inclusion in the diet and the amount of the diet consumed by animals is subject to the precision of the weight-recording devices used, the accuracy of the operator in loading ingredients and diet delivery, and the estimates of the DM content of the ingredients. These would be impossible to know retrospectively for each of the publications reported in the literature, but they can be assessed on farm, and loading and delivery variance should be assessed and monitored. The precision of estimates of milk production and composition is similarly subject to the precision of the measuring and analytical equipment with the assumption the overall mean is not biased.
Biological variation derives from genetic diversity among animals, which may be categorized and assessed by animal function. There is diversity among animals in DMIn, ruminal fermentation, intestinal nutrient digestibility, efficiency of transfer from absorbed nutrients to product, and nutrient excretion. Variation in the environmental conditions under which animals are housed also contributes by altering DMIn and the efficiency of animal function.
Because the model structure and parameter estimates described herein were derived as a number of discrete components, and because the uncertainty of predicted values relative to observed values reflects the combination of measurement error, biological variation, and model uncertainty, it is not possible to directly estimate model uncertainty. However, one can derive animal plus model variation by difference from total variation if the other sources of uncertainty are identified and subtracted. While the resulting estimate is a combination of biological variation, environmental effects, and model uncertainty, it remains useful as it reflects the uncertainty of predictions applied across groups of animals and thus the expected variation in overall model predictions when applied to random groups of animals.
Using the variance estimates from Table 20-17 and Table 20-18 and those listed above to introduce normally distributed, random error, a population of 200 observations was generated for each diet in the literature data summarized in Table 20-11. The source population was reduced to those observations reporting milk, milk protein, and milk fat, yielding 935 treatment means and 187,000 observations when replicated with input and milk measurement variance. A summary of the variance in milk output is provided in Table 20-19.
TABLE 20-18Standard Deviations for Analyses of Duplicate Samplings of a Feed Conducted by a Commercial Feed Analysis Laboratory in the United Statesa
| Units | TMR | Corn Silage | Grasses | Legumes | Mixed Forages | Small Grains Forage | Sorghum Sudan | |
|---|---|---|---|---|---|---|---|---|
| N | 34 | 1264 | 121 | 1043 | 515 | 284 | 62 | |
| DM (manual) | % AF | 1.11 | 3.96 | 4.31 | 5.21 | 1.90 | 1.09 | 1.41 |
| DM (NIR) | % AF | 0.68 | 0.31 | 0.47 | 0.34 | 0.31 | 0.57 | 0.90 |
| Ash | % DM | 0.07 | 0.17 | 0.28 | 1.10 | 0.41 | 0.79 | 0.87 |
| CP | % DM | 0.32 | 0.37 | 0.74 | 1.45 | 0.84 | 0.11 | 0.12 |
| Total amino acids | % DM | 0.54 | 0.70 | 1.16 | 0.48 | 0.16 | 0.16 | |
| Starch | % DM | 2.14 | 6.16 | 0.15 | 3.03 | 1.21 | 0.95 | 1.66 |
| Ethanol Sol. CHO | % DM | 0.17 | 0.12 | 0.53 | 0.28 | 0.31 | 0.50 | 0.23 |
| Water Sol. CHO | % DM | 0.20 | 0.13 | |||||
| NDF | % DM | 2.14 | 3.31 | 1.90 | 4.94 | 4.25 | 0.91 | 0.55 |
| NDF (ash free) | % DM | 2.06 | 3.15 | 1.82 | 4.59 | 4.57 | 1.05 | 0.85 |
| ADF | % DM | 1.33 | 1.81 | 0.24 | 1.65 | 0.83 | 0.82 | 0.33 |
| Lignin | % DM | 0.071 | 0.066 | 0.071 | 0.096 | 0.128 | 0.094 | 0.026 |
| dNDFr30 | % DM | 0.96 | 1.25 | 0.48 | 1.46 | 3.75 | 0.90 | 0.54 |
| dNDFr48 | % DM | 1.24 | 1.44 | 1.72 | 1.35 | 1.32 | 0.89 | |
| dNDFr120 | % DM | 0.30 | 1.27 | 1.03 | 1.67 | 1.46 | 1.37 | 0.76 |
| dNDFr240 | % DM | 0.66 | 1.05 | 0.75 | 1.64 | 1.60 | 1.29 | 0.62 |
| Crude fat | % DM | 0.052 | 0.028 | 0.012 | 0.020 | 0.015 | 0.006 | 0.004 |
| Total fatty acids | % DM | 0.032 | 0.015 | 0.007 | 0.007 | 0.004 | 0.007 | 0.003 |
| Linoleic | % TFA | 0.60 | 4.20 | 1.01 | 5.73 | 4.45 | 0.86 | 1.09 |
| Linolenic | % TFA | 1.10 | 4.98 | 1.18 | 9.92 | 10.27 | 2.34 | 2.77 |
| Myristic | % TFA | 0.006 | 0.010 | 0.005 | 0.019 | 0.013 | 0.003 | 0.003 |
| Oleic | % TFA | 0.40 | 1.51 | 0.35 | 2.54 | 2.28 | 0.23 | 0.29 |
| Palmitic | % TFA | 0.51 | 0.50 | 0.63 | 1.60 | 1.11 | 0.37 | 0.48 |
| Stearic | % TFA | 0.006 | 0.010 | 0.030 | 0.026 | 0.024 | 0.033 | 0.015 |
| Ca | % DM | 0.0002 | 0.0071 | 0.0073 | 0.0061 | 0.0023 | 0.0014 | |
| K | % DM | 0.0046 | 0.0201 | 0.0258 | 0.0264 | 0.0238 | 0.0307 | |
| Mg | % DM | 0.00009 | 0.00025 | 0.00042 | 0.00025 | 0.00018 | 0.00036 | |
| P | % DM | 0.00005 | 0.00011 | 0.00012 | 0.00016 | 0.00009 | 0.00008 | |
| S | % DM | 0.000018 | 0.000088 | 0.000169 | 0.000083 | 0.000025 | 0.000021 |
- a
Kindly provided by Rock River Laboratories, Inc. Data represent analyses of random duplicate samplings of a single ingredient by each technician each day from March 2018 through October 2019.
Predictions of variation in diet specifications to achieve a given level of production were determined using the same data with the variance associated with measurements of milk production and composition removed, and the variance due to model structure plus animal and environmental variation added. In this manner, the simulated data represented the expected production from each diet as specified with model plus animal and environmental variation. Because a range of diets can result in the same level of production due to the additive nature of the key driving nutrients contributing to milk production, the data were filtered to select observations within each source diet that were plus or minus 1 standard error (SE) from the mean for milk, milk protein, or milk fat production. Variance was calculated for a full range of model factors using the selected observations from each source diet, and the resulting population standard deviation (SD) was reduced to a mean SD across the source diets. This ensured that dietary differences among diets did not influence the variance estimates, yielding a pure estimate of the expected variance for each model input given a diet and a level of milk production. The process was repeated for animal group sizes of 1, 4, 8, 16, 32, 64, 128, and 256 animals. A group size of 1 represents the individual animal, 4 was used for the majority of the studies in the evaluation data, 8 and 16 reflect the range of group sizes typically used for production trials, and the remaining group size encompasses the typical range in group sizes on farm. These estimates are provided in Table 20-20.
Although variance introduced into model inputs to generate the estimates in Table 20-20 was randomly and independently distributed, the model creates covariance in the responses, and thus the estimates are overspecified to varying degrees. For example, milk fat predictions use total FA, C16:0, C18:3, absorbed Ile, and absorbed Met as drivers of output. Thus, a reduction in one of these inputs could be offset by an increase in one of the others. Therefore, one must also consider the correlations and covariance among outputs and the driving factors. Partial correlations between milk production and the primary driving nutrients for production were calculated and are presented in Table 20-21.
TABLE 20-19Variance Estimates for Observed Milk Production and Predicted Milk Production with Input and Milk Measurement Variance
| Milk | Milk Protein | Milk Protein | Milk Fat | Milk Fat | |
|---|---|---|---|---|---|
| Observed | kg/d | g/d | % | g/d | % |
| Mean | 31.0 | 935 | 3.03 | 1,100 | 3.59 |
| Variance | 53.7 | 46,936 | 0.046 | 65,058 | 0.27 |
| SD | 7.33 | 217 | 0.21 | 255 | 0.52 |
| Predicted | |||||
| Mean | 30.29 | 907 | 2.98 | 1,100 | 3.65 |
| Variance | 27.7 | 31,532 | 0.034 | 37,374 | 0.20 |
| SD | 5.27 | 178 | 0.19 | 193 | 0.45 |
| Model + animal + environmenta | |||||
| Mean | 0.75 | 28.2 | 0.044 | 0.58 | −0.066 |
| Variance | 25.9 | 15,404 | 0.012 | 27,684 | 0.072 |
| SD | 5.09 | 124 | 0.11 | 166 | 0.27 |
- a
Model plus animal plus environmental variation was derived by difference.
TABLE 20-20Model Input Variance for a Specified Level of Productiona
| Group Size | Milk | ||||||||
|---|---|---|---|---|---|---|---|---|---|
| Dt_DMIn | Dt_NDF | Dt_DEIn | Dt_St | Dt_CP | Dt_CPA | Dt_CPB | Dt_CPC | Dt_FA | |
| kg/d | % DM | ||||||||
| 1 | 0.18 | 9.27 | 3.92 | 12.99 | 3.83 | 1.33 | 2.92 | 0.41 | 1.25 |
| 4 | 0.18 | 9.19 | 3.84 | 12.83 | 3.81 | 1.32 | 2.92 | 0.40 | 1.24 |
| 8 | 0.18 | 8.91 | 3.75 | 12.40 | 3.71 | 1.29 | 2.84 | 0.39 | 1.19 |
| 16 | 0.17 | 8.48 | 3.63 | 11.84 | 3.59 | 1.25 | 2.75 | 0.38 | 1.16 |
| 32 | 0.17 | 8.20 | 3.57 | 11.54 | 3.57 | 1.24 | 2.75 | 0.37 | 1.13 |
| 64 | 0.16 | 8.27 | 3.42 | 11.45 | 3.51 | 1.22 | 2.72 | 0.38 | 1.12 |
| 128 | 0.16 | 7.43 | 3.30 | 9.75 | 3.10 | 1.07 | 2.44 | 0.32 | 1.02 |
| 256 | 0.15 | 7.07 | 3.37 | 9.09 | 3.00 | 1.03 | 2.37 | 0.32 | 1.06 |
| Milk Protein | |||||||||
| Dt_DMIn | Dt_NDF | Dt_DEIn | Abs_His | Abs_Ile | Abs_Leu | Abs_Lys | Abs_Met | Abs_Thr | |
| kg/d | % DM | Mcal/d | g/d | ||||||
| 1 | 0.19 | 9.10 | 3.78 | 10.35 | 21.37 | 33.24 | 29.55 | 8.97 | 18.65 |
| 4 | 0.18 | 9.05 | 3.76 | 10.37 | 21.29 | 33.21 | 29.45 | 8.93 | 18.58 |
| 8 | 0.18 | 8.82 | 3.64 | 10.31 | 21.11 | 32.75 | 29.19 | 8.74 | 18.41 |
| 16 | 0.18 | 8.68 | 3.55 | 9.93 | 20.77 | 31.88 | 28.57 | 7.97 | 18.03 |
| 32 | 0.17 | 8.22 | 3.44 | 9.46 | 20.04 | 30.37 | 27.27 | 7.56 | 17.33 |
| 64 | 0.17 | 8.12 | 3.26 | 9.13 | 19.22 | 29.29 | 26.38 | 7.18 | 16.73 |
| 128 | 0.16 | 7.91 | 3.19 | 8.87 | 19.00 | 28.56 | 25.60 | 7.09 | 16.31 |
| 256 | 0.15 | 7.46 | 3.18 | 8.52 | 17.94 | 26.58 | 24.18 | 6.56 | 15.30 |
| Milk Fat | |||||||||
| Dt_DMIn | Dt_NDF | Dt_FA | Dt_C16 | Dt_C18.0 | Dt_C18.1t | Dt_C18.1c | Dt_C18.2 | Dt_C18.3 | |
| kg/d | % DM | ||||||||
| 1 | 0.18 | 9.28 | 1.26 | 0.306 | 0.107 | 0.022 | 0.45 | 0.47 | 0.16 |
| 4 | 0.18 | 9.19 | 1.26 | 0.306 | 0.107 | 0.022 | 0.45 | 0.47 | 0.16 |
| 8 | 0.18 | 9.13 | 1.26 | 0.306 | 0.106 | 0.021 | 0.45 | 0.47 | 0.16 |
| 16 | 0.18 | 8.89 | 1.20 | 0.290 | 0.100 | 0.020 | 0.43 | 0.45 | 0.15 |
| 32 | 0.17 | 8.67 | 1.17 | 0.282 | 0.098 | 0.019 | 0.41 | 0.44 | 0.15 |
| 64 | 0.17 | 8.36 | 1.10 | 0.264 | 0.095 | 0.018 | 0.39 | 0.42 | 0.14 |
| 128 | 0.16 | 8.06 | 1.09 | 0.254 | 0.094 | 0.018 | 0.39 | 0.41 | 0.14 |
| 256 | 0.15 | 7.96 | 1.11 | 0.275 | 0.106 | 0.019 | 0.39 | 0.40 | 0.13 |
- a
Variance was estimated for each diet and averaged across diets for varying group sizes.
TABLE 20-21Partial Correlations Between Milk Production and Selected Nutrient Inputsa
| Milk | Milk Protein | Milk Fat | |
|---|---|---|---|
| An_DEIn | 0.22 | 0.18 | 0.26 |
| Dt_NDFIn | 0.34 | 0.49 | 0.18 |
| Dt_LgIn | 0.06 | 0.04 | 0.17 |
| Dt_StIn | 0.31 | 0.47 | 0.13 |
| Dt_rOMIn | 0.21 | 0.41 | 0.04 |
| Dt_CPAIn | −0.03 | 0.01 | −0.02 |
| Abs_His_g | −0.01 | 0.03 | 0.02 |
| Abs_Ile_g | 0.02 | 0.05 | 0.01 |
| Abs_Leu_g | −0.03 | −0.05 | −0.05 |
| Abs_Lys_g | 0.13 | 0.09 | −0.01 |
| Abs_Met_g | 0.16 | 0.18 | 0.25 |
| Abs_Thr_g | −0.01 | 0.03 | 0.03 |
| Dt_FAIn | 0.03 | 0.15 | −0.03 |
| Dt_C16In | 0.09 | 0.03 | 0.10 |
| Dt_C18.3In | 0.08 | −0.01 | 0.18 |
- a
Values were calculated from simulation data that were ±1 SE (group size = 256) from the mean predicted values for each of milk, milk protein, and milk fat.
MODEL APPLICATION IN R
The model described above is coded in R as a function that can be applied to a table of data using the mapply or lapply functions of R, or if the data set is large, the mcmapply or parLapply functions can be used to process individual observations in parallel. Model output from the function is gathered into a list of matrices or dataframes that are returned to the R working environment. The lists can be consolidated into a set of dataframes or matrices and merged with the observed data to evaluate model performance.
The model code and scripts to run the five observations are provided at the National Academies Press website (see https://www.nap.edu/catalog/25806), and in the C:\NASEM\ NASEM-Dairy-8\script folder after installation of the software.
REFERENCES
- Bell AW. Regulation of organic nutrient metabolism during transition from late pregnancy to early lactation. J. Anim. sci. 1995;73:2804–2819. [PubMed: 8582872]
- Bell AW, Slepetis R, Ehrhardt RA. Growth and accretion of energy and protein in the gravid uterus during late pregnancy in Holstein cows. J. Dairy sci. 1995;78(9):1954–1961. [PubMed: 8550905]
- Bibby J, Toutenberg H. Prediction and improved estimation in Linear Models. Chichester, UK: Wiley; 1977.
- Derrig RG, Clark JH, Davis CL. Effect of abomasal infusion of sodium caseinate on milk yield, nitrogen utilization and amino acid nutrition of the dairy cow. J. Nutr. 1974;104(2):151–159. [PubMed: 4810975]
- Ferrell CL, Garrett WN, Hinman N, Grichting G. Energy utilization by pregnant and non-pregnant heifers. J. Anim. sci. 1976;42(4):937–950. [PubMed: 1262293]
- Hanigan M, Cant J, Weakley D, Beckett J. An evaluation of postabsorptive protein and amino acid metabolism in the lactating dairy cow. J. Dairy sci. 1998;81(12):3385–3401. [PubMed: 9891282]
- Hanigan MD, Palliser CC, Gregorini P. Altering the representation of hormones and adding consideration of gestational metabolism in a metabolic cow model reduced prediction errors. J. Dairy sci. 2009;92(10):5043–5056. [PubMed: 19762823]
- Hayirli A, Grummer RR, Nordheim EV, Crump PM. Models for predicting dry matter intake of Holsteins during the prefresh transition period. J. Dairy sci. 2003;86(5):1771–1779. [PubMed: 12778587]
- House WA, Bell AW. Mineral accretion in the fetus and adnexa during late gestation in Holstein cows. J. Dairy sci. 1993;76(10):2999–3010. [PubMed: 8227626]
- Koong LJ, Garrett WN, Rattray PV. A description of the dynamics of fetal growth in sheep. J. Anim. sci. 1975;41(4):1065–1068. [PubMed: 1176362]
- Li MM, Titgemeyer EC, Hanigan MD. A revised representation of urea and ammonia nitrogen recycling and use in the molly cow model. J. Dairy sci. 2019;102(6):5109–5129. [PubMed: 30904308]
- Lin LI. A concordance correlation coefficient to evaluate reproducibility. Biometrics. 1989;45(1):255–268. [PubMed: 2720055]
- NRC (National Research Council). Nutrient requirements of Dairy cattle. 7th rev. Washington, DC: National Academy Press; 2001.
- Orskov ER. Protein Nutrition in ruminants. 2nd ed. New York: Academic Press; 1992.
- Spires HR, Clark JH, Derrig RG, Davis CL. Milk production and nitrogen utilization in response to postruminal infusion of sodium caseinate in lactating cows. J. Nutr. 1975;105:1111–1121. [PubMed: 1171939]
- St-Pierre NR. Comparison of model predictions with measurements: A novel model-assessment method. J. Dairy sci. 2016;99(6):4907–4927. [PubMed: 27040786]
- St-Pierre NR, Weiss WP. Partitioning variation in nutrient composition data of common feeds and mixed diets on commercial dairy farms. J. Dairy sci. 2015;98(7):5004–5015. [PubMed: 25981080]
- Storry JE, Brumby PE, Hall AJ, Johnson VW. Response of the lactating cow to different methods of incorporating casein and coconut oil in the diet. J. Dairy sci. 1974;57(1):61–67. [PubMed: 4810486]
- Tedeschi LO, Fox DG. Ann Arbor, MI: XanEdu; The ruminant Nutrition system: Tables of equations and coding. 2020;II
- Tyrrell HF, Reid JT. Prediction of the energy value of cow's milk. J. Dairy sci. 1965;48:1215–1223. [PubMed: 5843077]
Footnotes
- 1
In other chapters of this report this is written as ROM, which also denotes residual organic matter.
- PubMedLinks to PubMed
- Model Description and Evaluation - Nutrient Requirements of Dairy CattleModel Description and Evaluation - Nutrient Requirements of Dairy Cattle
Your browsing activity is empty.
Activity recording is turned off.
See more...