

NCBI Bookshelf. A service of the National Library of Medicine, National Institutes of Health.
Probe Reports from the NIH Molecular Libraries Program [Internet]. Bethesda (MD): National Center for Biotechnology Information (US); 2010-.

It is now clear that the mitochondrial permeability transition pore (mtPTP) plays a key role in a wide variety of human diseases whose common pathology is based in mitochondrial dysfunction. Despite the facts that robust assays for the activity of the mtPTP have been established and small molecules are of obvious therapeutic importance, the identification of small molecules specifically targeting the mtPTP has not advanced. Using resources within the NIH Molecular Libraries Probe Production Centers Network (MLPCN), a number of novel small molecules that serve as inhibitors of mtPTP activation were identified and optimized. One of these compounds, the probe compound ML404 (CID 72199308) inhibits mitochondrial swelling with an EC50 = 4.9 nM, while it perturbs mitochondrial coupling (an undesired effect) at > 100 μM. This compound increases the calcium retention capacity (CRC) of mitochondria (a measure of mtPTP inhibition) 14.8-fold at 12.5 μM, a concentration that does not affect mitochondrial respiration at which the compound appears non-toxic. Compared to the prior art, the probe ML404 (CID 72199308) is the best-in-class inhibitor of the mtPTP. When the probe and analogues are used as recommended, they are “fit-for-purpose” and should be useful for advancing the search for small-molecule therapeutics for some of the most wide-spread and therapeutically challenging human diseases, such as, multiple sclerosis (MS), amyotropic lateral sclerosis (ALS), Alzheimer's disease (AD), muscular dystrophies (MDs), heart infarction, and stroke.
Assigned Assay Grant #: 5 R03 DA033978-02
Screening Center Name & PI: Sanford Burnham Center for Chemical Genomics (SBCCG) & Michael R. Jackson (PI)
Chemistry Center Name & PI: University of Kansas Specialized Chemistry Center (KU SCC) & Jeffrey Aubé
Assay Submitter & Institution: Paolo Bernardi, Consiglio Nazionale delle Ricerche Neuroscience Institute and Department of Biomedical Sciences, University of Padova, Padova, Italy and Dennis N. Bourdette & Michael A. Forte, Department of Neurology and Vollum Institute, Oregon Health & Science University, Portland, Oregon
PubChem Summary Bioassay Identifier (AID): 602491
Probe Structure & Characteristics
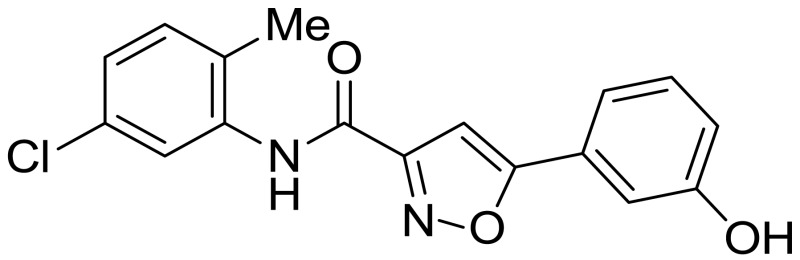
ML404
| CID/ML# | Target Name | EC50 [SID, AID] | Anti-target Name(s) | EC50 [SID, AID] | Fold Selective | Secondary Assay(s) Name(s); Ratio [SID, AID] |
|---|---|---|---|---|---|---|
| CID 72199308 / ML404 | mtPTP (mitochondrial permeability transition pore) Mitochondrial swelling | 4.9 nM [SID 170481135, AID 743359] | Rh123 uptake | >100,000 nM [SID 170481135, AID 743361] | > 20,408× | Calcium Retention Capacity ratio at 12.5 μM CRC/CRC0 = 14.8 [SID 170481135, AID 743360] |
1. Recommendations for Scientific Use of the Probe
While there is a great deal of information available about the functional properties of the mtPTP (as represented in over 7,400 publications), the identification of small molecules specifically targeting the mtPTP or the transition from transient to persistent activation – from normal to pathological – has not advanced in a satisfactory manner, despite the fact that robust assays for the activity of the mtPTP have been established and small molecules are of obvious therapeutic importance.
What limitations in the current state-of-the-art is the probe addressing?
The most prominent prior art compounds are cyclosporine A (CsA) and GNX-865. CsA is by far the best-characterized small molecule acting on the mtPTP. However, there is general agreement that the effect is indirect and exerted through binding of CsA to cyclophilin D (CyPD), a matrix protein. The result is desensitization of the pore (not a block). Therefore, CsA is not the sort of the desired probe being sought and should not be regarded as direct competitive prior art.
The most relevant example of prior art is represented by GNX-865 [1]. It is the best published proof-of-principle that the biological screening strategy reported here, originally designed by P. Bernardi, represents a viable strategy to identify potent and selective mtPTP-inhibiting compounds. The patent covering this compound is assigned to Congenia S.r.l., Milan (Italy) [2] which limits the compound's availability and use, except through a material transfer agreement.
Ultimately, CsA was chosen as a positive biological assay control, while GNX-865 was selected as the best-in-class prior art compound, against which any new best-in-class probe would be measured (please see Section 4.1 for an exhaustive discussion of the prior art).
For what will the probe be used?
In addition to using the probe as a starting point for early-stage drug discovery, appropriately functionalized small molecule inhibitors can be extremely useful for the identification and affinity purification of the molecular components of the ATP synthase contributing to mtPTP formation and opening.
Who in the research community will use the probe?
Individuals whose research interests are focused on the diseases mentioned and more generally on the role of mitochondria and mitochondrial Ca2+ in cellular Ca2+ homeostasis and cell death mechanisms will use the probe.
What is the relevant biology to which the probe can be applied?
It has become clear that mtPTP plays a key role in a wide variety of human diseases whose common pathology may be based in mitochondrial dysfunction triggered by Ca2+ and potentiated by oxidative stress. Consequently, small molecule inhibitors of the mtPTP represent compounds of high therapeutic value. A complete listing of the human pathologies in which the mtPTP may play a key role is outlined in a recent review [3] and include ischemia-reperfusion injury, lysosomal storage, liver, and muscle diseases, as well as specific CNS pathologies. Details relevant to specific, representative diseases are outlined:
- Ischemia-reperfusion injury. A key disorder in which mtPTP opening plays a prominent role is ischemic damage of any tissue, which is most pronounced in ischemic damage of the heart and brain. In the absence of oxygen (i.e., ischemia), cytosolic Ca2+ rises to excessive levels due to the reduced levels of ATP that are required to maintain normal ionic gradients. On reperfusion, mitochondria repolarize and take up Ca2+ to levels required for persistent mtPTP opening. In addition, respiration triggers reactive oxygen species (ROS) production, which together with increased Ca2+ create ideal circumstances for mtPTP activation. The importance of the mtPTP in ischemia/reperfusion damage is highlighted by the observation that mice lacking CyPD are less sensitive than their wild-type counterparts to ischemia/reprefusion injury of the heart, brain and kidney [4-7] and that cell viability is promoted by CsA [8-10].
- Central nervous system (CNS) diseases. Many CNS disorders are distinguished by disturbances of Ca2+ and ROS homeostasis, and, consequently, mtPTP-induced mitochondrial dysfunction [11]. Although resting neurons generally do not use mitochondria to store Ca2+, they can accumulate enormous amounts of Ca2+ primarily following repetitive stimulation. Thus mitochondria modulate not only aerobic ATP production, ROS generation or cell death, but also additional Ca2+-dependent neuronal properties such as neurotransmitter release, synaptic transmission and excitability critical for proper neuronal function [12].
- Excitotoxicity is characterized by excessive entry of Ca2+ into neurons that can be primarily triggered by glutamate and NMDA. Unregulated Ca2+ influx through NMDA receptors and other receptors elicits ROS formation, and mitochondrial depolarization and ultimately, cell death due to persistent mtPTP opening [13]. Intriguingly, during the progression of the excitotoxic injury, “delayed Ca2+ deregulation” also occurs that represents a late secondary increase in cytosolic Ca2+ whose rate is relative to the magnitude of mitochondrial Ca2+ accumulation [14]; the “point of no return” in this process is believed to be mtPTP opening [12].
- Alzheimer's disease (AD) is the most common form mental disability in the elderly, which typically begins with slight failure of memory processes and slowly becomes more pronounced and, eventually, results in a severe and debilitating disease. AD is caused by genetically inherited mutations in the gene for amyloid precursor protein (APP) in a small number of cases, whose proteolyis generates the amyloid beta (Aβ) peptide; massive Aβ deposition in the brain is a hallmark of AD. In addition, mutations in presenilin genes, which encode enzymes involved in APP processing, have also been identified in human AD. There is a bidirectional correlation between Ca2+ signaling and the amyloidogenic pathway. Indeed, expression of proteins that regulate neuron Ca2+ homeostasis is altered in AD patients and APP processing is affected by cytosolic Ca2+. Moreover, Aβ oligomers released outside neurons can form Ca2+-permeable pores on the plasma membrane and can also affect the activity of Ca2+ channels on the plasma membrane and endoplasmic reticulum (ER) [15]. A final effector of this network of Ca2+ alterations may be activation of the mtPTP as substantiated by the observations that in a mouse model of AD where excess Ca2+ has been demonstrated to induce mitochondrial release of cytochrome c, as would be characteristic of neurons undergoing apoptosis. Importantly, this response is prevented by Bcl-2, which improves cognition and blunts neurodegeneration onset [16]. Furthermore, Aβ is transported to the inner mitochondrial membrane (IMM) [17,18] where it interacts with CyPD in mitochondria favoring mtPTP opening. It has been proposed that the absence of CyPD protects neurons from mPTP opening and cell death in the AD mouse model [19].
- Parkinson's disease (PD) is a common neurodegenerative disease characterized by the loss of dopaminergic neurons in the substantia nigra pars compacta, leading to characteristic motor symptoms, that include bradykinesia, hypokinesia, rigidity, resting tremor and postural instability [20]. Dopaminergic neurons are distinctively reliant on voltage dependent L-type Ca2+ channels for independent pacemaking activity and tonic dopamine release [21]. Consequently, these cells are particularly vulnerable to perturbations in the Ca2+ buffering capacity of mitochondria, which may lead to mtPTP opening. Indeed, loss of Ca2+ homeostasis has been proposed as the primary cause of neurodegeneration in the sporadic forms of PD, and the aggregates of α-synuclein, which are the pathological PD hallmarks, contribute to neuronal Ca2+ accumulation.
- Huntington disease (HD) appears to involve mtPTP-dependent mitochondrial defects in its pathogenesis. HD is a progressive genetic disorder that results in motor, cognitive, and psychiatric disturbances caused by mutations in the gene encoding huntingtin (Htt) that ultimately leads to death in adulthood. HD is a member of a family of human genetic disorders generated through translation of an expanded polyglutamine tract. The Ca2+ buffering capacity of neurons is impaired in transgenic mouse models of HD; neurons carrying the mutant Htt gene display dysregulated mitochondrial Ca2+ homeostasis and increased mtPTP sensitivity [22-24].
- Amyotrophic lateral sclerosis (ALS) is caused by degeneration of motor neurons, leading to walking impairment, speech and swallowing difficulties and eventually to respiration inability, ultimately resulting in fatal consequences. The disease is caused by inherited mutations in the superoxide dismutase SOD1 in a subgroup of patients. Consequently, mouse models of ALS have been created through the creation of transgenic mutant SOD1 mice. Affected motor neurons show mitochondrial swelling and fragmentation; the mitochondrial matrix is loaded with aggregates containing mutant SOD1. In these mice, respiratory efficiency is decreased in early disease stages, causing an increased ROS generation [25]. Intracellular Ca2+ dysregulation seems to have a central role in ALS pathogenesis and it is hypothesized that Ca2+-permeable α-amino-3-hydroxy-5-methyl-4-isoxazolepropionic acid (AMPA) type glutamate receptors set off a persistent excitotoxicity injury. In this model, ER Ca2+ depletion is then proposed to occur which is accompanied by mitochondrial Ca2+ overload. Mitochondria would progressively become incapable of handling high Ca2+ concentrations [26]. Accordingly, in this animal model and perhaps the human disease, mitochondrial Ca2+ induces abnormal membrane depolarizations in this genetic form of AD. Such alterations would then lead to mtPTP opening. Evidence that persistent mtPTP opening may be the final effector of neuronal loss is provided by the observation that CsA, or the genetic deletion of CyPD, extend the survival of mice in ALS mouse models [27-29].
- Multiple sclerosis (MS) is the most common disabling disease of young and middle-aged adults [30]. It is believed to have an autoimmune pathogenesis mediated by T and B lymphocytes and macrophages. While MS has been classically conceived of as a disease of myelin, it is now recognized that axonal degeneration is a critical part of the pathogenesis of MS and a major determinant of permanent disability [31]. In MS, axoplasmic Ca2+ overload driven by ionic imbalances and ROS is postulated to lead to mitochondrial dysfunction and ultimately ATP production collapse [32,33]. Ca2+ overload and excessive ROS can result in pathologic opening of the PTP, which ultimately may be critical to axonal degeneration in MS [32]. Inhibition of PTP opening might therefore be neuroprotective in MS. In support of this is the observation that mice genetically lacking CyPD have dramatically reduced axonal injury in comparison with wild type mice following induction of experimental autoimmune encephalomyelitis, a model of MS [34].
- Muscular dystrophies. Collagen VI (ColVI) is an essential component of extracellular matrix of skeletal muscle; mutations in ColVI result in two major human diseases, Ullrich congenital muscular dystrophy (UCMD) and Bethlem myopathy (BM) [35,36]. The effector mechanism responsible for the loss of muscle fibers that characterizes these disorders is mtPTP induction [37], and mitochondrial depolarization, each could be prevented in myoblasts from Ullrich patients by treatment with CsA and non-immunosuppressive CsA derivatives both in vitro [38] and ex vivo [39]. Other forms of muscular dystrophy may also generate their muscle pathology through mtPTP activation such as those due to sarcoglycan and laminin deficiency [40], and Duchenne muscular dystrophy [41,42].
2. Materials and Methods
See subsections for a detailed description of the materials and methods used for each assay.
2.1. Assays
A list of the relevant assays and corresponding PubChem assay identifier numbers (AIDs) is provided in the Appendix A (Table A1). Please see the Appendix B for the detailed assay protocols.
μHTS identification of small molecule inhibitors of the mitochondrial permeability transition pore via an absorbance assay (Primary Screening Assay, Single Concentration, AID 602449)
The goal of this high-throughput assay is to identify compounds that potentially inhibit mtPTP. This is accomplished via the measurement of the change in absorbance of freshly isolated mitochondria in assay buffer due to swelling which occurs via the uptake of Ca2+ in the presence of test compounds. This assay was performed at the Sanford-Burnham Center for Chemical Genomics.
Single concentration confirmation of μHTS inhibitor hits of the mitochondrial permeability transition pore via a fluorescent based assay (Counterscreen Assay, Single Concentration, AID 624504)
The goal of this high-throughput assay is to identify samples within the hit set of test compounds that prevent mitochondrial swelling (see PubChem AID No. 602449) via interference with the IMM potential rather than by blocking or binding to the mtPTP. This is accomplished by measuring the change in fluorescence quenching of the fluorescent dye, Rhodamine 123 (Rh123), a cation that is readily accumulated only by energized mitochondria, in the presence of the test compounds. As Rh123 concentrates in the matrix, it undergoes a process of fluorescence quenching. Depolarization with the uncoupler carbonylcyanide-p-trifluoromethoxyphenyl hydrazone (FCCP) prevents the accumulation of a relevant fraction of Rh123, while a fraction of the probe remains bound to mitochondria independent of depolarization. Compounds that interfere with the buildup or maintenance of the membrane potential (respiratory inhibitors and uncouplers, respectively) will prevent probe accumulation, and can be easily identified with this protocol (they correspond to wells where the fluorescence remains high). This assay was performed at the Sanford-Burnham Center for Chemical Genomics.
Dose response confirmation of μHTS inhibitor hits of the mitochondrial permeability transition pore via an absorbance assay (Confirmatory Assay, Concentration-Response, AID 651561)
The goal of this assay is to confirm in dose response the activity of compounds identified in a high-throughput assay designed to detect potential inhibitors of the mtPTP, (see PubChem AID No. 602449). This is accomplished via the measurement of the change in absorbance of freshly isolated mitochondria in assay buffer due to swelling which occurs via the uptake of Ca2+ in the presence of varying concentrations of test compounds. This assay was performed at the Sanford-Burnham Center for Chemical Genomics.
Dose response confirmation of μHTS inhibitor hits of the mitochondrial permeability transition pore via a fluorescent based counterscreen assay (Counterscreen Assay, Concentration-Response, AID 651564)
The goal of this high-throughput assay is to identify samples within the hit set of test compounds that prevent mitochondrial swelling (see PubChem AID No. 602449) via interference with the IMM potential rather than by blocking or binding to the mtPTP. This is accomplished by measuring the change in fluorescence quenching of the fluorescent dye, Rh123, a cation that is readily accumulated only by energized mitochondria, in the presence of varying concentrations of test compounds. As Rh123 concentrates in the matrix, it undergoes a process of fluorescence quenching. Depolarization with the uncoupler FCCP prevents the accumulation of a relevant fraction of Rh123, while a fraction of the probe remains bound to mitochondria independent of depolarization. Compounds that interfere with the buildup or maintenance of the membrane potential (respiratory inhibitors and uncouplers, respectively) will prevent probe accumulation, and can be easily identified with this protocol (they correspond to wells where the fluorescence remains high). This assay was performed at the Sanford-Burnham Center for Chemical Genomics.
Dry powder dose response confirmation of μHTS inhibitor hits of the mitochondrial permeability transition pore via an absorbance assay. Mitochondrial swelling (Hit Validation, Confirmatory Assay, Concentration-Response, AID 720722)
The goal of this assay is to confirm in dose response the activity of a set of compounds (coming from dry powders) identified in the high-throughput screen designed to detect potential inhibitors of the mtPTP (see PubChem AID 602449 and AID 651561). This is accomplished via the measurement of the change in absorbance of freshly isolated mouse liver mitochondria in assay buffer due to swelling which occurs due to the uptake of excess Ca2+ in the presence of varying concentrations of test compounds. This assay was performed in the lab of the assay provider, Paolo Bernardi.
Dry powders dose response confirmation of μHTS inhibitor hits of the mitochondrial permeability transition pore via a fluorescent based counterscreen. Rhodamine 123 Quenching (Hit Validation, Counterscreen Assay, Concentration-Response, AID 720723)
The goal of this assay is to identify samples within the hit set of test compounds that prevent mitochondrial swelling (see PubChem AID 602449 and AID 651561) via interference with the IMM potential rather than by blocking or binding to the mtPTP. This is accomplished by measuring the change in fluorescence quenching of the fluorescent dye, Rh123, a cation that is readily accumulated only by energized mitochondria, in the presence of varying concentrations of test compounds. As Rh123 concentrates in the matrix, it undergoes a process of fluorescence quenching. Depolarization with the uncoupler FCCP prevents the accumulation of a relevant fraction of Rh123, while a fraction of the probe remains bound to mitochondria independent of depolarization. Compounds that interfere with the buildup or maintenance of the membrane potential (respiratory inhibitors and uncouplers, respectively) will prevent probe accumulation, and can be easily identified with this protocol (they correspond to wells where the fluorescence remains high). This assay was performed in the lab of the assay provider, Paolo Bernardi.
Dry powder dose response confirmation μHTS inhibitor hits of the mitochondrial permeability transition pore via Calcium Retention Capacity test (Hit Validation, Confirmatory Assay, Concentration-Response, AID 720728)
The goal of this assay is to confirm in dose response the activity of a set of compounds (coming from dry powders) identified in the high-throughput screen designed to detect potential inhibitors of the mtPTP, (see PubChem AID 602449). This is accomplished via the Calcium Retention Capacity (CRC) test. CRC is one of the most sensitive assays to assess the propensity of the mtPTP to open. This test measures the amount of Ca2+ that mitochondria can accumulate and retain before the precipitous release that marks mtPTP opening. Extra-mitochondrial Ca2+ fluxes are measured fluorometrically using Calcium Green-5N, a low affinity membrane-impermeant probe that increases its fluorescence emission upon Ca2+ binding. Mitochondria (0.25 mg/mL) are routinely suspended in 200 μL of assay buffer that also contains 0.5 μM Calcium Green-5N and the suspension is subjected to train of Ca2+ pulses or spikes (typically 5 μM each). Each spike represents first, the increase in fluorescence (due to extra-mitochondrial Ca2+ binding to Calcium Green- 5N) followed by a decrease in fluorescence due to the accumulation of added Ca2+ into mitochondria. Mitochondrial accumulation of Ca2+ continues on addition of subsequent pulses until the “threshold” for mtPTP activation is reached and all Ca2+ is released from mitochondria (represented by the dramatic terminal fluorescence increase) due to opening of the mtPTP. Dose response curves are calculated by comparing the total Ca2+ added for mtPTP activation in the presence of test compound (CRC) with respect to the CRC in the absence of test compound (CRC0). This assay was performed in the lab of the assay provider, Paolo Bernardi.
Concentration-response assay to identify compounds that inhibit mitochondrial swelling (SAR Assay AID 743359)
The goal of this assay is to determine the activity of test compounds designed to inhibit the mtPTP. This is accomplished via the measurement of the change in absorbance of freshly isolated mouse liver mitochondria in assay buffer due to swelling which occurs as a result of the uptake of excess Ca2+ in the presence of varying concentrations of test compound. This assay was performed in the lab of the assay provider, Paolo Bernardi.
Concentration-response counterscreen assay to identify compounds that prevent mitochondrial swelling via interference with the IMM potential (SAR Assay AID 743361)
The goal of this assay is to identify test compounds that prevent mitochondrial swelling via interference with the IMM potential rather than by blocking or binding to the mtPTP.
This is accomplished by measuring the change in fluorescence quenching of the fluorescent dye, Rh123, in the presence of varying concentrations of test compound. Rh123 is a fluorescent cation that is readily accumulated by energized mitochondria. As it concentrates in the matrix, Rh123 undergoes a process of fluorescence quenching. Depolarization with the uncoupler FCCP prevents the accumulation of a relevant fraction of Rh123, while a fraction of the probe remains bound to mitochondria independent of depolarization. Compounds that interfere with the buildup or maintenance of the membrane potential (respiratory inhibitors and uncouplers, respectively) will prevent probe accumulation, and can be easily identified with this protocol (they correspond to wells where the fluorescence remains high). This assay was performed in the lab of the assay provider, Paolo Bernardi.
Calcium Retention Capacity assay to assess the propensity of the mtPTP to open as a function of test compound concentration (SAR Assay AID 743360)
The CRC assay is one of the most sensitive assays to assess the propensity of the mtPTP to open. This test measures the amount of Ca2+ that mitochondria can accumulate and retain before the precipitous release that marks mtPTP opening. Extra-mitochondrial Ca2+ fluxes are measured fluorometrically using Calcium Green-5N, a low affinity membrane-impermeant probe that increases its fluorescence emission upon Ca2+ binding. Mitochondria (0.25 mg/ml) are routinely suspended in 200 μL of Assay buffer that also contains 0.5 μM Calcium Green-5N and the suspension is subjected to train of Ca2+ pulses or spikes (typically 5 μM each). Each spike represents first, the increase in fluorescence (due to extra-mitochondrial Ca2+ binding to Calcium Green- 5N) followed by a decrease in fluorescence due to the accumulation of added Ca2+ into mitochondria. Mitochondrial accumulation of Ca2+ continues on addition of subsequent pulses until the “threshold” for mtPTP activation is reached and all Ca2+ is released from mitochondria (represented by the dramatic terminal fluorescence increase) due to opening of the mtPTP. Dose response curves are calculated by comparing the total Ca2+ added for mtPTP activation in the presence of test compound (CRC) with respect to the CRC in the absence of test compound (CRC0). This assay was performed in the lab of the assay provider, Paolo Bernardi.
2.2. Probe Chemical Characterization
ML404 was analytically characterized for identity by 1H and 13C NMR and HRMS. Samples of ML404 were analytically characterized for purity by RP HPLC and were found to be 99% pure on the basis of peak integration (area under the curve) from UV-Vis absorbance at 214 nm. Spectral data for the probe are provided in Appendix C.
Probe Chemical Structure and Properties

Aqueous Solubility
The aqueous solubility for the probe was measured in phosphate-buffered saline (PBS) at room temperature (23 ºC). PBS by definition is 137 mM KCl, 10 mM sodium phosphate dibasic, 2 mM potassium phosphate monobasic at a pH 7.4. The probe (compound ML404) was found to have a solubility of 0.28 μg/mL, or 0.85 μM, under these conditions, which is 173× the EC50 in the mitochondrial swelling assay. The solubility for the probe in the assay media used for the mitochondrial swelling, Rh123 uptake, and CRC assays is being measured at the time of the submission of this report. See the Appendix D for the detailed procedure for measuring aqueous solubility.
Aqueous Stability & Thiol Stability
The aqueous stability for the probe compound was assessed in 1:1 Acetronitrile (ACN):PBS (no antioxidants or other protectants, DMSO concentration 1%, room temperature) and the results are reported in Figure 2.2.1. The probe compound ML404 was found to be stable in 1:1 ACN:PBS, whereby 100% of the compound remained after 48 hours (Figure 2.2.1, B). See Appendix D for the detailed procedure for measuring aqueous stability.
Figure 2.2.1
Stability of ML404 in 1:1 ACN:PBS & DTT Stability Assay. ML404 (CID 72199308, SID 174315333) was tested over a time course in an aqueous stability assay and thiol stability assays. (A) Stability of the probe over 8 hours in 1:1 ACN:PBS; (B) Stability (more...)
The thiol stability for the probe compound was assessed in 1:1 ACN:PBS and the results are reported in Figure 2.2.1. The probe compound ML404 was found to be stable to dithiothreitol (DTT), whereby 100% of the compound remained after 8 hours (Figure 2.2.1, C). See the Appendix D for the detailed procedure for measuring thiol stability.
Submission of Probe and Analogues to the NIH MLSMR
Samples of the probe and six analogues were submitted to the NIH MLSMR on March 24, 2014. Please see the Table E1, Appendix E, for the compound ID information.
2.3. Probe Preparation
The probe (ML404) was synthesized in one step using a coupling reaction between commercially available 5-(3-hydroxyphenyl)isoxazole-3-carboxylic acid and 5-chloro-2-methylaniline using thionyl chloride and triethylamine in dry THF as shown in Scheme 2.3.1. The reaction mixture was allowed to stir at room temperature for 2 h, and was diluted with EtOAc, washed with water, aqueous hydrochloric acid, and brine, and purified by Flash chromatography.
Scheme 2.3.1
Synthesis of the Probe (ML404).
Experimental procedures for the synthesis of the probe can be found in Appendix F.
3. Results
3.1. Dose Response Curves for Probe

Figure 3.1.1Concentration-response curves for the probe ML404
ML404 (CID 72199308, SID 170481135) was tested across the stated concentrations in the primary and several secondary assays. (A) swelling inhibition (AID 743359), EC50 = 4.9 nM; (B) interference with Rhodamine 123 uptake (AID 743361), no effect at highest (100 μM) concentration tested; assays performed on isolated mouse liver mitochondria. ML404-to-solvent calcium retention capacity (CRC) ratios of (C) isolated mouse liver mitochondria (AID 743360), EC50 = 1.42 μM, of permeabilized (D) mouse embryonic fibroblasts, EC50 = 0.31 μM, and (E) HeLa cells, EC50 = 0.95 μM; (F) interference with HeLa cell proliferation after 72-hour treatment with indicated concentration of ML404, no toxicity at highest (200 μM) concentration tested.
3.2. Cellular Activity
The effects of compound hits CID 5307652 and CID 5308390 (results not shown) as well as probe ML404 (Figure 3.1.1., D, E) on CRC of permeabilized mouse (murine embryonic fibroblast, MEF) and human (HeLa) cells were tested. The compounds were found to be equally effective, a finding that validates the mouse screening for human use. Moreover, HeLa cell viability over 72-hour treatment with 0.78 – 200 μM ML404 was measured and no untoward effect was observed (Figure 3.1.1., F). Mitochondrial respiration of intact adherent cells in the presence of ML404 was measured. Data suggest that the probe does not affect the respiratory chain (basal respiration is not affected) and that it does not interfere with oxygen consumption coupled to ATP synthesis. See Appendix B for assay protocols. These assays were performed in the lab of the assay provider, Paolo Bernardi.
The cellular permeability (PAMPA and blood-brain barrier (BBB) PAMPA) for ML404 and two supporting analogues was measured and was found to be good. The cellular permeability for the probe (PAMPA) was determined to be approximately 364 × 10-6 cm/s, 319 × 10-6 cm/s, and 235 × 10-6 cm/s at pH 5.0, 6.2, and 7.4, respectively. The BBB permeability for the probe (BBB PAMPA) was determined to be approximately 131 × 10-6 cm/s at pH 7.4. See the Appendix D for the experimental procedure for cellular permeability (PAMPA and BBB PAMPA) measurements.
3.3. Profiling Assays
The probe compound and supporting analogues were submitted to the Sanford-Burnham Medical Research Institute for various physiochemical and in vitro pharmacokinetic property measurements (i.e., aqueous solubility in PBS, cell permeability (PAMPA and blood brain barrier PAMPA), plasma stability (human and mouse), plasma protein binding (human and mouse), hepatic microsome stability (human and mouse), and toxicity towards Fa2N-4 immortalized human hepatocytes). Overall, the probe showed poor aqueous solubility (0.85 μM in PBS, pH 7.4), good permeability that is consistent across the pH range for which measurements were collected, good BBB permeability at pH 7.4, moderate stability to human plasma (59% remaining after 3 hours), very poor stability to mouse plasma (0.1% remaining after 3 hours), high binding to human/mouse plasma proteins (99% of compound bound at 10 μM (human and mouse)), very poor stability to human/mouse hepatic microsomes (0% remaining after 1 hour (human and mouse)), and no toxicity toward immortalized human hepatocytes (LC50 >50 μM toward Fa2N-4 immortalized human hepatocytes). See the Appendix D for the experimental procedures for the various physiochemical and in vitro pharmacokinetic property measurements.
To explore the potential for off-target effects the probe compound ML404 was submitted to Eurofins Panlabs for screening in the LeadProfilingScreen, a profiling screen that includes 68 protein targets of therapeutic or toxicological interest, and the significant results for the primary binding assays are summarized in the Table 3.3.1, while the complete results and associated experimental procedure are listed in detail in the Appendix G. Overall, the probe compound was not observed to be biologically promiscuous, whereby, significant inhibition was observed for only 4 of the 68 biological targets tested. The most significant inhibition was observed for the Tachykinin NK1, Norepinephrine Transporter, Serotonin 5-HT2B, and Adenosine A1.
Table 3.3.1
Select Eurofins PanLabs LeadProfilingScreen Results for the Probe ML404.
4. Discussion
The aim of this project was to identify small molecule inhibitors of the mtPTP. We identified ML404, a compound that potently and selectively inhibits mitochondrial swelling, and which meets the attributes for a probe as defined in the Chemical Probe Development Plan (CPDP), as listed in Table 4. The long-term goal is to use this probe and analogues to illuminate the workings of the mtPTP, with the ultimate goal of translating this knowledge into therapeutics.
Table 4.1
Comparison of the Observed Probe Properties to the Probe Criteria.
4.1. Comparison to Existing Art and How the New Probe is an Improvement
The prior art was investigated by searching the Chemical Abstracts Service databases using the SciFinder software and by searching the Prous Integrity Drugs & Biologics database. The search terms applied and the statistics for the prior art search are provided in the Table H1, Appendix H. Abstracts were obtained for all references returned from the search and were analyzed for relevance to the current project, and for all references that were deemed relevant, the articles were analyzed and the results are summarized. The search results are current as of March 24, 2014, and the reported inhibitors of the mtPTP are shown in the Figure 4.1.1.
Figure 4.1.1
Structures for Compounds Reported to inhibit the mtPTP.
Since the start of the project (February 29, 2012), a modest amount of small-molecule prior art has been reported in the literature. For many of the compounds shown in Figure 4.1.1 the exact mechanism of action is not known. A number of the exact compounds, or close structural analogues, shown in Figure 4.1.1 where identified in the MLPCN mtPTP high throughput screen and were included for reference purposes during hit validation on samples from the solid physical state.
While many mtPTP “inhibitors” have been reported in the literature (Figure 4.1.1), for most of them a proof of selectivity of action is missing, and their effective concentrations (usually tested only in isolated mitochondria) are too high for them to be considered useful tool or probe compounds.
CsA [43], NIM-811 [44], and antamanide [45] desensitize mtPTP by inhibiting matrix CyPD, and the compound efficacy varies with CyPD expression levels. CyPD inhibition desensitizes the mtPTP to Ca2+ but does not block the pore, which is a major limitation to its therapeutic efficacy. Furthermore, the binary complex of CsA or antanamide with CyPA binds calcineurin and causes immunosuppression, which would be a severe, undesired side effect in mtPTP-dependent diseases. NIM-811 does not cause immunosuppression (calcineurin is not inhibited by this drug), but it binds all CyPs which may cause unpredictable side effects.
HO-3538 [46], hydroxysafflor yellow A [47], and ubiquinone 0 (Q0) [48,49] exert their effect on the mtPTP via anti-oxidant activity and scavenging of reactive oxygen species (ROS), with a possible effect of Q0 on pore-regulating SH groups. It must be mentioned, however, that the latter compound displays significant mitochondrial toxicity at doses that are only very slightly higher than the inhibitory ones.
Data have been reported on the activity of simple aryl-, bisaryl-, and thio-ureas as inhibitors of the peptidylprolyl isomerase (PPIase; rotamase) activity of CyPA. Compounds could then be divided into three classes based on their relative ability to inhibit CyPD rotamase activity and mitochondrial swelling. Compounds such as GPI-15483 and GPI-18297, and their more soluble derivative GPI-19410, were weak/inactive rotamase inhibitors but very effective at inhibiting the mPTP [50]. CyPD-based mtPTP inhibitors that do not affect the rotamase activity certainly represent a step forward in terms of selectivity; however, their efficacy is limited to their target (CyPD), and, as a result, they are not expected to be pore blockers, and are expected to be inactive in tissues where CyPD expression is low or absent (for example, see Li et al., 2012 [51]).
TRO-40303 has been reported to delay mtPTP opening [52] but does not affect the CRC, and acts by decreasing the level of ROS, and is, therefore, not specific; furthermore, its putative target (TSPO) is not related to mtPTP, as we recently showed [53].
Allopregnanolone has been reported to inhibit mtPTP-dependent currents in mitoplasts at 1 μM, to inhibit mitochondrial Ca2+-induced swelling at 100 μM, and to help retain cytochrome c in mitochondria after middle cerebral artery occlusion [54], yet it is difficult to draw a mechanistic correlation, particularly because this single study did not assess whether mitochondrial Ca2+ uptake did occur at 100 μM allopregnanolone (lack of Ca2+ uptake, because of membrane depolarization, would generate a “false positive”). This control is also missing in the study by Villareal, which reports on a variety of effects of derivatives of catechins on mitochondrial respiration, and on protection of hearts from ischemia and ischemia-reperfusion injury of the heart [55]. The effect on Ca2+-dependent mitochondrial swelling was negligible at 5 μM and partial even at 5 mM, a concentration that is very likely to have interfered with energy conservation and with Ca2+ uptake.
2-APB was only tested in isolated mitochondria and is only effective at 50 μM, the mechanism is unknown, and there is no evidence of selectivity [56].
Ropinirole has been reported to inhibit mtPTP with EC50 of 3.4 μM, but it is an agonist of the post-synaptic dopamine D2-receptor and we are not aware of any developments since the original report [57].
Sevoflurane [58] is a volatile anesthetic and therefore of very impractical use.
Bongkrekic acid is an inhibitor of the adenine nucleotide translocator [59], and, as a result, is expected to cause severe toxicity due to inhibition of oxidative phosphorylation.
A set of 28 inhibitors was identified from a focused screen of 1,040 FDA-approved drugs and other bioactive compounds by Stavrovskaya [60]. These are: Trifluoperazine, Methiothepin, Promethazine, Triflupromazine, Clomipramine, Flufenazine, Chlorprothixene, Nortriptyline, Promazine, Thioridazine, Mefloquine, Desipramine, Chlorpromazine, Prochlorperazine, Propiomazine, Pimethixene, Perphenazine, Amitriptyline, Amoxepine, Maprotiline, Quinacrine, Periciazine, Ethopropazine, Mianserin, Cyclobenzaprine, Imipramine, Clozapine, and Doxepin. These compounds were not very potent, and no protection was observed at or below 1 μM. As a result, we are not aware of any completed or ongoing clinical trials with these molecules as inhibitors of the mtPTP, probably a result of low potency.
Ro-68-3400 was identified through the screening of the Hoffmann-La Roche chemical library and displayed an excellent EC50 (0.19 μM). The molecule possesses a reactive moiety that may make it unsuitable for biochemical or drug discovery studies [61]. No further developments have ever been reported.
5-(3,5-Dichlorophenyl)-N-(2,4-dioxo-3-(pyridin-3-ylmethyl)imidazolidin-1-yl)furan-2-carboxamide [62] was reported to be partially effective in a swelling assay at 50 μM, but key controls to test whether the membrane potential is affected were not performed, so the results cannot be interpreted.
(E)-2-((3,4-Dichlorobenzyl)oxy)benzaldehyde-O-(1-benzylpyrrolidin-3-yl)oxime was only tested in cells [63] and its mitochondrial effects cannot be attributed to mtPTP inhibition.
1-(3-Chlorophenyl)-3-phenyl-pyrrole-2,5-dione has been patented [64] as an mtPTP inhibitor belonging to the class of substituted maleimides, with a reported potency in the CRC assay of 2.5, i.e. much lower than that of our lead compound. The mechanism of action is not known, and, like Ro-68-3400, the reactive moiety could make it unsuitable for biochemical or drug discovery studies, and we are not aware of its further use.
The most relevant example of prior art is represented by GNX-865. The patent covering this compound is assigned to Congenia S.r.l., Milan (Italy) [2], which limits the compound's availability and use, except through a material transfer agreement.
The probe compound ML404 (CID 72199308) inhibits mitochondrial swelling with an EC50 = 4.9 nM, while it perturbs mitochondrial coupling (an undesired effect) at > 100 μM. This compound increases the CRC of mitochondria (a measure of mtPTP inhibition) 14.8-fold at 12.5 μM, a concentration that does not affect mitochondrial respiration at which the compound appears non-toxic. Comparison of the relevant potencies indicates that ML404 is at least a 2.3-fold more effective inhibitor than GNX-865.
When the probe and analogues are used as recommended, they are “fit-for-purpose” [65] and should be useful for advancing the search for small-molecule therapeutics for some of the most wide-spread and therapeutically challenging human diseases, such as, multiple sclerosis (MS), amyotropic lateral sclerosis (ALS), Alzheimer's disease (AD), muscular dystrophies (MDs), heart infarction, and stroke.
Mechanism of Action Studies
The discovery that the mtPTP forms from dimers of ATP synthase [66] has been a major advance for studies of the mechanism of action of mtPTP inhibitors, including those discovered in the work described here. A first question that we have addressed is whether the site of action for compounds in the isoxazole and benzamide chemotypes is CyPD. None of the selected compounds acts through CyPD, as inhibition is still observed in the presence of CsA (additional experiments are under way with CyPD-null mitochondria). A second important test is to assess whether the ATP synthase activity is affected, which could cause drug toxicity. Our results, not shown here, indicate that the ATP synthase activity is not affected, which is very encouraging for use of these compounds as probes and for our planned development of small-molecule therapeutics and their testing in relevant in vivo models of mtPTP-dependent diseases. Further, the ease with which the ATP synthase complex can be immunoprecipitated and resolved with a variety of analytical techniques holds great promise for the identification of the binding site(s) of our inhibitory compounds (see Figure 4.1.2 for an elaboration of one way these inhibitors can be used for this purpose). In turn, this is expected to lead to a better understanding both of the mechanism of action of the compounds and of the molecular basis for the transition of the ATP synthase from an energy-conserving device into the energy-dissipating mtPTP.
Figure 4.1.2
Future SAR design arround the probe ML404.
Planned Future Studies
Structure-Activity Relationship (SAR) and Structure-Property Relationship (SPR) Studies – As a part of future SAR investigations, we envision making the following changes to the probe compound (ML404) as illustrated in Figure 4.1.2: (1) replace the methyl group at the ortho-position on the phenyl ring on the left-side region (highlighted in red) with different electron-withdrawing, electron-donating, and photoaffinity-labeling groups, (2) replace the amide functional group by the sulfonamide functional group or reverse the direction of the amide group (highlighted in green), (3) vary the position of 3-hydroxyl group (or bioisostere) on the phenyl ring on the right-side region (highlighted in blue) and introduce additional electron-withdrawing or electron-donating groups, and (4) incorporate alternative five-membered heterocycles (highlighted in yellow). Since the previous rounds of SAR focussed mostly on modifications on the left- and right-side regions, future SAR studies might be focussed on changing the amide and heterocycle functionalities.
Apart from continuing to investigate SAR for the probe chemotype, the SPR issues related to poor aqueous solubility and very poor stability to mouse plasma and human/mouse hepatic microsomes will be addressed.
In practice, aqueous solubility of > 60 μg/mL (pH 6.5) is desired to anticipate good oral bioavailability [67]. Toward improving thermodynamic as well as kinetic solubility, crystal lattice energy and lipophilicity will be varied. In general, decreasing lipophilicity by introducing ionizable or polar groups will improve the solvation potential by increasing solvent-solute interactions. Figure 4.1.3 highlights some structure changes that could be explored to improve aqueous solubility: (1) replace the methyl group (highlighted in red) in the probe ML404 by polar or ionizable groups, i.e., the NMe2 group, (2) introduce polar groups in the 5-membered ring heterocycle (highlighted in yellow), i.e., pyrazole, and (3) introduce additional polarity in the right-side region (highlighted in blue), by varying the position of a nitrogen atom in the phenol ring (which might also improve metabolic stability).
Figure 4.1.3
Future SPR design around the probe ML404.
We imagine that, in the first instance, stability issues toward mouse plasma and human/mouse hepatic microsomes are associated with the phenol group (right-side region, Figure 4.1.3), which is susceptible to metabolic oxidation. To address this issue, we propose to install various bioisosteres of phenol such as methanesulfonamide, benzimidazolinone, or indole, for example [68]. Of course, the five-membered heterocycle could also be a site of metabolism, for which SPR will be explored, too [69].
For each derivative of ML404 generated as outlined, the following assays are planned. Detailed protocols for these and additional assays are outlined in Appendix B and Appendix D.
Whole Cell Calcium Retention Capacity (Whole Cell CRC, human and mouse) – The CRC assay outlined has been used in the context of whole cells following the permeabilization of the plasma membrane with low levels of detergent. Additionally, plasma membrane permeability can be assessed by similar cellular assays performed in the absence of digitonin.
ATP Synthase Assays – Since we have recently demonstrated that the mtPTP is formed by a specific Ca2+- dependent conformation of dimers of ATP synthase [66], it will be important to assess individual compounds for their ability to inhibit either of the two known enzymatic activities of this complex. In general, for screening large numbers of compound samples, we will use the Seahorse XF24 analyzer to measure respiration of isolated mitochondria exposed to individual test compounds, a method that has proven to be reliable, sensitive, and cost-effective, (see http://www.seahorsebio.com/learning/app-notes/iso-mito.php). In addition, we will specifically assess the two activities known for ATP synthase: (a) ATP Synthesis and (b) ATP Hydrolysis.
Aqueous solubility – Solubility analysis of ML404 derivatives will be performed using a direct UV kinetic solubility method in a 96-well format. Those compounds with > 60 μg/ml solubility (at pH 7.4) will be candidates for further development.
Membrane Permeability through the blood-brain barrier – Permeability will be assessed using an in vitro model for the passive transport through the blood-brain barrier, BBB-PAMPA. For this, the Parallel Artificial Membrane Permeability Assay (PAMPA) in a 96-well format will be used. The calculated effective permeability, Pe, is expressed as a kinetic parameter (centimeter per second). A larger number indicates greater permeability. LogPe is often used to report permeability, and is inversely proportional to Pe; thus the smaller LogPe value indicates greater permeability.
Hepatic microsome stability – Metabolic stability of ML404 derivatives will be assessed in the presence of human liver microsomes and mouse liver microsomes. The percent of parent compound remaining after 60 minutes will be determined. Those ML404 derivatives with 50-80% parent compound remaining after the 60 minute incubation in hepatic microsomes will be selected for further development.
Creation of Photoaffinity Probes – Our recent results are consistent with the idea that the mtPTP represents a unique, Ca2+-dependent conformation of dimers of the ATP synthase macromolecular complex of the IMM. Although a number of additional proteins appear to co-ordinate the monomer-to-dimer transitions, any details implicit in the macromolecular interactions that lead to dimer formation have yet to be defined [70]. Furthermore, dimers of ATP synthase are crucial to establishing the critical IMM structure consisting of ribbons, or linear rows of dimers localized at the regions of highest curvature along the edges of cristae [71-73]. Most importantly, however, no information is available on how this complex of proteins is reorganized by Ca2+, either transiently or persistently, to generate the Ca2+ release channel, or pore, required for mtPTP activity. We plan to prepare inhibitors (for example, by replacing the left-side methyl group of ML404 by a trifluoromethyl diazirine) that irreversibly label target subunits of the ATP synthase or other components critical for mtPTP regulation or structure by photoaffinity labeling for subsequent identification by proteomic (mass spec (MS)) techniques. Photoaffinity labeling of biological macromolecules has revolutionized the ability to, among other things, isolate and identify proteins that participate in small-molecule protein interactions [74]. In the simplest implementation, protein ligands are derivatized to include a photoreactive functional group (FG), which, upon irradiation, reacts to covalently modify the target protein. One of the most useful photoreactive FGs is the diazirine FG, which is also one of the smallest, a feature that minimizes perturbation of the parent small-molecule-protein interaction. Upon irradiation, the diazirine FG generates a carbene which rapidly inserts into proximal C-H, O-H, or X-H bonds of the target protein (where X = heteroatom). Once covalently modified by a photoaffinity label, modified proteins are purified and identified through MS analysis by virtue of the small-molecule label. An alternative approach will also be considered, whereby two minimally perturbing photoaffinity and affinity purification labels will be incorporated into ML404 [75].
Direct inhibitor effect of ML404 and Derivatives – Dimers of the ATP synthase purified by BN-gel electrophoresis were reconstituted into lipid bilayers [66]. In the presence of Ca2+, addition of the pore activator benzodiazepine 423 (Bz-423) triggered the opening of a channel with currents that were typical of the mitochondrial megachannel, which is the mtPTP electrophysiological equivalent. The activity of ML404 and derivatives on mtPTP activity as monitored physiologically by dimers of ATP synthase incorporated into bilayers will be assessed, as will their ability to counteract the activation that occurs in the presence of Bz-423.
5. References
- 1.
- Fancelli D, Abate A, Amici R, Bernardi P, Ballarini M, Cappa A, Carenzi G, Columbo A, Contursi C, Lisa FL, Dondio G, Gagliardi S, Milanesi E, Minucci S, Pain G, Pelicci PG, Saccani A, Storto M, Thaler F, Varasi M, Villa M, Plyte S. Cinnamic Anilides as New Mitochondrial Permeability, Transition Pore Inhibitors Endowed with Ischemia-Reperfusion Injury Protective Effect in Vivo. J. Med. Chem. 2014;57:5333–5347. [PubMed: 24918261]
- 2.
- Fancelli D, Plyte S, Ballarini M. EP 2010/ 2179984 A1. Acrylamido derivatives useful as inhibitors of the mitochondrial permeability transition. 2010
- 3.
- Rasola A, Bernardi P. Mitochondrial permeability transition in Ca+2-dependent apoptosis and necrosis. Cell Calcium. 2011;50:222–233. [PubMed: 21601280]
- 4.
- Baines CP, Kaiser RA, Purcell NH, Blair NS, Osinska H, Hambleton MA, Brunskill EW, Sayen MR, Gottlieb RA, Dorn GW, Robbins J, Molkentin JD. Loss of cyclophilin D reveals a critical role for mitochondrial permeability transition in cell death. Nature. 2005;434:658–662. [PubMed: 15800627]
- 5.
- Nakagawa T, Shimizu S, Watanabe T, Yamaguchi O, Otsu K, Yamagata H, Inohara H, Kubo T, Tsujimoto Y. Cyclophilin D-dependent mitochondrial permeability transition regulates some necrotic but not apoptotic cell death. Nature. 2005;434:652–658. [PubMed: 15800626]
- 6.
- Schinzel AC, Takeuchi O, Huang Z, Fisher JK, Zhou Z, Rubens J, Hetz C, Danial NN, Moskowitz MA, Korsmeyer SJ. Cyclophilin D is a component of mitochondrial permeability transition and mediates neuronal cell death after focal cerebral ischemia. Proc. Natl. Acad. Sci. USA. 2005;102:12005–12010. [PMC free article: PMC1189333] [PubMed: 16103352]
- 7.
- Park J, Pasupulati R, Feldkamp T, Roeser N, Weinberg J. Cyclophilin D and the mitochondrial permeability transition in kidney proximal tubules after hypoxic and ischemic injury. J. Physiol. Renal Physiol. 2011;301:134–150. [PMC free article: PMC3129895] [PubMed: 21490135]
- 8.
- Griffiths EJ, Halestrap AP. Mitochondrial non-specific pores remain closed during cardiac ischaemia, but open upon reperfusion. Biochem. J. 1995;307:93–98. [PMC free article: PMC1136749] [PubMed: 7717999]
- 9.
- Matsumoto S, Friberg H, Ferrand-Drake M, Wieloch T. Blockade of the mitochondrial permeability transition pore diminishes infarct size in the rat after transient middle cerebral artery occlusion. J. Cereb. Blood Flow Metab. 1999;19:736–741. [PubMed: 10413027]
- 10.
- Uchino H, Elmer E, Uchino K, Li PA, He QP, Smith ML, Siesjo BK. Amelioration by cyclosporin A of brain damage in transient forebrain ischemia in the rat. Brain Res. 1998;812:216–226. [PubMed: 9813336]
- 11.
- Norenberg MD, Rao KV. The mitochondrial permeability transition in neurologic disease. Neurochem. Int. 2007;50:983–997. [PMC free article: PMC4714712] [PubMed: 17397969]
- 12.
- Pivovarova NB, Andrews SB. Calcium-dependent mitochondrial function and dysfunction in neurons. FEBS J. 2010;277:3622–3636. [PMC free article: PMC3489481] [PubMed: 20659161]
- 13.
- Schinder AF, Olson EC, Spitzer NC, Montal M. Mitochondrial dysfunction is a primary event in glutamate neurotoxicity. Journal of Neuroscience. 1996;16:6125–6133. [PMC free article: PMC6579180] [PubMed: 8815895]
- 14.
- Budd SL, Nicholls DG. Mitochondria, calcium regulation, and acute glutamate excitotoxicity in cultured cerebellar granule cells. J. Neurochem. 1996;67:2282–2291. [PubMed: 8931459]
- 15.
- Supnet C, Bezprozvanny I. Neuronal calcium signaling, mitochondrial dysfunction, and Alzheimer's disease. J. Alzheimers Dis. 2010;20 Suppl 2:S487–S498. [PMC free article: PMC4996661] [PubMed: 20413848]
- 16.
- Demuro A, Parker I, Stutzmann GE. Calcium signaling and amyloid toxicity in Alzheimer disease. Journal of Biological Chemistry. 2010;285:12463–12468. [PMC free article: PMC2857063] [PubMed: 20212036]
- 17.
- Hansson Petersen CA, Alikhani N, Behbahani H, Wiehager B, Pavlov PF, Alafuzoff I, Leinonen V, Ito A, Winblad B, Glaser E, Ankarcrona M. The amyloid beta-peptide is imported into mitochondria via the TOM import machinery and localized to mitochondrial cristae. Proc. Natl. Acad. Sci. USA. 2008;105:13145–13150. [PMC free article: PMC2527349] [PubMed: 18757748]
- 18.
- Pavlov PF, Hansson PC, Glaser E, Ankarcrona M. Mitochondrial accumulation of APP and Abeta: significance for Alzheimer disease pathogenesis. J. Cell. Mol. Med. 2009;13:4137–4145. [PMC free article: PMC4496119] [PubMed: 19725915]
- 19.
- Du H, Guo L, Fang F, Chen D, Sosunov AA, McKhann GM, Yan Y, Wang C, Zhang H, Molkentin JD, Gunn-Moore FJ, Vonsattel JP, Arancio O, Chen JX, Yan SD. Cyclophilin D deficiency attenuates mitochondrial and neuronal perturbation and ameliorates learning and memory in Alzheimer's disease. Nat. Med. 2008;14:1097–1105. [PMC free article: PMC2789841] [PubMed: 18806802]
- 20.
- Cookson MR. The biochemistry of Parkinson's disease. Annu. Rev. Biochem. 2005;74:29–52. [PubMed: 15952880]
- 21.
- Winklhofer KF, Haass C. Mitochondrial dysfunction in Parkinson's disease. Biochim. Biophys. Acta. 2010;1802:29–44. [PubMed: 19733240]
- 22.
- Gellerich FN, Gizatullina Z, Nguyen HP, Trumbeckaite S, Vielhaber S, Seppet E, Zierz S, Landwehrmeyer B, Riess O, von Horsten S, Striggow F. Impaired regulation of brain mitochondria by extramitochondrial Ca2+ in transgenic Huntington disease rats. J. Biol. Chem. 2008;283:30715–30724. [PMC free article: PMC2662157] [PubMed: 18606820]
- 23.
- Lim D, Fedrizzi L, Tartari M, Zuccato C, Cattaneo E, Brini M, Carafoli E. Calcium homeostasis and mitochondrial dysfunction in striatal neurons of Huntington disease. J. Biol. Chem. 2008;283:5780–5789. [PubMed: 18156184]
- 24.
- Panov AV, Lund S, Greenamyre JT. Ca2+-induced permeability transition in human lymphoblastoid cell mitochondria from normal and Huntington's disease individuals. Mol. Cell. Biochem. 2005;269:143–152. [PubMed: 15786727]
- 25.
- Pasinelli P, Brown RH. Molecular biology of amyotrophic lateral sclerosis: insights from genetics. Nat. Rev. Neurosci. 2006;7:710–723. [PubMed: 16924260]
- 26.
- Grosskreutz J, Van Den Bosch L, Keller BU. Calcium dysregulation in amyotrophic lateral sclerosis. Cell Calcium. 2010;47:165–174. [PubMed: 20116097]
- 27.
- Karlsson J, Fong KS, Hansson MJ, Elmer E, Csiszar K, Keep MF. Life span extension and reduced neuronal death after weekly intraventricular cyclosporin injections in the G93A transgenic mouse model of amyotrophic lateral sclerosis. J. Neurosurg. 2004;101:128–137. [PubMed: 15255263]
- 28.
- Keep M, Elmer E, Fong KS, Csiszar K. Intrathecal cyclosporin prolongs survival of late-stage ALS mice. Brain. Res. 2001;894:327–331. [PubMed: 11251210]
- 29.
- Martin LJ. The mitochondrial permeability transition pore: a molecular target for amyotrophic lateral sclerosis therapy. Biochim. Biophys. Acta. 2010;1802:186–197. [PMC free article: PMC2790555] [PubMed: 19651206]
- 30.
- Noseworthy JH, Lucchinetti C, Rodriguez M, Weinshenker BG. Multiple sclerosis. N. Engl. J Med. 2000;343:938–952. [PubMed: 11006371]
- 31.
- Dutta R, Trapp BD. Mechanisms of neuronal dysfunction and degeneration in multiple sclerosis. Prog. Neurobiol. 2011;93:1–12. [PMC free article: PMC3030928] [PubMed: 20946934]
- 32.
- Su KG, Banker G, Bourdette D, Forte M. Axonal degeneration in multiple sclerosis: the mitochondrial hypothesis. Curr. Neurol. Neurosc.i Rep. 2009;9:411–7. [PMC free article: PMC2839873] [PubMed: 19664372]
- 33.
- Witte ME, Mahad DJ, Lassmann H, van Horssen J. Mitochondrial dysfunction contributes to neurodegeneration in multiple sclerosis. Trends Mol. Med. 2014;20:179–87. [PubMed: 24369898]
- 34.
- Forte M, Gold BG, Marracci G, Chaudhary P, Basso E, Johnsen D, Yu X, Fowlkes J, Rahder M, Stem K, Bernardi P, Bourdette D. Cyclophilin D inactivation protects axons in experimental encephalomyelitis, an animal model of multiple sclerosis. Proc. Natl. Acad. Sci. USA. 2007;104:7558–63. [PMC free article: PMC1857227] [PubMed: 17463082]
- 35.
- Camacho Vanegas O, Bertini E, Zhang RZ, Petrini S, Minosse C, Sabatelli P, Giusti B, Chu ML, Pepe G. Ullrich scleroatonic muscular dystrophy is caused by recessive mutations in collagen type VI. Proc. Natl. Acad. Sci. USA. 2001;98:7516–7521. [PMC free article: PMC34700] [PubMed: 11381124]
- 36.
- Jöbsis GJ, Keizers H, Vreijling JP, de Visser M, Speer MC, Wolterman RA, Baas F, Bolhuis PA. Type VI collagen mutations in Bethlem myopathy, an autosomal dominant myopathy with contractures. Nat. Genet. 1996;14:113–115. [PubMed: 8782832]
- 37.
- Irwin WA, Bergamin N, Sabatelli P, Reggiani C, Megighian A, Merlini L, Braghetta P, Columbaro M, Volpin D, Bressan GM, Bernardi P, Bonaldo P. Mitochondrial dysfunction and apoptosis in myopathic mice with collagen VI deficiency. Nat. Genet. 2003;35:267–271. [PubMed: 14625552]
- 38.
- Angelin A, Tiepolo T, Sabatelli P, Grumati P, Bergamin N, Golfieri C, Mattioli E, Gualandi F, Ferlini A, Merlini L, Maraldi NM, Bonaldo P, Bernardi P. Mitochondrial dysfunction in the pathogenesis of Ullrich congenital muscular dystrophy and prospective therapy with cyclosporins. Proc. Natl. Acad. Sci. USA. 2007;104:991–996. [PMC free article: PMC1783427] [PubMed: 17215366]
- 39.
- Merlini L, Angelin A, Tiepolo T, Braghetta P, Sabatelli P, Zamparelli A, Ferlini A, Maraldi NM, Bonaldo P, Bernardi P. Cyclosporin A corrects mitochondrial dysfunction and muscle apoptosis in patients with collagen VI myopathies. Proc. Natl. Acad. Sci. USA. 2008;105:5225–5229. [PMC free article: PMC2278179] [PubMed: 18362356]
- 40.
- Millay DP, Sargent MA, Osinska H, Baines CP, Barton ER, Vuagniaux G, Sweeney HL, Robbins J, Molkentin JD. Genetic and pharmacologic inhibition of mitochondrial-dependent necrosis attenuates muscular dystrophy. Nat. Med. 2008;14:442–447. [PMC free article: PMC2655270] [PubMed: 18345011]
- 41.
- Pellegrini C, Zulian A, Gualandi F, Manzati E, Merlini L, Michelini ME, Benassi L, Marmiroli S, Ferlini A, Sabatelli P, Bernardi P, Maraldi NM. Melanocytes-A novel tool to study mitochondrial dysfunction in Duchenne muscular dystrophy. J. Cell Physiol. 2013;228:1323–1331. [PMC free article: PMC3601437] [PubMed: 23169061]
- 42.
- Wissing ER, Millay DP, Vuagniaux G, Molkentin JD. Debio-025 is more effective than prednisone in reducing muscular pathology in mdx mice. Neuromuscul. Disord. 2010;20:753–760. [PMC free article: PMC2980760] [PubMed: 20637615]
- 43.
- Halestrap AP, Connern CP, Griffiths EJ, Kerr PM. Cyclosporin A binding to mitochondrial cyclophilin inhibits the permeability transition pore and protects hearts from ischaemia/reperfusion injury. Mol. Cell Biochem. 1997;174:167–712. [PubMed: 9309682]
- 44.
- Waldmeier PC, Feldtrauer J-J, Qian T, Lemasters JJ. Inhibition of the mitochondrial permeability transition by the nonimmunosuppresive cyclosporine derivative NIM811. Mol. Pharmacology. 2002;62:22–29. [PubMed: 12065751]
- 45.
- Azzolin L, Antolini N, Calderan A, Ruzza P, Sciacovelli M, Marin O, Mammi S, Bernardi P, Rasola A. Antamanide, a derivative of Amanita phallides, is a novel inhibitor of the mitochondrial permeability transition pore. PLoS ONE. 2011;6:e16280. [PMC free article: PMC3030572] [PubMed: 21297983]
- 46.
- Bognar Z, Kalai T, Palfi A, Hanto K, Bognar B, Mark L, Szabo Z, Tapodi A, Radnai B, Sarszegi Z, Szanto A, Gallyas F, Hideg K, Sumegi B, Varbiro G. A novel SOD-mimetic permeability transition inhibitor agent protects ischemic heart by inhibiting both apoptotic and necrotic cell death. Free Radical Biology & Medicine. 2006;41:835–848. [PubMed: 16895804]
- 47.
- Tian J, Li G, Liu Z, Fu F. Hydroxysafflor Yellow A inhibits rat brain mitochondrial permeability transition pores by a free radical scavenging action. Pharmacology. 2008;82:121–126. [PubMed: 18583922]
- 48.
- Fontaine E, Ichas F, Bernardi P. A ubiquinone-binding site regulates the mitochondrial permeability transition pore. J. Biol. Chem. 1998;273:25734–40. [PubMed: 9748242]
- 49.
- Walter L, Miyoshi H, Leverve X, Bernard P, Fontaine E. Regulation of the mitochondrial permeability transition pore by ubiquinone analogs. A progress report. Free Radic. Res. 2002;36:405–12. [PubMed: 12069104]
- 50.
- Williams L, Wu FY, Hamilton G. Mitochondrial permeability as a target for neurodegenerative disorders. Drugs of the Future. 2006;31:1083–1098.
- 51.
- Li B, Chauvin C, De Paulis D, De Oliveira F, Gharib A, Vial G, Lablanche S, Leverve X, Bernardi P, Ovize M, Fontaine E. Inhibition of complex I regulates the mitochondrial permeability transition through a phosphate-sensitive inhibitory site masked by cyclophilin D. Biochim. Biophys. Acta. 2012;1817:1628–1634. [PubMed: 22659400]
- 52.
- Schaller S, Paradis S, Ngoh GA, Assaly R, Buisson B, Drouot C, Ostuni MA, Lacapere JJ, Bassissi F, Bordet T, Berdeaux A, Jones SP, Morin D, Pruss RM. TRO40303, a new cardioprotective compound, inhibits mitochondrial permeability transition. J. Pharmacol. Exp. Ther. 2010;333:696–706. [PubMed: 20215409]
- 53.
- Šileikyte J, Blachly-Dyson E, Sewell R, Carpi A, Menabo R, Di Lisa F, Ricchelli F, Bernardi P, Forte M. Regulation of the Mitochondrial Permeability Transition Pore by the Outer Membrane does not Involve the Peripheral Benzodiazepine Receptor (TSPO). J. Biol. Chem. 2014. e-pub ahead of print. [PMC free article: PMC4022851] [PubMed: 24692541]
- 54.
- Sayeed I, Parvez S, Wali B, Siemen D, Stein DG. Direct inhibition of the mitochondrial permeability transition pore: a possible mechanism for better neuroprotective effects of allopregnanolone over progesterone. Brain Res. 2009;1263:165–173. [PubMed: 19368823]
- 55.
- Villareal F, Taub PR, Maisel AS, Schreiner GF, Murphy A, Yamazaki K, Ceballos G. US 2012/0095063 A1. Methods and compositions for treatment of ischemic conditions and conditions related to mitochondrial function. 2012
- 56.
- Chinopoulos C, Starkov AA, Fiskum G. Cyclosporin A-insensitive permeability transition in brain mitochondria: inhibition by 2-aminoethoxydiphenyl borate. J. Biol. Chem. 2003;278:27382–27389. [PubMed: 12750371]
- 57.
- Parvez S, Winkler-Stuck K, Hertel S, Schonfeld P, Siemen D. The dopamine-D2-receptor agonist ropinirole dose-dependently blocks the Ca2+-triggered permeability transition of mitochondria. Biochim. Biophys. Acta. 2010;1797:1245–1250. [PubMed: 20144882]
- 58.
- Ye R, Yang Q, Kong X, Li N, Zhang Y, Han J, Xiong L, Liu X, Zhao G. Sevoflurane preconditioning improves mitochondrial function and long-term neurologic sequelae after transient cerebral ischemia: role of mitochondrial permeability transition. Crit. Care Med. 2012;40:2685–2693. [PubMed: 22732280]
- 59.
- Henderson PJ, Lardy HA. Bongkrekic acid. An inhibitor of the adenine nucleotide translocase of mitochondria. J. Biol. Chem. 1970;245:1319–1326. [PubMed: 4245638]
- 60.
- Stavrovskaya IG, Narayanan MV, Zhang W, Krasnikov BF, Heemskerk J, Young SS, Blass JP, Brown AM, Beal MF, Friedlander RM, Kristal BS. Clinically approved heterocyclics act on a mitochondrial target and reduce stroke-induced pathology. The Journal of Experimental Medicine. 2004;200:211–222. [PMC free article: PMC2212009] [PubMed: 15263028]
- 61.
- Cesura AM, Pinard E, Schubenel R, Goetschy V, Friedlein A, Langen H, Polcic P, Forte MA, Bernardi P, Kemp JA. The voltage-dependent anion channel is the target for a new class of inhibitors of the mitochondrial permeability transition pore. J. Biol. Chem. 2003;278:49812–49818. [PubMed: 12952973]
- 62.
- Murasawa S, Iuchi K, Sato S, Noguchi-Yachide T, Sodeoka M, Yokomatsu T, Dodo K, Hashimoto Y, Aoyama H. Small-molecular inhibitors of Ca2+-induced mitochondrial permeability transition (MPT) derived from muscle relaxant dantrolene. Bioorg. Med. Chem. 2012;20:6384–6393. [PubMed: 23026083]
- 63.
- Kim YS, Jung SH, Park BG, Ko MK, Jang HS, Choi K, Baik JH, Lee J, Lee JK, Pae AN, Cho YS, Min SJ. Synthesis and evaluation of oxime derivatives as modulators for amyloid beta-induced mitochondrial dysfunction. Eur. J. Med. Chem. 2013;62:71–83. [PubMed: 23353734]
- 64.
- Pellicci P, Giorgio M, Minucci S, Bernardi P, Pain G, Martin S, Abingdon C, Yarnold CJ, Kraemer J. US 7,915,304 B2. Phenyl substituted maleimides as medicaments for blocking degenerative tissue damages by inhibiting MPT. 2008
- 65.
- Workman P, Collins I. Probing the probes: Fitness factors for small molecule tools. Chemistry & Biology. 2010;17:561–577. [PMC free article: PMC2905514] [PubMed: 20609406]
- 66.
- Giorgio V, von Stockum S, Antoniel M, Fabbro A, Fogolari F, Forte M, Glick GD, Petronilli V, Zoratti M, Szabó I, Lippe G, Bernardi P. Dimers of mitochondrial ATP synthase form the permeability transition pore. Proc. Natl. Acad. Sci. USA. 2013;110:5887–5892. [PMC free article: PMC3625323] [PubMed: 23530243]
- 67.
- Thomas VH, Bhattachar S, Hitchingham L, Zocharski P, Naath M, Surendran N, Stoner CL, El-Kattan A. The road map to oral bioavailability: an industrial perspective. Expert Opin. Drug Metab. Toxicol. 2006;2:591–608. [PubMed: 16859407]
- 68.
- Meanwell. Synopsis of some recent tactical applicaiton of bioisosteres in drug design. J. Med. Chem. 2011;54:2529–2591. [PubMed: 21413808]
- 69.
- St. Jean DJ Jr., Fotsch C. Mitigating heterocycle metabolism in drug discovery. J. Med. Chem. 2012;55:6002–6020. [PubMed: 22533875]
- 70.
- Walker JE. The ATP synthase: the understood, the uncertain and the unknown. Biochem Soc. Trans. 2013;41:1–16. [PubMed: 23356252]
- 71.
- Acehan D, Malhotra A, Xu Y, Ren M, Stokes DL, Schlame M. Cardiolipin affects the supramolecular organization of ATP synthase in mitochondria. Biophys. J. 2011;100:2184–92. [PMC free article: PMC3150712] [PubMed: 21539786]
- 72.
- Seelert H, Dencher NA. ATP synthase superassemblies in animals and plants: two or more are better. Biochim. Biophys. Acta. 2011;1807:1185–97. [PubMed: 21679683]
- 73.
- Davies KM, Anselmi C, Wittig I, Faraldo-Gomez JD, Kuhlbrandt W. Structure of the yeast F1Fo-ATP synthase dimer and its role in shaping the mitochondrial cristae. Proc. Natl. Acad. Sci. USA. 2012;109:13602–7. [PMC free article: PMC3427116] [PubMed: 22864911]
- 74.
- Dubinsky L, Krom B, Maijler M. Diazinine based photoaffinity labeling. Biorg. Med. Chem. 2012;20:554–57. [PubMed: 21778062]
- 75.
- MacKinnon AL, Taunton J. Target Identification by Diazirine Photo-Cross-linking and Click Chemistry. Curr. Protoc. Chem. Biol. 2009;1:55–73. [PMC free article: PMC3647699] [PubMed: 23667793]
Appendix A. Assay Summary Table
Table A1Summary of Assays and Performance sites
| Pub-Chem AID No. | Assay Format | Assay Target | Assay Name | Test Cmpd. Conc. Range (μM) | No. of cmpds. Tested | Performance Site(s) | Stage |
|---|---|---|---|---|---|---|---|
| 602491 | Summary | mtPTP | Summary assay for small molecule inhibitors of the mitochondrial permeability transition pore | NA | NA | SBCCG | NA |
| 602449 | Organelle-based | Mitochondrial Swelling | uHTS identification of small molecule inhibitors of the mitochondrial permeability transition pore via an absorbance assay | 10 | 363,827 | SBCCG | Primary Screen |
| 624504 | Organelle-based | Inner mt Membrane Potential | Single concentration confirmation of uHTS inhibitors hits of the mitochondrial permeability transition pore via a fluorescent based assay | 10 | 5,034 | SBCCG | Counter Screen |
| 651561 | Organelle-based | mt Swelling | Dose response confirmation of uHTS inhibitors hits of the mitochondrial permeability transition pore via an absorbance assay | 0.195 - 100 | 776 | SBCCG | Confirmatory Screen |
| 651564 | Organelle-based | Inner mt Membrane Potential | Dose response confirmation of uHTS inhibitors hits of the mitochondrial permeability transition pore via a fluorescent based counterscreen assay | 2.5 - 80 | 776 | SBCCG | Confirmatory Counter Screen |
| 720722 | Organelle-based | mt Swelling | Dry powder dose response confirmation of μHTS inhibitor hits of the mitochondrial permeability transition pore via an absorbance. Mitochondrial swelling (Hit Validation, Confirmatory Assay, Concentration-Response | 0.39 - 50 | 27 | Bernardi Lab | Hit Validation |
| 720723 | Organelle-based | Inner mt Membrane Potential | Dry powders dose response confirmation of μHTS inhibitor hits of the mitochondrial permeability transition pore via a fluorescent based counterscreen. Rhodamine 123 Quenching (Hit Validation, Counterscreen Assay, Concentration-Response | 0.78 - 100 | 27 | Bernardi Lab | Hit Validation |
| 720728 | Organelle-based | Ca Retention Capacity | Dry powder dose response confirmation uHTS inhibitor hits of the mitochondrial permeability transition pore via Calcium retention capacity test (Hit Validation, Confirmatory Assay, Concentration-Response | 0.39 - 50 | 27 | Bernardi Lab | Hit Validation |
| 743359 | Organelle-based | mt Swelling | Concentration-response assay to identify compounds that inhibit mitochondrial swelling | 0.39 - 50 | 101 | Bernardi Lab | SAR Study |
| 743361 | Organelle-based | Inner mt Membrane Potential | Concentration-response counterscreen assay to identify compounds that prevent mitochondrial swelling via interference with the IMM potential | 0.78 - 100 | 101 | Bernardi Lab | SAR Study |
| 743360 | Organelle-based | Calcium Retention Capacity | Calcium retention capacity assay to assess the propensity of the mtPTP to open as a function of test compound concentration | 0.39 - 50 | 101 | Bernardi Lab | SAR Study |
NA = Not Applicable
Appendix B. Detailed Assay Protocols
μHTS identification of small molecule inhibitors of the mitochondrial permeability transition pore via an absorbance assay (Primary Screening Assay, Single Concentration, AID 602449)
List of Reagents
- Assay Buffer: 250 mM sucrose, 10 mM MOPS-Tris, 0.01 mM EGTA-Tris, 1.0 mM phosphoric acid, pH 7.4
- Solution 1: 0.5 mg/mL mitochondria in Assay Buffer
- Solution 2: 2.0 mM EGTA-Tris, pH 7.4 in Solution 3
- Solution 3: 80-200 μM CaCl2 depending on mitochondrial activity, 5.0 mM glutamate, 2.5 mM malate in Assay Buffer Note: Concentration of calcium in the assay is dependent upon the activity of the isolated mitochondria which is determined via a calcium titration just before each high-throughput screening batch. A calcium concentration is used that allows for the arrival at a 2:1 window at the 30 minute time period.
Protocol Summary
- Compounds are pre-spotted into assay plates the morning of or the night before the assay. Via the LabCyte Echo, 16 nL of 5 mM compound is transferred to Greiner, 1536-well, clear assay plates (Greiner 782101) to achieve 10 μM in 8 μL assay final volume. To the control wells in Columns 1-4, 16 nL of DMSO is transferred.
- Prepare positive and negative control solutions, the mitochondrial suspension and the calcium solution working stocks according to the recipes in the Reagent Section.
- Upon determination of activity, freshly isolated mitochondria from mice are suspended in assay buffer (Solution 1) and 4 μL of this solution is added to all wells of the assay plate with a MultiDrop Combi. Final assay concentration of mitochondria will be about 0.25 mg/mL (Working Stock ∼0.5 mg/mL).
- Following the addition of the mitochondrial suspension, 4 μL of the positive control working stock containing 2.0 mM EGTA-Tris, pH 7.4 in assay buffer (Solution 2) is added to Columns 1-2. Final assay concentration = 1.0 mM EGTA-Tris, pH 7.4.
- Next, 4 μL of Calcium solution (Solution 3) is added to negative control and test compound wells, Columns 3-48. Final concentration of calcium will be 40-100 μM (80-200 μM in the working stock).
- Assay plate is immediately spun at 1000 rpm for ∼60 seconds.
- Plate is kept at room temperature for 30 minutes and then read on the BMG Pherastar utilizing absorbance at 540 nm.
Comments
Compounds that demonstrated a corrected % activity >= 50% compared to the controls are defined as active in the assay.
The experimental values were normalized by the difference between values from neutral and stimulator control wells in each plate. Then normalized data was corrected to remove systematic plate patterns due to artifacts such as dispensing tip issues etc. Further information about data correction is available at http://www.genedata.com/products/screener.html.
To simplify the distinction between the inactives of the primary screen and of the confirmatory screening stage, the Tiered Activity Scoring System was developed and implemented.
Activity Scoring
Activity scoring rules were devised to take into consideration compound efficacy, its potential interference with the assay and the screening stage that the data was obtained. Details of the Scoring System will be published elsewhere. Briefly, the outline of the scoring system utilized for the assay is as follows:
- First tier (0-40 range) is reserved for primary screening data. The score is correlated with % activity in the assay:
- If outcome of the primary screen is inactive, then the assigned score is 0
- If outcome of the primary screen is inconclusive, then the assigned score is 10
- If outcome of the primary screen is active, then the assigned score is 20
Scoring for Single concentration confirmation screening is not applicable to this assay.- d.
If outcome of the single-concentration confirmation screen is inactive, then the assigned score is 21
- e.
If outcome of the single-concentration confirmation screen is inconclusive, then the assigned score is 25
- f.
If outcome of the single-concentration confirmation screen is active, then the assigned score is 30
This scoring system helps track the stage of the testing of a particular SID. For the primary hits which are available for confirmation, their scores will be greater than 20. For those which are not further confirmed, their score will stay under 21. - Second tier (41-80 range) is reserved for dose-response confirmation data and is not applicable in this assay
- Third tier (81-100 range) is reserved for resynthesized true positives and their analogues and is not applicable in this assay
Single concentration confirmation of μHTS inhibitor hits of the mitochondrial permeability transition pore via a fluorescent based assay (Counterscreen Assay, Single Concentration, AID 624504)
List of Reagents
- Assay Buffer: 250 mM sucrose, 10 mM MOPS-Tris, 0.01 mM EGTA-Tris, 1.0 mM phosphoric acid, pH 7.4.
- Solution 1: 0.5 mg/mL mitochondria in Assay Buffer.
- Solution 2: 0.8 μM Rh123, 5.0 mM glutamate and 2.5 mM malate in Assay Buffer.
Protocol Summary
- Compounds are pre-spotted into assay plates the morning of or the night before the assay. Via a LabCyte Echo, 40 nL of 5 mM compound is transferred to a Greiner, 384-well, black assay plates (Greiner 781076) to achieve 10 μM in 20 μL final assay volume. To the positive control wells, 40 nL of 0.2 mM carbonyl cyanide 4-(trifluoromethoxy)phenylhydrazone (FCCP) is transferred. To the negative control wells, 40nl of DMSO is transferred.
- Prepare Assay Buffer, Rh123 Solution and the mitochondrial suspension working stocks according to the recipes in the Reagent Section.
- Freshly isolated mitochondria from mice are suspended in Assay Buffer (Solution 1) and 10 μL of this solution is added to all wells of the assay plate with a MultiDrop Combi. Final assay concentration of mitochondria will be about 0.25 mg/mL (Working Stock ∼0.5 mg/mL), depending on relative activity of mitochondrial preparation.
- Following the addition of the mitochondrial suspension, 10 μL of Rh123 Solution (Solution 2) is added to each well of the assay plate.
- Assay plate is immediately spun at 1000 rpm for ∼60 seconds.
- Plate is kept at room temperature for 5 minutes and then read on the BMG Pherastar utilizing a fluorescence intensity optical module that allows for excitation at 480 nm and a read at an emission wavelength of 520 nm.
Comments
Compounds that demonstrated a % activity_mean >= 20% compared to the controls are defined as active in the assay.
To simplify the distinction between the inactives of the primary screen and of the confirmatory screening stage, the Tiered Activity Scoring System was developed and implemented.
Activity Scoring
Activity scoring rules were devised to take into consideration compound efficacy, its potential interference with the assay and the screening stage that the data was obtained. Details of the Scoring System will be published elsewhere. Briefly, the outline of the scoring system utilized for the assay is as follows:
- First tier (0-40 range) is reserved for primary screening data. The score is correlated with % activity in the assay. Scoring for the primary screening is not applicable to this assay.
- If outcome of the primary screen is inactive, then the assigned score is 0
- If outcome of the primary screen is inconclusive, then the assigned score is 10
- If outcome of the primary screen is active, then the assigned score is 20
Scoring for Single concentration confirmation screening is applicable to this assay.- d.
If outcome of the single-concentration confirmation screen is inactive, then the assigned score is 21
- e.
If outcome of the single-concentration confirmation screen is inconclusive, then the assigned score is 25
- f.
If outcome of the single-concentration confirmation screen is active, then the assigned score is 30
This scoring system helps track the stage of the testing of a particular SID. For the primary hits which are available for confirmation, their scores will be greater than 20. For those which are not further confirmed, their score will stay under 21. - Second tier (41-80 range) is reserved for dose-response confirmation data and is not applicable in this assay
- Third tier (81-100 range) is reserved for resynthesized true positives and their analogues and is not applicable in this assay
Dose response confirmation of μHTS inhibitor hits of the mitochondrial permeability transition pore via an absorbance assay (Confirmatory Assay, Concentration-Response, AID 651561)
List of Reagents
- Assay Buffer: 250 mM sucrose, 10 mM MOPS-Tris, 0.01 mM EGTA-Tris, 1.0 mM phosphoric acid, pH 7.4
- Solution 1: 200 μg/mL mitochondria in Assay Buffer
- Solution 2: 2.0 mM EGTA-Tris, pH 7.4 in Solution 3
- Solution 3: 80-200 μM CaCl2 depending on mitochondrial activity, 5.0 mM glutamate, 2.5 mM malate in Assay Buffer Note: Concentration of calcium in the assay is dependent upon the activity of the isolated mitochondria which is determined via a calcium titration just before each high-throughput screening batch. A calcium concentration is used that allows for the arrival at a 2:1 window at the 30 minute time period.
Protocol Summary
- Compounds are pre-spotted into assay plates the morning of or the night before the assay. Via the LabCyte Echo, varying volumes of 10 mM test compounds in DMSO are transferred to a Greiner, 1536-well, clear assay plates (Greiner 782101) to achieve appropriate test volume concentrations and range. Varying volumes of DMSO are transferred to the wells of the assay plate to equilibrate it's concentration between wells for a total volume of 64 nL of DMSO per well or 0.8% final assay concentration. Positive and negative control wells will also contain 64 nL of DMSO.
- Prepare positive and negative control solutions, the mitochondrial suspension and the calcium solution working stocks according to the recipes in the Reagent Section.
- Freshly isolated mitochondria from mice are suspended in assay buffer (Solution 1) and 4 μL of this solution is added to all wells of the assay plate with a MultiDrop Combi. Final assay concentration of mitochondria will be about 0.25 mg/mL (Working Stock ∼0.5 mg/mL) depending on the relative activity of each batch of mitochondrial preparation.
- Following the addition of the mitochondrial suspension, 4 μL of the positive control working stock containing 2.0 mM EGTA-Tris, pH 7.4 in assay buffer (Solution 2) is added to Columns 1-2. Final assay concentration = 1.0 mM EGTA-Tris, pH 7.4.
- Next, 4 μL of Calcium solution (Solution 3) is added to negative control and test compound wells, Columns 3-48. Final concentration of calcium will be 40-100 μM (80-200 μM in the working stock) depending on mitochondrial activity.
- Assay plate is immediately spun at 1000 rpm for ∼60 seconds.
- Plate is kept at room temperature for 30 minutes and then read on the BMG Pherastar utilizing absorbance at 540 nm.
Comments
Compounds that demonstrated an EC50 of 20 μM or less are defined as active in this assay.
To simplify the distinction between the inactives of the primary screen and of the confirmatory screening stage, the Tiered Activity Scoring System was developed and implemented.
Activity Scoring
Activity scoring rules were devised to take into consideration compound efficacy, its potential interference with the assay and the screening stage that the data was obtained. Details of the Scoring System will be published elsewhere. Briefly, the outline of the scoring system utilized for the assay is as follows:
- First tier (0-40 range) is reserved for primary screening data. The score is correlated with % activity in the assay. Scoring for the primary screening is not applicable to this assay.
- Second tier (41-80 range) is reserved for dose-response confirmation data
- Inactive compounds of the confirmatory stage are assigned a score value equal 41.
- The score is linearly correlated with a compound's potency and, in addition, provides a measure of the likelihood that the compound is not an artifact based on the available information.
- The Hill coefficient is taken as a measure of compound behavior in the assay via an additional scaling factor QC:QC = 2.6*[exp(-0.5*nHˆ2) - exp(-1.5*nHˆ2)]This empirical factor prorates the likelihood of target- or pathway-specific compound effect vs. its non-specific behavior in the assay. This factor is based on expectation that a compound with a single mode of action that achieved equilibrium in the assay demonstrates the Hill coefficient value of 1. Compounds deviating from that behavior are penalized proportionally to the degree of their deviation.
- Summary equation that takes into account all the items discussed isScore = 44 + 6*(pIC50-3)*QC,Where pIC50 is a negative log(10) of the IC50 value expressed in mole/L concentration units. This equation results in the Score values above 50 for compounds that demonstrate high potency and predictable behavior. Compounds that are inactive in the assay or whose concentration-dependent behavior are likely to be an artifact of that assay will generally have lower Score values.
- Third tier (81-100 range) is reserved for resynthesized true positives and their analogues and is not applicable in this assay
Dose response confirmation of μHTS inhibitor hits of the mitochondrial permeability transition pore via a fluorescent based counterscreen assay (Counterscreen Assay, Concentration-Response, AID 651564)
List of Reagents
- Assay Buffer: 250 mM sucrose, 10 mM MOPS-Tris, 0.01 mM EGTA-Tris, 1.0 mM phosphoric acid, pH 7.4.
- Solution 1: 0.5 mg/mL mitochondria in Assay Buffer.
- Solution 2: 0.8 μM Rh123, 5.0 mM glutamate and 2.5 mM malate in Assay Buffer.
Protocol Summary
- Compounds are pre-spotted into assay plates the morning of or the night before the assay. Via the LabCyte Echo, varying volumes of 10 mM test compounds in DMSO are transferred to a Greiner, 1536-well, clear assay plates (Greiner 782101) to achieve appropriate test volume concentrations and range. Varying volumes of DMSO are transferred to the wells of the assay plate to equilibrate it's concentration between wells for a total volume of 64 nL of DMSO per well or 0.8% final assay concentration. Positive and negative control wells will also contain 64 nL of DMSO.
- Prepare Assay Buffer, Rh123 Solution and the mitochondrial suspension working stocks according to the recipes in the Reagent Section.
- Freshly isolated mitochondria from mice are suspended in Assay Buffer (Solution 1) and 10 μL of this solution is added to all wells of the assay plate with a MultiDrop Combi. Final assay concentration of mitochondria will be about 0.25 mg/mL (Working Stock ∼0.5 mg/mL), depending on relative activity of mitochondrial preparation.
- Following the addition of the mitochondrial suspension, 10 μL of Rh123 Solution (Solution 2) is added to each well of the assay plate.
- Assay plate is immediately spun at 1000 rpm for ∼60 seconds.
- Plate is kept at room temperature for 5 minutes and then read on the BMG Pherastar utilizing a fluorescence intensity optical module that allows for excitation at 480 nm and a read at an emission wavelength of 520 nm.
Comments
Compounds that demonstrated an EC50 of 80 μM or less are defined as active in this assay.
To simplify the distinction between the inactives of the primary screen and of the confirmatory screening stage, the Tiered Activity Scoring System was developed and implemented.
Activity Scoring
Activity scoring rules were devised to take into consideration compound efficacy, its potential interference with the assay and the screening stage that the data was obtained. Details of the Scoring System will be published elsewhere. Briefly, the outline of the scoring system utilized for the assay is as follows:
- First tier (0-40 range) is reserved for primary screening data and is not applicable in this assay
- Second tier (41-80 range) is reserved for dose-response confirmation data
- Inactive compounds of the confirmatory stage are assigned a score value equal 41.
- The score is linearly correlated with a compound's potency and, in addition, provides a measure of the likelihood that the compound is not an artifact based on the available information.
- The Hill coefficient is taken as a measure of compound behavior in the assay via an additional scaling factor QC:QC = 2.6*[exp(-0.5*nHˆ2) - exp(-1.5*nHˆ2)]This empirical factor prorates the likelihood of target- or pathway-specific compound effect vs. its non-specific behavior in the assay. This factor is based on expectation that a compound with a single mode of action that achieved equilibrium in the assay demonstrates the Hill coefficient value of 1. Compounds deviating from that behavior are penalized proportionally to the degree of their deviation.
- Summary equation that takes into account all the items discussed isScore = 44 + 6*(pIC50-3)*QC,Where pIC50 is a negative log(10) of the IC50 value expressed in mole/L concentration units. This equation results in the Score values above 50 for compounds that demonstrate high potency and predictable behavior. Compounds that are inactive in the assay or whose concentration-dependent behavior are likely to be an artifact of that assay will generally have lower Score values.
- Third tier (81-100 range) is reserved for resynthesized true positives and their analogues and is not applicable in this assay
Dry powder dose response confirmation of μHTS inhibitor hits of the mitochondrial permeability transition pore via an absorbance. Mitochondrial swelling (Hit Validation, Confirmatory Assay, Concentration-Response, AID 720722)
List of Reagents
- Assay buffer: 250 mM sucrose, 10 mM MOPS-Tris, 0.01 mM EGTA-Tris, 1.0 mM phosphoric acid, pH 7.4
- Solution 1. 5.0 mM glutamate and 2.5 mM malate in Assay buffer.
- Solution2. 100 μM CaCl2 depending on mitochondrial activity in Solution1. Note: Concentration of Ca2+ in the assay is dependent upon the activity of the isolated mitochondria which is determined via a calcium titration just before each screening batch. A Ca2+ concentration is used that allows for the arrival at a 2:1 window at the 20 minute time period.
- Solution 3. 1% DMSO in Solution 2.
- Solution 4. 2.0 mM EGTA-Tris, pH 7.4 in Solution 3.
- Solution 5. 0.5 mg/ml mitochondria in Assay Buffer.
Protocol Summary
- Freshly isolate mitochondria, prepare solutions according to the recipes in the reagent section
- Dispense 100 μL of Solution 4 to Columns 1-2 and Solution 3 Columns 11-12 (positive and negative controls, respectively) of the 96-well clear assay plate (Falcon 353072)
- Dispense 200 μL of Solution 1 to Row A Columns 3-10.
- Next, dispense 100 μL of Solution 3 to Rows B-H Columns 3-10.
- Add 4 μl of 5 mM test compounds in DMSO to Row A Columns 3-10, perform 1:2 serial dilutions Row A to H Columns 3-10.
- Finally, dispense 100 μL of Solution 5 in all wells. The reaction starts.
- Keep the plate at room temperature for 20 minutes and then read absorbance at 540 nm on MultiSkan EX, Thermo Scientific.
Comments
Compounds that demonstrated an EC50 of 20 μM or less are defined as active in this assay.
To simplify the distinction between the inactive compounds of the primary screen and of the confirmatory screening stage, the Tiered Activity Scoring System was developed and implemented.
Activity Scoring
Activity scoring rules were devised to take into consideration compound efficacy, its potential interference with the assay and the screening stage that the data was obtained. Details of the Scoring System will be published elsewhere. Briefly, the outline of the scoring system utilized for the assay is as follows:
- First tier (0-40 range) is reserved for primary screening data and is not applicable in this assay
- Second tier (41-80 range) is reserved for dose-response confirmation data and is not applicable in this assay.
- Third tier (81-100 range) is reserved for resynthesized true positives and their analogues.
- Compounds that failed to reproduce from dry powder or have IC50 > 20 M are assigned inactive and a score value of 81.
- The score is linearly correlated with a compound's potency and, in addition, provides a measure of the likelihood that the compound is not an artifact based on the available information. The Hill coefficient is taken as a measure of compound behavior in the assay via an additional scaling factor QC:QC = 2.6*[exp(-0.5*nH;2) - exp(-1.5*nH;2)]This empirical factor prorates the likelihood of a target- or a pathway-specific compound effect vs. its non-specific behavior in the assay. This factor is based on the expectation that a compound with a single mode of action that achieved an equilibrium in the assay would demonstrate the Hill coefficient value of 1. Compounds deviating from that behavior are penalized proportionally to the degree of their divergence.
- The score is calculated using the following equation:Score = 82+3*(pIC50-3)*QC,where pIC50 is a negative log(10) of the IC50 value expressed in mole/L concentration units, and QC is calculated using Hill coefficient. This equation results in the Score values above 85 for compounds that demonstrate high potency and predictable behavior in the assays.
Dry powders dose response confirmation of μHTS inhibitor hits of the mitochondrial permeability transition pore via a fluorescent based counterscreen. Rhodamine 123 Quenching (Hit Validation, Counterscreen Assay, Concentration-Response, AID 720723)
List of Reagents
- Assay buffer: 250 mM sucrose, 10 mM MOPS-Tris, 0.01 mM EGTA-Tris, 1.0 mM phosphoric acid, pH 7.4
- Solution 1. 5.0 mM glutamate and 2.5 mM malate in Assay Buffer.
- Solution 2. 1% DMSO in Solution 1.
- Solution 3. 0.8 μM FCCP (the stock 40 μM in DMSO) in Solution 1.
- Solution 4. 0.5 mg/ml mitochondria and 0.8 μM Rh123 in Assay Buffer.
Protocol Summary
- Freshly isolate mitochondria, prepare solutions according to the recipes in the Reagent Section.
- Dispense 100 μL of Solution 3 to Columns 1-2 and Solution 2 Columns 11-12 (positive and negative controls, respectively) of the 96-well black assay plate (Falcon 353376).
- Dispense 200 μL of Solution 1 to Row A Columns 3-10.
- Next, dispense 100 μL of Solution 2 to Rows B-H Columns 3-10.
- Add 4 μL of 10 mM test compounds in DMSO to Row A Columns 3-10, perform 1:2 serial dilutions Row A to H Columns 3-10.
- Finally, dispense 100 μL of Solution 4 in all wells. The reaction starts.
- Keep the plate at room temperature for 5 minutes and then read fluorescence (excitation 485 nm, emission 538 nm) on Fluoroscan Ascent FL, Thermo Scientific.
Comments
Compounds that demonstrated an EC50 of 100 μM or less are defined as active in this assay.
To simplify the distinction between the inactives of the primary screen and of the confirmatory screening stage, the Tiered Activity Scoring System was developed and implemented.
Activity Scoring
Activity scoring rules were devised to take into consideration compound efficacy, its potential interference with the assay and the screening stage that the data was obtained. Details of the Scoring System will be published elsewhere. Briefly, the outline of the scoring system utilized for the assay is as follows:
- First tier (0-40 range) is reserved for primary screening data and is not applicable in this assay
- Second tier (41-80 range) is reserved for dose-response confirmation data and is not applicable in this assay.
- Third tier (81-100 range) is reserved for resynthesized true positives and their analogues.
- Compounds that failed to reproduce from dry powder or have IC50 > 100 M are assigned inactive and a score value of 81.
- The score is linearly correlated with a compound's potency and, in addition, provides a measure of the likelihood that the compound is not an artifact based on the available information. The Hill coefficient is taken as a measure of compound behavior in the assay via an additional scaling factor QC:QC = 2.6*[exp(-0.5*nH;2) - exp(-1.5*nH;2)]This empirical factor prorates the likelihood of a target- or a pathway-specific compound effect vs. its non-specific behavior in the assay. This factor is based on the expectation that a compound with a single mode of action that achieved an equilibrium in the assay would demonstrate the Hill coefficient value of 1. Compounds deviating from that behavior are penalized proportionally to the degree of their divergence.
- The score is calculated using the following equation:Score = 82+3*(pIC50-3)*QC,where pIC50 is a negative log(10) of the IC50 value expressed in mole/L concentration units, and QC is calculated using Hill coefficient. This equation results in the Score values above 85 for compounds that demonstrate high potency and predictable behavior in the assays.
Dry powder dose response confirmation μHTS inhibitor hits of the mitochondrial permeability transition pore via Calcium retention capacity test (Hit Validation, Confirmatory Assay, Concentration-Response, AID 720728)
List of Reagents
- Assay buffer: 250 mM sucrose, 10 mM MOPS-Tris, 0.01 mM EGTA-Tris, 1.0 mM Pi-Tris, pH 7.4.
- Solution 1. 10 mM glutamate and 5 mM malate in Assay buffer.
- Solution 2. 1% DMSO in Solution 2.
- Solution 3. 0.5 mg/ml mitochondria and 1.0 μM Calcium Green-5N in Assay Buffer.
- Solution 4. 0.25 mM CaCl2.
Protocol Summary
- Freshly isolate mitochondria, prepare solutions according to the recipes in the Reagent Section.
- Dispense 100 μL of Solution 2 to Columns 1-2 (negative control) of the 96-well black assay plate (Falcon 353376).
- Dispense 200 μL of Solution 1 to Row A Columns 3-12.
- Next, dispense 100 μL of Solution 2 to Rows B-H Columns 3-12.
- Add 4 μl of 5 mM test compounds in DMSO to Row A Columns 3-12, perform 1:2 serial dilutions Row A to H Columns 3-12.
- Finally, dispense 100 μL of Solution 3 in all wells.
- Experiment starts. Read Calcium Green-5N fluorescence (excitation 485 nm, emission 538 nm) and perform a train of 4 μL Solution 4 additions with Fluoroscan Ascent FL, Thermo Scientific.
Comments
Compounds that demonstrated a CRC/CRC0 of above 1.1 at 12.5 μM are defined as active in this assay.
Concentration-response assay to identify compounds that inhibit mitochondrial swelling (SAR Assay AID 743359)
List of Reagents
- Assay buffer: 250 mM sucrose, 10 mM MOPS-Tris, 0.01 mM EGTA-Tris, 1.0 mM phosphoric acid, pH 7.4
- Solution 1. 5.0 mM glutamate and 2.5 mM malate in Assay Buffer.
- Solution2. 100 μM CaCl2 depending on mitochondrial activity in Solution1. Note: Concentration of Ca2+ in the assay is dependent upon the activity of the isolated mitochondria which is determined via a calcium titration just before each screening batch. A Ca2+ concentration is used that allows for the arrival at a 2:1 window at the 20 minute time period.
- Solution 3. 1% DMSO in Solution 2.
- Solution 4. 2.0 mM EGTA-Tris, pH 7.4 in Solution 3.
- Solution 5. 0.5 mg/ml mitochondria in Assay Buffer.
Protocol Summary
- Freshly isolate mitochondria, prepare solutions according to the recipes in the Reagent Section.
- Dispense 100 μL of Solution 4 to Columns 1-2 and Solution 3 Columns 11-12 (positive and negative controls, respectively) of the 96-well clear assay plate (Falcon 353072).
- Dispense 200 μL of Solution 1 to Row A Columns 3-10.
- Next, dispense 100 μl of Solution 3 to Rows B-H Columns 3-10.
- Add 4 μl of 5 mM test compounds in DMSO to Row A Columns 3-10, perform 1:2 serial dilutions Row A to H Columns 3-10.
- Finally, dispense 100 μL of Solution 5 in all wells. The reaction starts.
- Keep the plate at room temperature for 20 minutes and then read absorbance at 540 nm on MultiSkan EX, Thermo Scientific.
Comments
Compounds that demonstrated an EC50 of 20 μM or less are defined as active in this assay.
To simplify the distinction between the inactives of the primary screen and of the confirmatory screening stage, the Tiered Activity Scoring System was developed and implemented.
Activity Scoring
Activity scoring rules were devised to take into consideration compound efficacy, its potential interference with the assay and the screening stage that the data was obtained. Details of the Scoring System will be published elsewhere. Briefly, the outline of the scoring system utilized for the assay is as follows:
- First tier (0-40 range) is reserved for primary screening data and is not applicable in this assay
- Second tier (41-80 range) is reserved for dose-response confirmation data and is not applicable in this assay.
- Third tier (81-100 range) is reserved for resynthesized true positives and their analogues.
- Compounds that failed to reproduce from dry powder or have IC50 > 20 M are assigned inactive and a score value of 81.
- The score is linearly correlated with a compound's potency and, in addition, provides a measure of the likelihood that the compound is not an artifact based on the available information. The Hill coefficient is taken as a measure of compound behavior in the assay via an additional scaling factor QC:QC = 2.6*[exp(-0.5*nH;2) - exp(-1.5*nH;2)]This empirical factor prorates the likelihood of a target- or a pathway-specific compound effect vs. its non-specific behavior in the assay. This factor is based on the expectation that a compound with a single mode of action that achieved an equilibrium in the assay would demonstrate the Hill coefficient value of 1. Compounds deviating from that behavior are penalized proportionally to the degree of their divergence.
- The score is calculated using the following equation:Score = 82+3*(pIC50-3)*QC,where pIC50 is a negative log(10) of the IC50 value expressed in mole/L concentration units, and QC is calculated using Hill coefficient. This equation results in the Score values above 85 for compounds that demonstrate high potency and predictable behavior in the assays.
Concentration-response counterscreen assay to identify compounds that prevent mitochondrial swelling via interference with the IMM potential (SAR Assay AID 743361)
List of Reagents
- Assay buffer: 250 mM sucrose, 10 mM MOPS-Tris, 0.01 mM EGTA-Tris, 1.0 mM phosphoric acid, pH 7.4
- Solution 1. 5.0 glutamate and 2.5 mM malate in Assay Buffer.
- Solution 2. 1% DMSO in Solution 1.
- Solution 3. 0.8 μM FCCP (the stock 40 μM in DMSO) in Solution 1.
- Solution 4. 0.5 mg/ml mitochondria and 0.8 μM Rh123 in Assay Buffer.
Protocol Summary
- Freshly isolate mitochondria, prepare solutions according to the recipes in the Reagent Section.
- Dispense 100 μL of Solution 3 to Columns 1-2 and Solution 2 Columns 11-12 (positive and negative controls, respectively) of the 96-well black assay plate (Falcon 353376).
- Dispense 200 μL of Solution 1 to Row A Columns 3-10.
- Next, dispense 100 μl of Solution 2 to Rows B-H Columns 3-10.
- Add 4 μL of 10 mM test compounds in DMSO to Row A Columns 3-10, perform 1:2 serial dilutions Row A to H Columns 3-10.
- Finally, dispense 100 μL of Solution 4 in all wells. The reaction starts.
- Keep the plate at room temperature for 5 minutes and then read fluorescence (excitation 485 nm, emission 538 nm) on Fluoroscan Ascent FL, Thermo Scientific.
Comments
Compounds that demonstrated an EC50 of 80 μM or less are defined as active in this assay.
To simplify the distinction between the inactives of the primary screen and of the confirmatory screening stage, the Tiered Activity Scoring System was developed and implemented.
Activity Scoring
Activity scoring rules were devised to take into consideration compound efficacy, its potential interference with the assay and the screening stage that the data was obtained. Details of the Scoring System will be published elsewhere. Briefly, the outline of the scoring system utilized for the assay is as follows:
- First tier (0-40 range) is reserved for primary screening data and is not applicable in this assay
- Second tier (41-80 range) is reserved for dose-response confirmation data and is not applicable in this assay.
- Third tier (81-100 range) is reserved for resynthesized true positives and their analogues.
- Compounds that failed to reproduce from dry powder or have EC50 > 100 M are assigned inactive and a score value of 81.
- The score is linearly correlated with a compound's potency and, in addition, provides a measure of the likelihood that the compound is not an artifact based on the available information. The Hill coefficient is taken as a measure of compound behavior in the assay via an additional scaling factor QC:QC = 2.6*[exp(-0.5*nH;2) - exp(-1.5*nH;2)]This empirical factor prorates the likelihood of a target- or a pathway-specific compound effect vs. its non-specific behavior in the assay. This factor is based on the expectation that a compound with a single mode of action that achieved an equilibrium in the assay would demonstrate the Hill coefficient value of 1. Compounds deviating from that behavior are penalized proportionally to the degree of their divergence.
- The score is calculated using the following equation:Score = 82+3*(pIC50-3)*QC,where pIC50 is a negative log(10) of the IC50 value expressed in mole/L concentration units, and QC is calculated using Hill coefficient. This equation results in the Score values above 85 for compounds that demonstrate high potency and predictable behavior in the assays.
Calcium retention capacity assay to assess the propensity of the mtPTP to open as a function of test compound concentration (SAR Assay AID 743360)
List of Reagents
- Assay buffer: 250 mM sucrose, 10 mM MOPS-Tris, 0.01 mM EGTA-Tris, 1.0 mM phosphoric acid-Tris, pH 7.4.
- Solution 1. 10 mM glutamate and 5 mM malate in Assay buffer.
- Solution 2. 1% DMSO in Solution 2.
- Solution 3. 0.5 mg/ml mitochondria and 1.0 μM Calcium Green-5N in Assay Buffer.
- Solution 4. 0.25 mM CaCl2.
Protocol Summary
- Freshly isolate mitochondria, prepare solutions according to the recipes in the Reagent Section.
- Dispense 100 μL of Solution 2 to Columns 1-2 (negative control) of the 96-well black assay plate (Falcon 353376).
- Dispense 200 μL of Solution 1 to Row A Columns 3-12.
- Next, dispense 100 μL of Solution 2 to Rows B-H Columns 3-12.
- Add 4 μl of 5 mM test compounds in DMSO to Row A Columns 3-12, perform 1:2 serial dilutions Row A to H Columns 3-12.
- Finally, dispense 100 μL of Solution 3 in all wells.
- Experiment starts. Read Calcium Green-5N fluorescence (excitation 485 nm, emission 538 nm) and perform a train of 4 μL Solution 4 additions with Fluoroskan Ascent FL, Thermo Scientific.
Comments
Compounds that demonstrated a CRC/CRC0 of above 1.1 at 12.5 μM are defined as active in this assay.
(Figure 3.1.1., D, E) Calcium Retention Capacity of Permeabilized Cells
Cell growth and permeabilization
HeLa and MEF cells were cultured in Dulbecco's Modified Eagle Medium (Gibco) in the presence of 10 % Fetal Bovine Serum and 1 % penicillin-streptomycin for 48 hours to reach a 70-80 % confluency. On the day of the experiment cells were harvest, suspended in 130 mM KCl, 10 MOPS-Tris, 1 mM phosphoric acid-Tris, 1 mM EGTA-Tris, pH 7.4 to give a concentration of 20 million/ml, and treated with 100 μM digitonin (Calbiochem) for 10 min on ice to permeabilize the plasma membrane. Cells were then washed twice and resuspended in the above buffer except that 100 μM EGTA-Tris was used.
List of Reagents
- Assay Buffer: 130 mM KCl, 10 MOPS-Tris, 1 mM phosphoric acid-Tris, 10 μM EGTA-Tris, pH 7.4
- Solution 1. 10 mM glutamate and 5 mM malate in Assay Buffer.
- Solution 2. 1% DMSO in Solution 2.
- Solution 3. 1.6 million/ml cells and 1.0 μM Calcium Green-5N in Assay Buffer.
- Solution 4. 0.5 mM CaCl2.
Protocol Summary
- Harvest and permeabilize the cells according to the previous instructions.
- Dispense 100 μL of Solution 2 to Columns 1-2 (negative control) of the 96-well black assay plate (Falcon 353376).
- Dispense 200 μL of Solution 1 to Row A Columns 3-12.
- Next, dispense 100 μL of Solution 2 to Rows B-H Columns 3-12.
- Add 4 μl of 5 mM test compounds in DMSO to Row A Columns 3-12, perform 1:2 serial dilutions Row A to H Columns 3-12.
- Finally, dispense 100 μL of Solution 3 in all wells.
- Experiment starts. Read Calcium Green-5N fluorescence (excitation 485 nm, emission 538 nm) and perform a train of 4 μL Solution 4 additions with Fluoroskan Ascent FL, Thermo Scientific.
(Figure 3.1.1., F) HeLa Cell Viability Assay
HeLa cells were plated in a 96-well plate at 1800 cells/well and treated with ML404 for 72 hours over a 9 point 2-fold dilution series, ranging from 0.78 μM to 200 μM. Following 72 hours of treatment, relative viable cell number was determined using CellTiter 96® AQueous One Solution Cell Proliferation Assay from Promega. Each ML404 treatment was performed in 8- while DMSO treatment in 16- replicates, the latter ones serving as positive controls.
Appendix C. Analytical Characterization Data for the Probe
%20of%20the%20Probe%20CID72199308%2C%20KSC-392-065.&p=BOOKS&id=280049_ml404f9.jpg "Click on image to zoom")
1H NMR Spectrum (400 MHz, Acetone-d6) of the Probe CID72199308, KSC-392-065
13C NMR (101 MHz, Acetone-d6) δ 172.82, 160.59, 159.11, 158.03, 151.30, 137.76, 132.82, 132.07, 131.58, 130.67, 128.96, 126.42, 124.48, 119.08, 118.30, 113.52, 100.39, 17.49.

UPLC-MS Chromatogram
HRMS calcd for (C17H13ClN2O3 −[H])–: 327.0542, found: 327.0538.
Appendix D. Experimental Procedures for Physiochemcial and In Vitro Pharmacokinetic Property Assays
Aqueous Solubility: Solubility analysis was performed using a direct UV kinetic solubility method in a 96-well format. All liquid dispense and transfer steps were performed with the Freedom Evo automated liquid handler (Tecan US). Solubility measurements were performed in an aqueous buffer solution (System Solution, pION Inc, P/N 110151) at pH 5.0, 6.2 and 7.4, in duplicate. Samples were incubated at room temperature for a minimum of 18 hrs to achieve equilibrium, then filtered (filter plate, pION Inc, P/N 110322) to remove any precipitate formed. The concentration of the compounds was measured by UV absorbance (250-498 nm) using the Infinite M200 (Tecan US) and compared to the spectra of the precipitation-free reference solutions. Spectroscopically pure 1-Propanol (Sigma P/N 256404) was used as a cosolvent to suppress precipitation in the reference solutions. The solubility of each compound was determined using μSOL Evolution Plus software v3.2 (pION Inc) and is expressed as the concentration (μg/mL) of a solute in a saturated solution.
Assay details
- Diclofenac Na and Dipyridamole were used as standards. Diclofenac Na is highly soluble. Dipyridamole is poorly to moderately soluble.
- Standards and test compound stocks were made in 100% DMSO
- Assay concentration of standards: 500 μM and test compound: 300 μM
- Cosolvent used in the reference solution to suppress precipitation: 1-Propanol
- Assay DMSO final concentration: 1%
Aqueous and Thiol Stability: Compound was dissolved at 10 μM in 1:1 ACN:PBS and incubated at room temperature with either no thiol source as a negative control, 50 μM glutathione (GSH), or 50 μM dithiothreitol (DTT). The mixtures were sampled every hour for eight hours or every 8 hours for 88 hours and analyzed by RP HPLC/UV/HRMS. The analytical RP HPLCUV/HRMS system utilized for the analysis was a Waters Acquity system with UV-detection and mass-detection (Waters SQD). The analytical method conditions included a Waters Acquity HSS Atlantis C18 column (2.1 × 50mm, 1.8um) and elution with a linear gradient of 99% water to 100% CH3CN at 0.6 mL/min flow rate. Peaks on the 214 nm chromatographs were integrated using the Waters OpenLynx software. Absolute areas under the curve were compared at each time point to determine relative percent compound remaining. The masses of potential adducts were searched for in the final samples to determine if any detectable adduct formed. All samples were prepared in duplicate and the average plotted. Ethacrynic acid, a known Michael acceptor, was used as a positive control.
Plasma Stability: Stability of the compound in human plasma (BioChemed Services, P/N 752PR-EK3-PMG) was determined. All liquid dispense and transfer steps were performed with the Freedom Evo automated liquid handler (Tecan US). Plasma was allowed to thaw at room temperature prior to preparing the assay solution of plasma:1× PBS (1:1). The assay solution was warmed up at 37 °C prior of adding the compound. Immediately after compounds were added, time 0 min aliquots were promptly collected and mixed with cold acetonitrile (spiked with an internal standard). The remainder of the reaction volume was incubated at 37 °C with shaking. Additional aliquots were collected 180 min after the start of the reaction and promptly quenched with cold acetonitrile (spiked with an internal standard). Samples were centrifuged at 3000 rpm for 10 min. The amount of compound in the supernatant was determined by LC/MS/MS (Applied Biosystems, Sciex API4000 Q-Trap) and the percent of parent compound remaining after 180 min was calculated by the following formula:
Results reported are the mean of each reaction duplicate, normalized to the internal standard, and expressed as a percent of compound remaining after the incubation time.
Assay details
- Human Plasma in K3 EDTA
- Procaine and Procainamide were used as standards. Procaine is highly unstable in human plasma, Procainamide is highly stable in human plasma.
- Assay concentrations of standards and test compound: 1 μM
- Incubation Time: 3 hrs
- Reaction pH: 7.4
- Assay DMSO final concentration: 2.5%
Hepatic Microsome Stability: Metabolic stability was assessed in the presence of human liver microsomes (XenoTech, P/N H0630) and mouse liver microsomes (XenoTech, P/N M1000). All liquid dispense and transfer steps were performed with the Freedom Evo automated liquid handler (Tecan US). NADPH, a required cofactor for CYP450 metabolism, was provided by the NADPH Regenerating System, Solutions A (BD Biosciences, P/N 451220) and B (BD Biosciences, P/N 451200). Compound stock solutions were initially prepared in 100% DMSO and subsequently diluted in acetonitrile for the assay. The pH of the reactions was kept at ∼ 7.4 with potassium phosphate buffer (BD Biosciences, P/N 451201). The reactions were started after adding NADPH to the reaction plate containing microsomes and compounds and time 0 min aliquots were promptly collected and mixed with ice cold acetonitrile (spiked with internal standards) to quench the reactions. The remainder of the reaction volume was incubated at 37 °C with shaking. Additional aliquots were collected 60 min after the start of the reaction and promptly quenched with ice cold acetonitrile (spiked with an internal standard). Samples were centrifuged at 3000 rpm for 10 min. The amount of compound in the supernatant was determined by LC/MS/MS (Applied Biosystems, Sciex API4000 Q-Trap) and the percent of parent compound remaining after 60 min was calculated by the following formula:
All reactions were run in triplicate, except negative controls (no NADPH) which were performed as single reactions. Results reported are the mean of each reaction triplicate, normalized to the internal standard, and expressed as a percent compound remaining after the incubation time.
Assay details
- Human and Mouse Liver Microsomes: 0.5 mg/mL protein concentration
- NADPH Regenerating System: 1.55 mM NADP+, 1.33 mM glucose-6-phosphate,1.33 mM Magnesium chloride, and 0.4 U/mL glucose-6 phosphate dehydrogenase
- Incubation Temperature: 37 °C
- Incubation Time: 60 min
- Standards: Verapamil-HCl and Testosterone, at 20 μM and 50 μM, respectively
- Test compound at 1 μM
- Assay DMSO final concentration: ≤ 0.5%
- Assay ACN final concentration: ≤ 1.2%
Cellular Permeability: Permeability was assessed using the Parallel Artificial Membrane Permeability Assay, PAMPA in a 96-well format. All liquid dispense and transfer steps were performed with the Freedom Evo automated liquid handler (Tecan US). Measurements were performed in 20% ACN and aqueous buffer solution (System Solution, pION Inc, P/N 110151) at pH 5.0, 6.2, and 7.4, in duplicate. A “sandwich” plate (pION Inc, P/N 110212) consisting of a donor bottom plate and an acceptor filter plate was used. The donor wells contained the compounds in 180 μl system solution, and magnetic stir bars. The filter on the bottom of each acceptor well was coated with GIT-0 lipid (pION Inc, P/N 110669) and filled with 200 μl of Acceptor Sink Buffer, pH 7.4 (pION Inc, P/N 110139) containing a surfactant to mimic the function of serum proteins. The permeation time was 30 min and moderate stirring (equivalent to 40 μm Aqueous Boundary Layer thickness) was applied using the Gut-Box™ (pION, Inc, P/N 110205). After the permeation time, the sandwich was disassembled and the amount of compound present in both the donor and acceptor wells was measured by UV absorbance (250-498 nm) using the Infinite M200 (Tecan US) and compared to spectra obtained from reference standards. Mass balance was used to determine the amount of material embedded in the membrane filter. The effective permeability, Pe, was calculated using the software PAMPA Evolution Plus, version 3.2 (pION Inc).
Assay details
- Verapamil HCl, Metoprolol, and Ranitidine were used as reference standards
- Verapamil HCl is considered highly permeable
- Metoprolol is considered moderately permeable
- Ranitidine is considered poorly permeable
- Permeation time: 30 min
- Moderate stirring (equivalent to 40 μm ABL, aqueous boundary layer, also known as the unstirred water layer)
- Donor buffer pH: 5.0, 6.2 and 7.4
- Double-Sink: pH gradients between donor and acceptor compartments; acceptor buffer contains chemical sink
- Assay DMSO final concentration : 0.5%
Membrane Permeability through the blood-brain barrier: Permeability was assessed using an in vitro model for the passive transport through the blood-brain barrier, BBB-PAMPA. For this, the Parallel Artificial Membrane Permeability Assay (PAMPA) in a 96-well format was used. All liquid dispense and transfer steps were performed with the Freedom Evo automated liquid handler (Tecan US). Measurements were performed in an aqueous buffer solution (System Solution, pION Inc, P/N 110151) at pH 7.4, in quadruplicate. A “sandwich” plate (pION Inc, P/N 110212) consisting of a donor bottom plate and an acceptor filter plate was used. The donor wells contain the compounds in 180 μl system solution, and magnetic stir bars. The filter on the bottom of each acceptor well is coated with BBB-1 lipid solution (pION Inc, P/N 110672) and filled with 200 μl of Brain Sink Buffer, pH 7.4 (pION Inc, P/N 110674) also containing a surfactant. The permeation time is 60 min. Moderate stirring (equivalent to 40 μm Aqueous Boundary Layer thickness) is applied using the Gut-Box™ (pION, Inc, P/N 110205). After the permeation time, the sandwich is disassembled and the amount of compound present in both the donor and acceptor wells is measured by UV absorbance (250-498 nm) using the Infinite M200 (Tecan US) and compared to spectra obtained from reference standards. Mass balance is used to determine the amount of material embedded in the membrane filter. The effective permeability, Pe, is calculated using the software PAMPA Evolution Plus, version 3.2 (pION Inc). The calculated effective permeability, Pe, is expressed as a kinetic parameter (centimeter per second). A larger number indicates greater speed and thus greater permeability. LogPe is often used to report permeability, and is inversely proportional to Pe; thus the smaller LogPe value indicates greater permeability.
Assay details
- Verapamil-HCl, Corticosterone, and Theophylline are used as reference standards: Verapamil-HCl is considered highly permeable, Corticosterone is considered moderately permeable, and Theophylline is considered poorly permeable.
- Permeation time: 60 min
- Moderate stirring (equivalent to 40 μm ABL, aqueous boundary layer, also known as the unstirred water layer)
- Donor buffer pH: 7.4; Acceptor buffer pH: 7.4
- Assay DMSO assay concentration : 0.5%
Plasma Protein Binding: Teflon® Base Plate wells were rinsed with 20% ethanol for 10 minutes. Ethanol was then removed and wells were rinsed with ultrapure water and allowed to dry. RED Inserts from Thermo Scientific (Pierce) were placed (open end up) into the wells of the base plate. All liquid dispense and transfer steps were performed with the Freedom Evo automated liquid handler (Tecan US). The sample chambers (red ring) contained 300 μl of a mixture of plasma and compound. And 500μl of dialysis buffer (1× PBS, pH7.4) were added to the buffer chambers of the inserts. Duplicate inserts were made for each concentration tested. The base plate was covered with sealing tape and incubated at 37°C on an orbital shaker at 300 rpm for 4 hours. After the incubation time, equal volume from both chambers were removed and transferred to a 96 well plate containing either plasma or buffer. To precipitate proteins and release compounds, ice cold acetonitrile (with an internal standard) was added. Samples were centrifuged for 10 minutes at 3000 rpm. The amount of compound in the supernatant was determined by LC/MS/MS (Applied Biosystems, Sciex API4000 Q-Trap). The percent of free and bound compounds were calculated with the following formulas:
Results reported are the mean of each reaction duplicate, normalized to the internal standard, and expressed as a percent compound bound after the incubation time.
Assay details
- Human Plasma in K3 EDTA
- Propanolol and Metoprolol were used as standards. Propanolol is highly bound, Metoprolol is poorly bound
- Assay concentrations of standards and test compounds: 1 μM and 10 μM
- Incubation Time: 4 hrs
- Reaction pH: 7.4
- Assay DMSO final concentration: 1%
Cytotoxicity: Immortalized human hepatocytes, Fa2N-4 cells (XenoTech) were seeded at ∼56,000 cells/well, and incubated with a range of concentrations (0.01-50 μM) of the test compound, in duplicate, for 24 hrs at 37°C, 5% CO2. Cell viability was determined by cellular ATP levels using the Luminescence ATP Detection Assay System (ATPlite 1 step, Perkin Elmer, # 6016731) and the Infinite M200 plate reader (Tecan).
Assay details
- Cells used: Fa2N-4, immortalized human hepatocytes
- Media used for Fa2N-4 cells: MFE Plating and MFE Support (with 1% Penicillin, Streptomycin, and Amphotercin mixture)
- Assay DMSO final concentration = 0.5%
- Treatment time: 24 hrs
- Camptothecin and Terfenadine were used as standards. Camptothecin is highly toxic and Terfenadine is highly non toxic.
Appendix E. Compounds Provided to Evotec
Table E1Compound Identifier Information for Probe and Supporting analogues
| CID / SID | KU Registry Number / KU Compound Lot Number | P/A | MLS ID | ML ID |
|---|---|---|---|---|
| 72199308 / 174315333 | KUC115043N-02 / KSC-392-065- | P | MLS005870899 | ML404 |
| 22427457 / 174315334 | KUC113868N-02 / KSC-392-066- | A | MLS005870900 | NA |
| 72199296 / 174315335 | KUC113871N-02 / KSC-392-068- | A | MLS005870901 | NA |
| 17253015 / 174315336 | KUC113974N-02 / KSC-392-069- | A | MLS005870902 | NA |
| 72710601 / 174315337 | KUC114042N-02 / KSC-392-067- | A | MLS005870903 | NA |
| 72710605 / 174315338 | KUC114039N-02 / KSC-392-072-F32-35 | A | MLS005870904 | NA |
| 571336 / 174315339 | KUC113508N-02 / KSC-392-073-F47-52 | A | MLS005870905 | NA |
P = Probe; A = Analogue; NA = Not Applicable
Samples of the probe and six analogues were submitted to the NIH MLSMR on March 24, 2014.
Appendix F. Experimental Procedures for the Synthesis of Probe ML404
General Details: All solvents and reagents were used as received from commercial suppliers. The 1H NMR and 13C NMR spectra were recorded on a 400 MHz Bruker Avance spectrometer equipped with a broadband observe probe or a 500 MHz Bruker AVIII spectrometer equipped with a dual cryoprobe. Column chromatography separations were performed using the Teledyne Isco CombiFlash Rf using RediSep Rf silica gel columns. The analytical RPLC method used an Agilent 1200 RRLC system with UV detection (Agilent 1200 DAD SL) and mass detection (Agilent 6224 TOF). The analytical method conditions included a Waters Aquity BEH C18 column (2.1 × 50 mm, 1.7 μm) and elution with a linear gradient of 5% acetonitrile in pH 9.8 buffered aqueous ammonium formate to 100% acetonitrile at 0.4 mL/min flow rate. Automated preparative RP HPLC purification was performed using an Agilent 1200 Mass-Directed Fractionation system (Prep Pump G1361 with gradient extension, make-up pump G1311A, pH modification pump G1311A, HTS PAL autosampler, UV-DAD detection G1315D, fraction collector G1364B, and Agilent 6120 quadrapole spectrometer G6120A). The preparative chromatography conditions included a Waters X-Bridge C18 column (19 × 150 mm, 5 um, with 19 × 10-mm guard column), elution with a water and acetonitrile gradient, which increases 20% in acetonitrile content over 4 min at a flow rate of 20 mL/min (modified to pH 9.8 through addition of NH4OH by auxiliary pump), and sample dilution in DMSO. The preparative gradient, triggering thresholds, and UV wavelength were selected according to the analytical RP HPLC analysis of each crude sample. Compound purity was measured on the basis of peak integration (area under the curve) from UV-vis absorbance at 214 nm, and compound identity was determined on the basis of mass spectral and NMR analyses.
Synthesis of the Probe
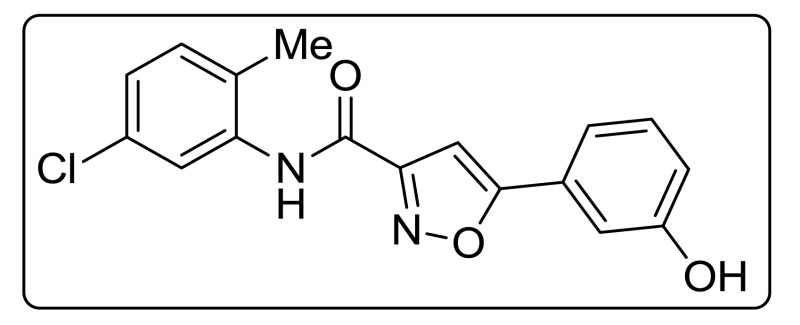
N-(5-Chloro-2-methylphenyl)-5-(3-hydroxyphenyl)isoxazole-3-carboxamide ML404 / CID 72199308 (KSC-392-065; KUC114043N)
Representative Procedure
N-(5-Chloro-2-methylphenyl)-5-(3-hydroxyphenyl)isoxazole-3-carboxamide (KSC-392-065): A solution of 5-(3-hydroxyphenyl)isoxazole-3-carboxylic acid (0.08 g, 0.390 mmol) and thionyl chloride (0.041 ml, 0.558 mmol) in dry THF (1.5 mL) in a 4 dram vial was stirred at reflux for 0.5 h. After cooling to about 35 °C, a solution of 5-chloro-2-methylaniline (0.055 g, 0.390 mmol) and triethylamine (0.217 ml, 1.560 mmol) in dry THF (1 mL) was added dropwise. After stirring at RT for 2 h the reaction mixture was diluted with EtOAc and washed with water, aqueous hydrochloric acid, and brine and purfied by flash chromatography (CombiFlash, 5-100% EtOAc/Hexanes, 25 min). Isolated N-(5-chloro-2-methylphenyl)-5-(3-hydroxyphenyl)isoxazole-3-carboxamide (55 mg, 0.167 mmol, 43 % yield) as a white solid. 1H NMR (400 MHz, Acetone-d6) δ 9.19 (s, 1H), 7.95 (d, J = 2.3 Hz, 1H), 7.50–7.37 (m, 3H), 7.32 (d, J = 8.2 Hz, 1H), 7.23 (s, 1H), 7.19 (dd, J = 8.2, 2.3 Hz, 1H), 7.03 (ddd, J = 7.9, 2.4, 1.2 Hz, 1H), 2.38 (s, 3H). 13C NMR (101 MHz, Acetone-d6) δ 172.82, 160.59, 159.11, 158.03, 137.76, 132.82, 132.07, 131.58, 130.67, 128.96, 126.42, 124.48, 119.08, 118.30, 113.52, 100.39, 17.49. HRMS (ESI–) m/z calcd for (C17H13ClN2O3 −[H])–: 327.0542, found: 327.0538. UPLC purity at 214 nm is 99%.
Appendix G. Eurofins Panlabs LeadProfilingScreen Report for ML404
Study Objective
To evaluate, in radioligand binding assays, the activity of probe compound ML404 (KUC114043N-02, KSC-392-065) across a panel of 68 receptors.
Methods
Methods employed in this study performed at Eurofins Panlabs (https://www.eurofinspanlabs.com/Catalog/Products/ProductDetails.aspx?prodId=0aCrd3Mu4RA%3D) have been adapted from the scientific literature to maximize reliability and reproducibility. Reference standards were run as an integral part of each assay to ensure the validity of the results obtained. Assay results are presented as the percent inhibition of specific binding or activity (for n = 2 replicates) for the probe compound tested at a concentration of 10 μM.

Appendix H. Prior Art Search
Table H1Search Strings and Databases Investigated in Prior Art Search*
| Search Term | Database | Number of Hits |
|---|---|---|
| Mitochondrial permeability transition inhibitor | Chemical Abstracts Service (Scifinder) | 37 references were found containing “Mitochondrial permeability transition inhibitor” as entered |
| Mitochondrial permeability transition pore inhibitor | Chemical Abstracts Service (Scifinder) | 38 references were found containing “Mitochondrial permeability transition pore inhibitor” as entered |
| mtPTP inhibitor | Chemical Abstracts Service (Scifinder) | 23 references were found containing the concept “mtPTP inhibitor” |
| Mitochondrial permeability transition (MPT) inhibitors | Prous Integrity (Drugs & Biologics) | 21 entries were found containing “Mitochondrial permeability transition (MPT) inhibitors” as entered |
- *
Search results as of March 24, 2014
- Probe Structure & Characteristics
- Recommendations for Scientific Use of the Probe
- Materials and Methods
- Results
- Discussion
- References
- Assay Summary Table
- Detailed Assay Protocols
- Analytical Characterization Data for the Probe
- Experimental Procedures for Physiochemcial and In Vitro Pharmacokinetic Property Assays
- Compounds Provided to Evotec
- Experimental Procedures for the Synthesis of Probe ML404
- Eurofins Panlabs LeadProfilingScreen Report for ML404
- Prior Art Search
- PMCPubMed Central citations
- PubChem SubstanceRelated PubChem Substances
- PubMedLinks to PubMed
- Discovery, Synthesis, and Optimization of Diarylisoxazole-3-carboxamides as Potent Inhibitors of the Mitochondrial Permeability Transition Pore.[ChemMedChem. 2015]Discovery, Synthesis, and Optimization of Diarylisoxazole-3-carboxamides as Potent Inhibitors of the Mitochondrial Permeability Transition Pore.Roy S, Šileikytė J, Schiavone M, Neuenswander B, Argenton F, Aubé J, Hedrick MP, Chung TD, Forte MA, Bernardi P, et al. ChemMedChem. 2015 Oct; 10(10):1655-71. Epub 2015 Aug 18.
- Second-Generation Inhibitors of the Mitochondrial Permeability Transition Pore with Improved Plasma Stability.[ChemMedChem. 2019]Second-Generation Inhibitors of the Mitochondrial Permeability Transition Pore with Improved Plasma Stability.Šileikytė J, Devereaux J, de Jong J, Schiavone M, Jones K, Nilsen A, Bernardi P, Forte M, Cohen MS. ChemMedChem. 2019 Oct 17; 14(20):1771-1782. Epub 2019 Sep 25.
- Direct inhibition of the mitochondrial permeability transition pore: a possible mechanism for better neuroprotective effects of allopregnanolone over progesterone.[Brain Res. 2009]Direct inhibition of the mitochondrial permeability transition pore: a possible mechanism for better neuroprotective effects of allopregnanolone over progesterone.Sayeed I, Parvez S, Wali B, Siemen D, Stein DG. Brain Res. 2009 Mar 31; 1263:165-73. Epub 2009 Feb 3.
- Review Perspectives of drug-based neuroprotection targeting mitochondria.[Rev Neurol (Paris). 2014]Review Perspectives of drug-based neuroprotection targeting mitochondria.Procaccio V, Bris C, Chao de la Barca JM, Oca F, Chevrollier A, Amati-Bonneau P, Bonneau D, Reynier P. Rev Neurol (Paris). 2014 May; 170(5):390-400. Epub 2014 May 1.
- Review Mitochondrial permeability transition pore: a promising target for the treatment of Parkinson's disease.[Protoplasma. 2017]Review Mitochondrial permeability transition pore: a promising target for the treatment of Parkinson's disease.Rasheed MZ, Tabassum H, Parvez S. Protoplasma. 2017 Jan; 254(1):33-42. Epub 2016 Jan 29.
- Small Molecules Targeting the Mitochondrial Permeability Transition - Probe Repo...Small Molecules Targeting the Mitochondrial Permeability Transition - Probe Reports from the NIH Molecular Libraries Program
- Year 6 Reports - Probe Reports from the NIH Molecular Libraries ProgramYear 6 Reports - Probe Reports from the NIH Molecular Libraries Program
- Mrgprs as Itch Receptors - ItchMrgprs as Itch Receptors - Itch
- Sensitization of Itch Signaling - ItchSensitization of Itch Signaling - Itch
- Probe Reports from the NIH Molecular Libraries ProgramProbe Reports from the NIH Molecular Libraries Program
Your browsing activity is empty.
Activity recording is turned off.
See more...