

NCBI Bookshelf. A service of the National Library of Medicine, National Institutes of Health.
Probe Reports from the NIH Molecular Libraries Program [Internet]. Bethesda (MD): National Center for Biotechnology Information (US); 2010-.
The central role of hydroxyprostaglandin dehydrogenase(HPGD) is to inactivate prostaglandins such as prostaglandin E2 (PGE2) or prostaglandin D2 (PGD2). These prostaglandins are involved in a number of processes, including inflammation, differentiation, and cellular signaling, which makes HPGD an important target for pharmacological intervention. High throughput screening of the Molecular Libraries Small Molecule Repository (MLSMR) led to the identification of three small molecule inhibitors of HPGD with differing mechanisms of action (ML147, ML148, and ML149). Herein, we report, the structure-activity relationship (SAR) studies, cell-based characterization and selectivity studies around the ML148 and ML149 scaffolds. These combined efforts led to the identification of two novel small molecule chemical probes (ML387 and ML388) with nanomolar inhibitory activity and excellent selectivity toward HPGD. Moreover, these compounds were shown to potently promote PGE2 production in both A549 lung cancer and LNCaP prostate cancer cells. As part of these studies, we also profiled top compounds for select in vitro ADME properties to facilitate future optimization efforts.
Assigned Assay Grant #: MH084681
Date Submitted: 04/11/2014
Screening Center Name & PI: NIH Chemical Genomics Center (NCGC), NIH Center for Advancing Translation Sciences (NCATS)
Chemistry Center Name & PI: NIH Chemical Genomics Center (NCGC), NIH Center for Advancing Translation Sciences (NCATS)
Assay Submitter & Institution: Udo Oppermann, Structural Genomics Consortium, University of Oxford
PubChem Summary Bioassay Identifier (AID): 743196
Probe Structure & Characteristics

| CID/ML# | Target Name | IC50/EC50 (nM) [SID, AID] | Anti-target Name(s) | IC50/EC50 (μM) [SID, AID] | Fold Selective | Secondary Assay(s) Name: IC50/EC50 (μM) [SID, AID] |
|---|---|---|---|---|---|---|
| CID 3474778/ML387 | HPGD | 19 [SID 162211043, AID 743171] | ALDH1A1 | 1358 [SID 162211043, AID 743195] Inactive [SID 162211043, AID 743169 & AID 743192] Inactive [SID 162211043, AID 743193] Inactive [SID 162211043, AID 743187] | 71 | ALDH1A1 [SID162211043, AID 743195] LDHA, LDHB [SID 162211043,AID 743169 & AID 743192] rGAPDH [SID 162211043, AID 743193] HSD17β4 [SID 162211043, AID 743187] |
| LDHA, LDHB | >1000 | |||||
| rGAPDH | >1000 | |||||
| HSD17B4 | >1000 | |||||
| CID 71307851/ML388 | HPGD | 34 [SID-162211017, 743171] | ALDH1A1 | 2415[SID-162211017, 743195] Inactive [SID-162211017,AID 743169 & AID 743192] Inactive [SID-162211017, AID 743193] Inactive [SID-162211017, AID 743187] | 71 | ALDH1A1 [SID 162211017, AID 743195] LDHA, LDHB [SID 162211017,AID 743169 & AID 743192] rGAPDH [SID 162211017, AID 743193] HSD17β4 [SID 162211017, AID 743187] |
| LDHA, LDHB | >1000 | |||||
| GAPDH | >1000 | |||||
| HSD17B4 | >1000 | |||||
1. Recommendations for scientific use of the probe
Prostaglandins play central roles as signaling molecules, hence their levels are tightly regulated. One approach to study prostaglandins deregulation is through the modulation of their metabolism. HPGD is central to the metabolism of three key prostaglandins: PGE2, PGD2, and 15d-PGJ2. The two reported probes, ML387 and ML388, are small molecules inhibitors of HPGD with nanomolar potency, excellent selectivity versus five other dehydrogenases, and improved ADME properties when compared to the original probes. Moreover, their efficacy was demonstrated at the cellular level through induction of PGE2 production in A549 (lung cancer) cells and LNCaP prostate cancer cells. Given these attributes, ML387 and ML388 would be useful for studying the effect of pharmacological inhibition of HPGD in diseases such as cancer (e.g. cell migration, proliferation) and wound healing (prevention of excessive scar tissue).
2. Materials and Methods
2.1. Assays
2.1.1. Cell lines and culture conditions
The A549 cell line was obtained from ATCC. LNCaP cell line was generously donated by the lab of William Farrar at Frederick National Laboratories. Cells were cultured in RPMI 1640 medium supplanted with 10% dialyzed fetal bovine serum, 100 U/mL penicillin and 100 μg/mL streptomycin. For the LNCaP cell line, arachidonic acid was added at 10 μM. The cultures were maintained in a 37 °C incubator with 5% CO2 and under a humidified atmosphere.
2.1.2. HPGD qHTS Assay
Inhibition of 15-PGDH (HPGD) activity was screened by utilizing prostaglandin as an electron donor and NAD+ as an electron acceptor/cofactor. An increase in the fluorescence intensity due to conversion of NAD+ to NADH was used to measure the enzyme activity. All compounds were screened using a qHTS approach, where compounds are assayed using at least seven concentrations to generate concentration-response curves for every compound. Briefly, qHTS uses an inter-plate dilution method where the first plate contains the highest concentration of a set of compounds in DMSO, while subsequent plates contain the same compounds in the same well locations, but at successive lower concentrations.
Three μL of enzyme (20 nM final concentration) were dispensed to 1536-well Greiner black solid bottom plates. Compounds (23 nL) were transferred via Kalypsys PinTool. The plates were incubated for 15 min at room temperature, and then 1 μL of substrate/cofactor solution (Substrate/cofactor solution: 1 mM NAD+ and 30 μM prostaglandin (Sigma, prostaglandin E2, #P5640)) were added to start the reaction. The plates were immediately transferred to and read 4 times every 30 seconds on a ViewLux High-throughput CCD imager (Perkin-Elmer) using 340 nm excitation and 450 nm emission fluorescence protocol. The fluorescence intensity difference between the last and the first time points, normalized against controls, was used to compute reaction progress. [PubChem AID 743171]
Table 1Stepwise protocol of the HPGD primary screen in 1536-well format
| Sequence | Parameter | Value | Description |
|---|---|---|---|
| 1 | Reagent | 3 μL | 20 nM HPGD |
| 2 | Compound | 23 nL | Compound library and control |
| 3 | Time | 15 min | Incubation with compounds at room temperature |
| 4 | Reagent | 1 μL | 1 mM NAD+ and 30 μM prostaglandin |
| 5 | Detector | Fluorescence | Read 4 times, 30 sec interval (ViewLux; ex 340, em 450) |
2.1.3. Prostaglandin E2 (PGE2) HTRF Cell-based 384-well Assay: A549 or LNCaP Cell Line
A549 cells, LNCaP cells or media were dispensed in 384-well plates (ProxiPlate-384 Plus, PerkinElmer, Shelton, CT) at 5,000 cells/9.9 μL/well using a CappAero384 multichannel pipette (Odense, Denmark). Separately on the plate, 10 μL of PGE2 calibration standards at a starting assay concentration of 5,000 pg/mL (1:2 dilution, 12-points, n = 1, prepared in media, Cisbio, Bedford, MA) were dispensed. Compounds (100 nL, final concentration range from 41.9 nM to 100 μM) were transferred using an ATS Acoustic Liquid Dispenser (EDC Biosystems, Fremont, CA). After being mixed using an automated liquid handler (CyBio, Jena, Germany), samples were incubated (37 °C, 5% CO2, under a humidified atmosphere) for 16 hours. PGE2 labeled conjugates were added to each well, first 5 μL of PGE2-d2, followed by 5 μL of anti-PGE2-cryptate, centrifuged (1,500 rpm, 15 sec) and incubated (RT, protected from light) for 5 hours. Time-resolved fluorescence intensity (320 nm excitation, 615 and 665 nm emission) was measured using an Envision plate reader (PerkinElmer). Data was expressed as the ratio of 665 nm/615 nm emissions. Concentration (pg/mL) of samples were calculated from a 4-parameter logistic calibration curves of the PGE2 standards. [PubChem AID 743172]
Table 2Stepwise protocol of the PGE2 HTRF assay using LNCaP cells in 384-well format
| Sequence | Parameter | Value | Description |
|---|---|---|---|
| 1 | Reagent | 9.9 μL | 5,000 cells/well (A549, LNCaP, or media) |
| 2 | Compound | 100 nL | Compound addition through acoustic liquid dispenser (final concentration ranges 41.9 nM t0 100 μM) |
| 3 | Time | 16 hr | Upon mixing, incubation at 37 ºC, 5% CO2 |
| 4 | Reagent | 5 μL | PGE2-d2 |
| 5 | Reagent | 5 μL | anti-PGE2-cryptate |
| 6 | Time | 15 sec | Centrifuged at 1,500 RPM |
| 7 | Time | 5 hr | Incubation at room temperature, protected from light |
| 8 | Detector | HTRF | Envision (320 nm, 615 and 665 nm emission |
2.1.4. Prostaglandin E2 (PGE2) HTRF Cell-based 1,536-well Assay: A549 Cell Line
A549 cells or media were dispensed onto a 1,536-well solid-bottom T/C white plate (Greiner Bio One, Monroe, NC) at 2,500 cells/5 μL/well using a Thermo Scientific Multidrop Combi (Thermo Fisher Scientific Inc., Waltham, MA). Separately on the plate, 5 μL of PGE2 calibration standards at a starting assay concentration of 5,000 pg/mL (1:2 dilution, 12-points, n = 2, prepared in media, Cisbio, Bedford, MA) were manually dispensed, followed by compounds (23 nL, final concentration range from 775 pM to 45.8 μM) and positive control titration (CID- 3243760, final concentration range 1.4 nM to 45.8 μM) transferred using a Kalypsys Pin-tool dispenser (Wako Automation, San Diego, CA). Plates were incubated (37 °C, 5% CO2, under a humidified atmosphere) at 4, 8, 12, 16, and 20 hours. PGE2 labeled conjugates were added to each well, first 2.5 μL of PGE2-d2 (or buffer), followed by 2.5 μL of anti-PGE2-cryptate, centrifuged (1,000 rpm, 15 sec) and incubated (RT, protected from light) for 5 hours. Time-resolved fluorescence intensity (320 nm excitation, 615 and 665 nm emission) was measured using an Envision plate reader (PerkinElmer). Data was expressed as the ratio of 665 nm/615 nm emissions. Concentration (pg/mL) of samples were calculated from a 4-parameter logistic calibration curves of the PGE2 standards. [PubChem AID 743167]
Table 3Stepwise protocol of the PGE2 HTRF assay using A549 cells in 1536-well format
| Sequence | Parameter | Value | Description |
|---|---|---|---|
| 1 | Reagent | 5 μL | 2,500 cells/well (A549 or media) |
| 2 | Compound | 23 nL | Compounds and controls |
| 3 | Time | Varied | Incubation at 37 ºC, 5% CO2, 4, 8, 12, and 16 hours |
| 4 | Reagent | 2.5 μL | PGE2-d2 |
| 5 | Reagent | 2.5 μL | anti-PGE2-cryptate |
| 6 | Time | 15 sec | Centrifuged at 1,500 RPM |
| 7 | Time | 5 hr | Incubation at room temperature, protected from light |
| 8 | Detector | HTRF | Envision (320 nm, 615 and 665 nm emission) |
2.1.5. HSD17β4 Counterscreen
The mitochondrial enzyme 17β-hydroxysteroid dehydrogenase 1 (HSD17β4 catalyzes the NAD+-dependent oxidation of a variety of substrates including acyl-CoAs, androgens and neurosteroids, as well as bile acids. HSD17β4 activity was screened by utilizing an electron donor (estradiol) and NAD+ as an electron acceptor/cofactor. An increase in the fluorescence intensity due to conversion of NAD+ to NADH was used to measure the enzyme activity.
Briefly, 3 μL of enzyme (final concentration 100 nM) or buffer were dispensed into a 1,536-well solid-bottom black plate (Greiner Bio One, Monroe, NC) followed by pin-tool transfer (23 nL) of compound (final concentration range 324 pM to 57.2 μM) and control (CID-24867619, final concentration range 5.23 nM to 11.4 μM). Samples were incubated (RT, protected from light) for 15 minutes followed by a 1 μL substrate addition of NAD+ and Estradiol (final concentrations of 1 mM and 50 μM, respectively, in 15% DMSO). Plates were centrifuged at 1,000 rpm for 15 seconds, then read immediately on a ViewLux High-throughput CCD imager (Perkin-Elmer) equipped with standard UV fluorescence optics (340 nm excitation, 450 nm emission), incubated for 1 hour (RT, protected from light) followed by a second read. Data were normalized (Read 21 hour – Read 10 hour) against no-enzyme (positive) and enzyme-containing (neutral) wells. A stepwise description of the 1536-well assay is shown in Table 4.
Table 4
Stepwise protocol of the HSD17β4 counterscreen in 1536-well format.
2.1.6. ALDH1A1 Counterscreen
Aldehyde dehydrogenase 1 family, member A1 (ALDH1A1) catalyzes the NAD+ dependent oxidation of a variety of endogenous and exogenous aldehydes to the corresponding carboxylic acids. The enzyme is the critical step in the metabolic activation of retinoic acid, which plays an essential role as a nuclear receptor ligand. Furthermore, the precursor, retinaldehyde, has recently been shown to play a fundamental role in adipogenesis and obesity, which makes inhibitor development a possible target in metabolic diseases. ALDH1A1 shares some homology with HPGD, and it served as a suitable anti-target of HPGD to determine chemical probe selectivity. The assay system is similar to the HPGD primary screening protocol. Inhibition of ALDH1A1 activity was screened by utilizing propionaldehyde as an electron donor and NAD+ as an electron acceptor/cofactor. An increase in the fluorescence intensity due to conversion of NAD+ to NADH was used to measure the enzyme activity.
Briefly, 3 μL of enzyme (final concentration 50 nM) or buffer were dispensed into a 1,536-well solid-bottom black plate (Greiner Bio One, Monroe, NC) followed by pin-tool transfer (23 nL) of compound (final concentration range 324 pM to 57.2 μM) and control (Bay 11-7085 (CID-5353432), final concentration range 1.31 nM to 2.86 μM). Samples were incubated (RT, protected from light) for 15 minutes followed by a 1 μL substrate addition of NAD+ and Propionaldehyde (final concentrations of 1 mM and 80 μM, respectively). Plates were centrifuged at 1,000 rpm for 15 seconds, then read in kinetic mode on a ViewLux High-throughput CCD imager (Perkin-Elmer) equipped with standard UV fluorescence optics (340 nm excitation, 450 nm emission) for 10 minutes at 5 minute intervals. Data were normalized (Read 210 min – Read 10 min) against no-enzyme (positive) and enzyme-containing (neutral) wells. A stepwise description of the 1536-well assay is shown in Table 5.
Table 5
Stepwise protocol of the LDHA counterscreen in 1536-well format.
2.1.7. LDHA Counterscreen
LDHA converts pyruvate to lactate while regenerating NAD+ from NADH. LDHA enzymatic activity is then coupled to the activity of diaphorase, which reversibly catalyzes the reaction of NAD+ to NADH while simultaneously reducing resazurin to the fluorescent resorufin. This change in fluorescence signal (excitation 544 nm; emission, 590 nm) was monitored using the ViewLux CCD imager (Perkin Elmer). Data were normalized against ‘no enzyme’ control wells and ‘no compound’ control wells.
The enzymatic reaction was performed in buffer consisting of 200 mM Tris-HCl pH 7.4, containing 0.01% Tween 20, and the assay was run in black solid-bottom Greiner plates. A stepwise description of the 1536-well assay is shown in Table 6.
Table 6
Stepwise protocol of the LDHA counterscreen in 1536-well format.
2.1.8. LDHB Counterscreen
LDHB converts pyruvate to lactate while regenerating NAD+ from NADH. LDHB enzymatic activity is then coupled to the activity of diaphorase, which reversibly catalyzes the reaction of NAD+ to NADH while simultaneously reducing resazurin to the fluorescent resorufin. This change in fluorescence signal (excitation 544 nm; emission, 590 nm) was monitored using the ViewLux CCD imager (Perkin Elmer). Data were normalized against ‘no enzyme’ control wells and ‘no compound’ control wells.
The enzymatic reaction was performed in buffer consisting of 200 mM Tris-HCl pH 7.4, containing 0.01% Tween 20, and the assay was run in black solid-bottom Greiner plates. A stepwise description of the 1536-well assay is shown in Table 7.
Table 7
Stepwise protocol of the LDHA counterscreen in 1536-well format.
2.1.9. Rabbit GAPDH Counterscreen
The counterscreen for non-specific dehydrogenase activity was conducted using a rabbit glyceraldehyde-3-phosphate dehydrogenase (rGAPDH; Sigma Aldrich, St. Louis, MO) coupled assay system. In this assay, the rGAPDH-catalyzed conversion of NAD+ to NADH is coupled downstream to an additional enzyme, diaphorase (Sigma Aldrich, St. Louis, MO), which reduces the non-fluorescent molecule, resazurin, to a red fluorescent product, resorufin, in an NADH-dependent fashion. Thus, rGAPDH activity leads to an increase in fluorescence at 598 nm, and inhibitors of the reaction lead to a decrease in resorufin production and a subsequent decrease in fluorescence. The change in fluorescence between 0 and 30 minutes was measured, and data were normalized to control columns representing maximum signal (all components) and background (no rGAPDH). The buffer consisted of 100mM triethanolamine, pH 7.6, 5mM MgCl2 and 0.01% Tween-20, and the assay was run in black, solid-bottom, non-tissue culture-treated Greiner plates. A stepwise description of the 1536-well assay is shown in Table 8.
Table 8
Stepwise protocol of the rGAPDH counterscreen in 1536-well format.
2.1.10. NF-κB-bla ME180 Cell Line and Culture Conditions
The CellSensor™ NF-κB-bla ME180 cell line (NF-κB-bla cells) were obtained from Invitrogen (Carlsbad, CA). Cells were cultured in High Glucose GlutaMAX™ DMEM medium supplemented with 10% dialyzed fetal bovine serum, 0.1 mM non-essential amino acids, 25 mM HEPES (pH 7.3), 100 U/mL penicillin and 100 μg/mL streptomycin, and 5 μg/mL of blasticidin. The cultures were maintained in a 37 °C incubator with 5% CO2 and under a humidified atmosphere.
2.1.11. NF-κB β-Lactamase Reporter Gene Assay (NF-κB bla assay) and Cell Viability Assay
The NF-κB-bla cells were suspended in OPTI-MEM medium supplemented with 0.5% dialyzed fetal bovine serum, 0.1 mM nonessential amino acids, 25 mM sodium pyruvate, 100 U/mL penicillin, and 100 μg/mL streptomycin. Cells were dispensed at 2,000 cells/5 μL/well using a Thermo Scientific Multidrop Combi (Thermo Fisher Scientific Inc., Waltham, MA) and incubated (37 °C, 5% CO2, under a humidified atmosphere) overnight. Compounds (23 nL, final concentration range from 647 pM to 38.2 μM) and positive control titration (MG132, final concentration range 17.5 nM to 38.2 μM) were transferred to a 1,536-well clear-bottom T/C black plate (Greiner Bio One) using a Kalypsys Pin-tool dispenser (Wako Automation, San Diego, CA). Cells were incubated (37 °C) 15 minutes, followed by addition of either 1 μL assay buffer with or without tumor necrosis factor alpha (TNF-α, final concentration 1 ng/mL). The plates were incubated for 4, 8, 12, 18, and 24 hours at 37 °C, then 1 μL of LiveBLAzer™ B/G FRET substrate (Invitrogen, CA) detection mix was added and the plates incubated at room temperature for 2 hours. Fluorescence intensity (405 nm excitation, 460 and 530 nm emission) was measured using an Envision plate reader (Perkin Elmer, Shelton, CT). Data was expressed as the ratio of 460nm/530 nm emissions. At the completion of the read, each plate received a 2.5 μL dispense of CellTiter-Glo (Promega, Madison, WI), then after a 10 minute incubation (RT) samples were analyzed for luminescence intensity using a ViewLux High-throughput CCD imager (Perkin-Elmer) equipped with clear filters.
Table 9Stepwise protocol for the NF-κB Lactamase Reporter Gene Assay
| Sequence | Parameter | Value | Description |
|---|---|---|---|
| 1 | Compound | 23 nL | Compound Library and MG132 |
| 2 | Reagent | 5 μL | 2000cells/well Cell Sensor™ NF- κB-bla ME180 |
| 3 | Time | 15 min | Incubation at 37 ºC |
| 4 | Reagent | 1 μL | TNF-α (final conc. 1 ng/mL) or assay buffer |
| 5 | Time | 5 hr | Incubation at 37 ºC |
| 6 | Reagent | 1 μL | LiveBLAzer™ B/G FRET substrate |
| 7 | Time | 2 hr | Room temperature incubation |
| 8 | Detector | Fluorescence | Envision (460 nm Ex, 530 nm Em) |
| 9 | Reagent | 2.5 μL | CellTiter-Glo |
| 10 | Time | 15 sec | Centrifuge at 1,500 RPM |
| 11 | Time | 10 min | Incubate at room temperature |
| 12 | Detector | Luminescence | ViewLux (clear filters) |
2.2. Probe Chemical Characterization
2.2.1. ML387 (Probe 1)

(1-(4-methoxyphenyl)-1H-benzo[d]imidazol-5-yl)(piperidin-1-yl)methanone, TFA (ML387)
LC-MS rt: 4.15 min; 1H NMR (400 MHz, DMSO-d6) δ 8.81 – 8.70 (m, 1H), 7.77 (s, 1H), 7.66 – 7.60 (m, 2H), 7.58 (d, J = 8.5 Hz, 1H), 7.37 (d, J = 8.6 Hz, 1H), 7.23 – 7.15 (m, 2H), 3.86 (s, 3H), 3.65 – 3.35 (m, 4H), 1.68 – 1.58 (m, 2H), 1.58 – 1.44 (m, 4H); 13C NMR (100 MHz, DMSO-d6) δ 168.9, 159.2, 144.4, 133.6, 131.5, 128.0, 125.8, 123.0, 117.4, 115.2, 111.0, 55.6, and 24.1; HRMS (ESI) m/z 336.1703 (M + H)+ (C20H22N3O2 requires 336.1707).

Figure 11H and13C NMR spectra of ML387

Figure 2LC-MS of ML387
Probe analogs

Figure 3Structures of the five analogs of ML387 that have been submitted to the MLSMR
| Internal ID | MLS ID | SID | CID | ML # | Type | Source |
|---|---|---|---|---|---|---|
| NCGC00262228 | MLS005565827 | 162211043 | 3474778 | ML387 | Probe | NCGC |
| NCGC00262223 | MLS004857446 | 162211012 | 71307827 | Analog | NCGC | |
| NCGC00262277 | MLS004857445 | 162210983 | 71307865 | Analog | NCGC | |
| NCGC00262222 | MLS004857448 | 162210969 | 71307836 | Analog | NCGC | |
| NCGC00262238 | MLS004857449 | 162211008 | 71307876 | Analog | NCGC | |
| NCGC00262242 | MLS004857450 | 162211025 | 71307812 | Analog | NCGC |
%20of%20the%20probe%20HPLC%20signal%20observed%20at%20254%20nm.&p=BOOKS&id=280041_ml388f6.jpg "Click on image to zoom")
Figure 4Stability of ML387 over time in aqueous solution at room temperature, as measured by the area under the curve (AUC) of the probe HPLC signal observed at 254 nm
PBS: phosphate buffer saline, pH 7.4; HPGD: assay buffer; GSH: 10 mM GSH in PBS buffer.
2.2.2. ML388 (Probe 2)
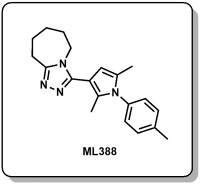
3-(2,5-dimethyl-1-(p-tolyl)-1H-pyrrol-3-yl)-6,7,8,9-tetrahydro-5H-[1,2,4]triazolo[4,3-a]azepine, TFA (ML388)
LC-MS rt: 4.75 min; 1H NMR (400 MHz, DMSO-d6) δ 7.39 (d, J = 8.0 Hz, 2H), 7.26 (d, J = 8.2 Hz, 2H), 6.19 (s, 1H), 4.30 – 4.06 (m, 2H), 3.16 – 3.01 (m, 2H), 2.41 (s, 3H), 2.05 (s, 3H), 2.02 (s, 3H), 1.90 – 1.78 (m, 4H), 1.75 (m, 2H); 13C NMR (100 MHz, DMSO-d6) δ 157.0, 150.0, 138.4, 134.2, 131.4, 130.2, 130.1, 127.6, 106.5, 69.8, 46.5, 29.3, 26.7, 25.4, 23.9, 20.7, 12.5, and 11.8; HRMS (ESI) m/z 321.2076 (M + H)+ (C20H25N4 requires 321.2074).

Figure 51H and13C spectra of ML388

Figure 6LC-MS of ML388
Probe analogs

Figure 7Structures of the five analogs of ML388 that have been submitted to the MLSMR
| Internal ID | MLS ID | SID | CID | ML # | Type | Source |
|---|---|---|---|---|---|---|
| NCGC00249661 | MLS005565826 | 162211017 | 71307851 | ML388 | Probe | NCGC |
| NCGC00249658 | MLS004857440 | 162211019 | 71307849 | Analog | NCGC | |
| NCGC00249646 | MLS004857441 | 162211016 | 71307856 | Analog | NCGC | |
| NCGC00249647 | MLS004857442 | 162210974 | 71307853 | Analog | NCGC | |
| NCGC00249642 | MLS004857443 | 162210963 | 71307824 | Analog | NCGC | |
| NCGC00249643 | MLS004857444 | 162210962 | 71307846 | Analog | NCGC |
%20of%20the%20probe%20HPLC%20signal%20observed%20at%20254%20nm.&p=BOOKS&id=280041_ml388f11.jpg "Click on image to zoom")
Figure 8Stability of ML388 over time in aqueous solution at room temperature, as measured by the area under the curve (AUC) of the probe HPLC signal observed at 254 nm
PBS: phosphate buffer saline, pH 7.4; HPGD: assay buffer; GSH: 10 mM GSH in PBS buffer.
2.3. Probe Preparation
2.3.1. ML387 (Probe 1)
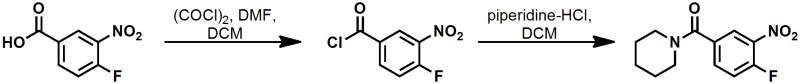
(4-fluoro-3-nitrophenyl)(piperidin-1-yl)methanone
A mixture containing 4-fluoro-3-nitrobenzoic acid (2.00 g, 10.80 mmol), and oxalyl chloride (4.75 mL, 54.0 mmol) in DCM (54mL) was carefully treated with DMF (0.084 mL, 1.080 mmol). The reaction mixture was stirred at 23 °C for 3 hr. The reaction mixture was concentrated under diminished pressure. The obtained residue was taken up in 10 mL of toluene, and the mixture was concentrated under diminished pressure. This process was repeated to yield crude 4-fluoro-3-nitrobenzoyl chloride as a clear, dark yellow syrup.
A solution containing 4-fluoro-3-nitrobenzoyl chloride (2.20 g, 10.8 mmol) in DCM (27 mL) was treated with piperidine hydrochloride (1.71 g, 14.0 mmol), and with diisopropylethylamine (2.10 mL, 11.9 mmol) at 23 °C for 69 hr. The reaction mixture was diluted with 25 mL of DCM. The organic layer was washed with two 25 mL portions of 0.50 M aqueous HCl. The product was extracted with two 25 mL portions of DCM. The combined organic layer was dried (MgSO4), and was then concentrated under diminished pressure. The obtained clear pale yellow oil was applied to a silica gel column (50 g); eluting with 80:20 → 20:80 Hex-EtOAc afforded (4-fluoro-3-nitrophenyl)(piperidin-1-yl)methanone as a clear pale yellow syrup: yield 1.72 g (63 % over two steps); 1H NMR (400 MHz, CDCl3) δ 8.11 (dd, J = 7.0, 2.2 Hz, 1H), 7.69 (ddd, J = 8.5, 4.2, 2.2 Hz, 1H), 7.34 (dd, J = 10.4, 8.5 Hz, 1H), 3.70 (brs, 2H), 3.36 (brs, 2H), 1.63 (m, 6H).

(1-(4-methoxyphenyl)-1H-benzo[d]imidazol-5-yl)(piperidin-1-yl)methanone, TFA (ML387)
A mixture containing (4-fluoro-3-nitrophenyl)(piperidin-1-yl)methanone (200 mg, 0.793 mmol), 4-methoxyaniline (98.0 mg, 0.793 mmol), and DIPEA (140 μL, 0.800 mmol) in NMP (1.60 mL) was heated in the microwave reactor at 200 °C for 3 hr. The reaction mixture was partitioned between 40 mL of water and 20 mL of EtOAc. The layers were separated, then the product was extracted with three 20 mL portions of EtOAc. The combined organic layer was washed with 20 mL of water, then with 20 mL of brine, was then dried (Na2SO4), and was then concentrated under diminished pressure. The obtained brown oil was applied to a silica gel column (100 g); eluting with 80:20 → 20:80 Hex-EtOAc afforded (4-((4-methoxyphenyl)amino)-3-nitrophenyl)(piperidin-1-yl)methanone as a red syrup; yield: 141 mg (50%).
To a stirred suspension containing(4-((4-methoxyphenyl)amino)-3-nitrophenyl)(piperidin-1-yl)methanone (0.141 g, 0.397 mmol) and Raney nickel (slurry in water) (50 μL) in methanol (7.90 mL) was added hydrazine (0.137 mL, 4.36 mmol). The reaction mixture was stirred at 23 °C for 18 hr. Some Raney nickel (slurry in water) (50 μL) and hydrazine (0.137 mL, 4.36 mmol) were added. Stirring was continued at 23 °C for 30 min. Then, some celite was added, followed by 20 mL of MeOH. The suspension was filtered, and the collected filtrate was concentrated to afford (3-amino-4-((4-methoxyphenyl)amino)phenyl)(piperidin-1-yl)methanone as a brown syrup; yield: 0.125 g (97 % yield). The crude aniline was used in the next step without further purification.
A mixture containing (3-amino-4-((4-methoxyphenyl)amino)phenyl)(piperidin-1-yl)methanone (0.125 g, 0.384 mmol), triethyl orthoformate (0.338 mL, 1.921 mmol) and p-toluenesulfonic acid monohydrate (3.65 mg, 0.019 mmol) in THF (1.90 mL) was heated in the microwave reactor at 90 °C for 1.0 hr. The reaction mixture was allowed to cool down to 23 °C, and was then diluted with 2 mL of MeOH. The resulting solution was purified by reversed-phase HPLC to afford (1-(4-methoxyphenyl)-1H-benzo[d]imidazol-5-yl)(piperidin-1-yl)methanone, TFA; yield: 76.3 mg (44%).
2.3.2. ML388 (Probe 2)
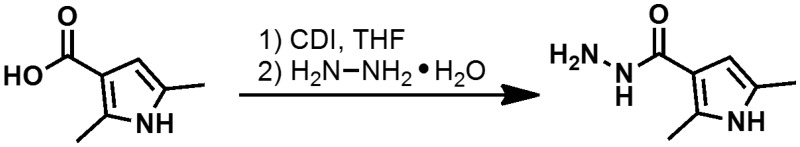
2,5-dimethyl-1H-pyrrole-3-carbohydrazide
A solution containing 2,5-dimethyl-1H-pyrrole-3-carboxylic acid (2.00 g, 14.37 mmol) in THF (29 mL) was treated with CDI (2.56 g, 15.81 mmol) at 23 °C for 3.5 hr. The resulting brown/orange suspension was then treated with hydrazine monohydrate (2.1 mL, 43.1 mmol) at 23 °C for 18 hr. Within 1 hr, the precipitate had dissolved and a clear orange solution was obtained. The solvent was evaporated under diminished pressure; the resulting mixture was applied to a silica gel column (50 g); eluting with 95:5 → 75:25 DCM-MeOH led to a mixture containing the product and imidazole. The obtained solid was recrystallized from EtOAc to afford 2,5-dimethyl-1H-pyrrole-3-carbohydrazide as a pale yellow crystalline solid: yield 1.43 g (65.0 %); 1H NMR (400 MHz, DMSO-d6) δ 10.62 (s, 1H), 8.65 (s, 1H), 6.08 – 5.97 (m, 1H), 4.13 (s, 2H), 2.35 (s, 3H), 2.07 (s, 3H).

3-(2,5-dimethyl-1H-pyrrol-3-yl)-6,7,8,9-tetrahydro-5H-[1,2,4]triazolo[4,3-a]azepine
A suspension containing 2,5-dimethyl-1H-pyrrole-3-carbohydrazide (2.00 g, 13.1 mmol) and 7-methoxy-3,4,5,6-tetrahydro-2H-azepine (2.80 mL, 19.6 mmol) in chlorobenzene (15 mL) was heated in a capped reaction vial in the microwave oven at 180 °C for 45 min. The reaction mixture was allowed to cool down to room temperature and was then concentrated under diminished pressure. The residue was applied to a silica gel column (100 g); eluting with 95:5 → 75:25 DCM-MeOH (methanol containing 10% NH4OH) afforded 3-(2,5-dimethyl-1H-pyrrol-3-yl)-6,7,8,9-tetrahydro-5H-[1,2,4]triazolo[4,3-a]azepine as a white solid; yield 2.14 g (71%); LC-MS rt (min): 2.58 min; 1H NMR (400 MHz, CDCl3) δ 9.02 (s, 1H), 5.77 (d, J = 2.6 Hz, 1H), 4.03 - 3.96 (m, 2H), 3.05 - 2.95 (m, 2H), 2.23 (d, J = 1.5 Hz, 6H), 1.88 (q, J = 6.0 Hz, 2H), 1.75 (dt, J = 10.0, 5.1 Hz, 4H).
3-(2,5-dimethyl-1-(p-tolyl)-1H-pyrrol-3-yl)-6,7,8,9-tetrahydro-5H-[1,2,4]triazolo[4,3-a]azepine, TFA (ML388)

In a sealed vial, a mixture containing 3-(2,5-dimethyl-1H-pyrrol-3-yl)-6,7,8,9-tetrahydro-5H-[1,2,4]triazolo[4,3-a]azepine (150 mg, 0.651 mmol), p-toluyl iodide (170 mg, 0.782 mmol), cesium carbonate (318 mg, 0.977 mmol), copper(I) oxide (9.32 mg, 0.065 mmol), 4,7-dimethoxy-1,10-phenanthroline (L) (31.3 mg, 0.130 mmol), and poly(ethylene glycol) (150 mg, approx. 100 mg/mmol of pyrrole) in NMP (1.30 mL) was stirred at 100 °C for 18 hr. The reaction mixture was diluted with 3 mL of acetonitrile, and was then filtered. The collected clear brown solution was concentrated under diminished pressure and the resulting residue was purified by reversed phase HPLC to afford 3-(2,5-dimethyl-1-(p-tolyl)-1H-pyrrol-3-yl)-6,7,8,9-tetrahydro-5H-[1,2,4]triazolo[4,3-a]azepine, TFA; yield: 38.3 mg (14%).
3. Results
3.1. Dose Response Curves for Probes ML387 and ML388
.&p=BOOKS&id=280041_ml388f17.jpg "Click on image to zoom")
Figure 9Dose-dependent inhibition of HPGD by ML387 and ML388 in the qHTS assay (see section 2.2.2)
3.2. Cellular Activity
Table 10PGE2 produced in A549 cells and LNCaP cells
| Entry | CID | HPGD Assay | Prostagladin E2 (PGE2) Assay in A549 cells | Prostagladin E2 (PGE2) Assay in LNCaP cells | ||
|---|---|---|---|---|---|---|
| IC50 (nM) | AC50 (μM) | % Induction | AC50 (μM) | % Induction | ||
| ML149 (1) | 2331284 | 54 | 0.743 | 106 | 2.797 | 73 |
| 2 | 71307587 | 22 | 0.296 | 110 | 0.352 | 105 |
| 3 | 71307858 | 34 | 0.590 | 114 | 0.558 | 68 |
| 7 | 71307838 | 48 | 2.093 | 145 | 2.222 | 44 |
| ML388 (9) | 71307851 | 34 | 0.166 | 107 | 0.703 | 71 |
| 10 | 71307843 | 76 | 2.635 | 350 | 1.765 | 63 |
| ML148 (27) | 3243760 | 19 | 0.469 | 129 | 0.884 | 62 |
| 31 | 71307871 | 68 | 0.743 | 127 | 4.433 | 53 |
| 32 | 71307813 | 68 | 1.321 | 121 | 1.765 | 62 |
| 44 | 71307865 | 12 | 0.372 | 170 | 0.222 | 85 |
| 46 | 71307863 | 48 | 2.635 | 173 | 2.797 | 70 |
| ML387 (51) | 3474778 | 19 | 0.662 | 174 | 0.884 | 69 |
3.3. Profiling Assays
3.3.1. In-vitro ADME profiles of ML387 and ML388
Table 11In vitro ADME profiles of ML387 and of ML388
| Compound | PAMPAaPermeability at pH 7.4 | Aqueous Kinetic Solubility in PBS Buffer pH 7.4 | Rat Liver Microsomal StabilitybT1/2 |
|---|---|---|---|
| ML387 | 624 × 10-6 cm/s | > 50 μM | 23 min |
| ML388 | 1330 × 10-6 cm/s | 28 μM | 1.8 min |
- a
PAMPA: Parallel Artificial Membrane Permeability Assay; the assay measures the passive transport of the probes through a lipid bilayer.
- b
represents the stability in the presence of NADPH. The probes showed no degradation without NADPH over a 1 h period.
3.3.1. Selectivity profiles of ML387 and ML388
Table 12Inhibitory activities of ML387 and of ML388 and related analogs versus a panel of dehydrogenases
| Compound | CID | IC50 (nM) | |||||
|---|---|---|---|---|---|---|---|
| HPGD | ALDH1A1 | LDHA | LDHB | rGAPDH | HSD17β4 | ||
| 2 | 71307587 | 22 | 607 | inactive | inactive | inactive | inactive |
| 3 | 71307858 | 34 | 4818 | inactive | inactive | inactive | inactive |
| 7 | 71307838 | 48 | 1524 | inactive | inactive | inactive | inactive |
| ML388 (9) | 71307851 | 34 | 2415 | inactive | inactive | inactive | inactive |
| 10 | 71307843 | 76 | 6806 | inactive | inactive | inactive | inactive |
| 31 | 71307871 | 68 | 1918 | inactive | inactive | inactive | inactive |
| 32 | 71307813 | 68 | 6806 | inactive | inactive | inactive | inactive |
| 44 | 71307865 | 12 | 1918 | inactive | inactive | inactive | inactive |
| 46 | 71307863 | 48 | 2415 | inactive | inactive | inactive | inactive |
| ML387 (51) | 3474778 | 19 | 1358 | inactive | inactive | inactive | inactive |
4. Discussion
4.1. Comparison to existing art and how the new probe is an improvement
ML387 and ML388 are two inhibitors of HPGD with enzymatic activities in the nanomolar range; IC50 = 19 nM for ML387 and IC50 = 34 nM for ML388. In that respect, they are a slight improvement to CT-8, which has a reported IC50 value of 51 nM.1 To the best of our knowledge, the selectivity of CT-8 towards HGPD has not been reported, and the thiazolidinedione chemotype is known to be highly promiscuous. Our two probes displayed excellent selectivity toward five other dehydrogenases (Table 12). Furthermore, while the ADME properties of ML387 and ML388 were assessed, the ADME properties of CT-8 have not been reported. Finally, we demonstrated that HPGD inhibition using ML387 and ML388 potentiated PGE2 production in two cell lines in a dose-dependent fashion. In order to measure PGE2 production levels, Wu et al. treated A549 cells with a high concentration of CT-8 (5 μM).2 Our assay provided the measurement of PGE2 production in A549 and LNCaP cells in a dose-dependent fashion, leading to the measurement of a half-maximum activity concentration. Finally, the PGE2 percentage induction was calculated to account for the difference of prostaglandin production, as compared to its basal levels.
5. References
- 1.
- Cho H, Tai H-H. Prostaglandins Leukot. Essent. Fatty Acids. 2002;67:461. [PubMed: 12468268]
- 2.
- Wu Y, Karna S, Choi CH, Tong M, Tai H-H, Na DH, Jang CH, Cho H. J. Med. Chem. 2011;54:5260. [PubMed: 21650226]
- PubChem SubstanceRelated PubChem Substances
- PubMedLinks to PubMed
- Review Potent and selective inhibitors of NAD(+)-dependent 15-hydroxyprostaglandin dehydrogenase (HPGD).[Probe Reports from the NIH Mol...]Review Potent and selective inhibitors of NAD(+)-dependent 15-hydroxyprostaglandin dehydrogenase (HPGD).Jadhav A, Niesen FH, Schultz L, Oppermann U, Maloney DJ, Simeonov A. Probe Reports from the NIH Molecular Libraries Program. 2010
- Structure-activity relationship studies and biological characterization of human NAD(+)-dependent 15-hydroxyprostaglandin dehydrogenase inhibitors.[Bioorg Med Chem Lett. 2014]Structure-activity relationship studies and biological characterization of human NAD(+)-dependent 15-hydroxyprostaglandin dehydrogenase inhibitors.Duveau DY, Yasgar A, Wang Y, Hu X, Kouznetsova J, Brimacombe KR, Jadhav A, Simeonov A, Thomas CJ, Maloney DJ. Bioorg Med Chem Lett. 2014 Jan 15; 24(2):630-5. Epub 2013 Dec 4.
- miR-620 promotes tumor radioresistance by targeting 15-hydroxyprostaglandin dehydrogenase (HPGD).[Oncotarget. 2015]miR-620 promotes tumor radioresistance by targeting 15-hydroxyprostaglandin dehydrogenase (HPGD).Huang X, Taeb S, Jahangiri S, Korpela E, Cadonic I, Yu N, Krylov SN, Fokas E, Boutros PC, Liu SK. Oncotarget. 2015 Sep 8; 6(26):22439-51.
- Understanding human 15-hydroxyprostaglandin dehydrogenase binding with NAD+ and PGE2 by homology modeling, docking and molecular dynamics simulation.[Bioorg Med Chem. 2005]Understanding human 15-hydroxyprostaglandin dehydrogenase binding with NAD+ and PGE2 by homology modeling, docking and molecular dynamics simulation.Hamza A, Cho H, Tai HH, Zhan CG. Bioorg Med Chem. 2005 Jul 15; 13(14):4544-51.
- Review Close teamwork between Nrf2 and peroxiredoxins 1 and 6 for the regulation of prostaglandin D2 and E2 production in macrophages in acute inflammation.[Free Radic Biol Med. 2015]Review Close teamwork between Nrf2 and peroxiredoxins 1 and 6 for the regulation of prostaglandin D2 and E2 production in macrophages in acute inflammation.Ishii T. Free Radic Biol Med. 2015 Nov; 88(Pt B):189-198. Epub 2015 May 9.
- Discovery of two small molecule inhibitors, ML387 and ML388, of human NAD+-depen...Discovery of two small molecule inhibitors, ML387 and ML388, of human NAD+-dependent 15-hydroxyprostaglandin dehydrogenase - Probe Reports from the NIH Molecular Libraries Program
- Small Molecule Inhibitors of Wee1 Degradation and Mitotic Entry - Probe Reports ...Small Molecule Inhibitors of Wee1 Degradation and Mitotic Entry - Probe Reports from the NIH Molecular Libraries Program
- Optimization and Characterization of an Antagonist for G-Protein Coupled Recepto...Optimization and Characterization of an Antagonist for G-Protein Coupled Receptor 7 (GPR7) - Probe Reports from the NIH Molecular Libraries Program
- Profiling a Selective Probe for RTG Branch of Yeast TORC1 Signaling Pathway - Pr...Profiling a Selective Probe for RTG Branch of Yeast TORC1 Signaling Pathway - Probe Reports from the NIH Molecular Libraries Program
- Small Molecules Targeting the Mitochondrial Permeability Transition - Probe Repo...Small Molecules Targeting the Mitochondrial Permeability Transition - Probe Reports from the NIH Molecular Libraries Program
Your browsing activity is empty.
Activity recording is turned off.
See more...