

NCBI Bookshelf. A service of the National Library of Medicine, National Institutes of Health.
Probe Reports from the NIH Molecular Libraries Program [Internet]. Bethesda (MD): National Center for Biotechnology Information (US); 2010-.

In this probe report, we describe the discovery and optimization of a novel more potent antagonist (120 nM by DiscoveRx) for the kappa-(κ) opioid (KOP) receptor that is >267-fold selective over the mu-(μ) (MOP) and the delta-(δ) (DOP) opioid receptors. Importantly, this probe and its analogs represent a novel chemical class compared to current literature antagonists and our previously submitted probe, ML140. Accordingly, this probe and its analogues may serve as interesting tools to advance addiction research. Additionally, this new chemotype is less complicated compared to known KOP receptor antagonist compounds. The structure contains no stereochemical centers and the short, versatile synthetic route enables both the synthesis of potential analogs and the production of the compound on larger scale.
Assigned Assay Grant #: 1X01 DA026208-01 [in CARS] (formerly 1X01MH084153-01)
Screening Center Name & PI: Burnham Center for Chemical Genomics (BCCG) & John C. Reed
Chemistry Center Name & PI: Kansas Specialized Chemistry Center (KSCC) & Jeffrey Aubé
Assay Submitter & Institution: Lawrence Barak, Duke University Medical Center
Collaborating PI: Laura M. Bohn, The Scripps Research Institute, FL
PubChem Summary Bioassay Identifier (AID): 1785
Acknowledgement:
We thank Bryan L. Roth, Jon Evans and Vincent Setola of the Psychoactive Drug Screening Program at the University of North Carolina, Chapel Hill (National Institute of Mental Health's Psychoactive Drug Screening Program, Contract # HHSN-271-2008-00025-C (NIMH PDSP)) for conducting receptor profiling and Ki determinations.
Probe Structure & Characteristics
This Center Probe Report describes a 2nd improved selective antagonist for the KOP receptor compared to ML140, CID3342390 that was previously disclosed in a probe report “Selective KOP receptor antagonists” (http://www.ncbi.nlm.nih.gov/books/NBK50689/), which had an 850 nM potency against KOP receptor with > 25 – 40X selectivity over the MOP and DOP receptors

| CID MLS# | Target Name | IC50 (nM) [SID, AID] | Anti-target Name(s) | IC50(μM) [SID, AID] | Selectivity | Secondary Assay(s) Name: IC50 (nM) [SID, AID] |
|---|---|---|---|---|---|---|
| 44665680 ML190 | KOP κ-opioid receptor (Dx) | 120 nM IC50 SID88442997 AID488935 | MOP μ-opioid receptor (HCS) DOP δ-opioid Receptor (HCS) | >32 μM IC50 SID88442997 AID2420 >32 μM IC50 SID88442997 AID2357 | > 267X (Dx/HCS) >10,700X (HCS/HCS) > 267X (Dx/HCS) > 10,700X (HCS/HCS) | KOP Receptor Transfluor (HCS) 3 nM IC50 [SID8844299, AID488925] MOP Receptor Transfluor (HCS) >32000 nM IC50 [SID88442997, AID488842] DOP Receptor Transfluor (HCS) >32000 nM IC50 [SID88442997, AID488831] |
Recommendations for scientific use of the probe
The probe described in this report, by selectively inhibiting the human kappa opioid receptor, would provide a scientific tool useful in helping to elucidate individual brain pathways that underlie addictive behavior, thus enabling improved understanding of the molecular basis of dependency and potentially providing a basis for therapeutic development.
This probe, ML190 (CID44665680), has a κ-opioid (KOP) receptor IC50 in the primary assay of 120 nM with the DiscoveRx (DrX) β-arrestin technology. The apparently higher potency estimated by the HCS format for KOR is unexpected. In our prior probe report, the KOP receptor potency estimation were within 2-fold of each other between the two technologies, 850 nM IC50 nM by DrX compared to 1320 nM by HCS. Dr. Barak’s experience is that the HCS (Transfluor) Kis are usually a factor 2 – 3 fold within the receptor binding affinities of the inhibitors under the conditions of his antagonist assay. Neverthless, this probe could be used to demonstrate selective binding to the KOP receptor in competitive assays with radiolabeled compounds including, [3H]-Diprenorphine (KOP and MOP), DAMGO (MOP) and Naltrindole [5′,7′-3H] (DOP) receptors.
The probe is approaching the range of potencies where initial dosing in small animals might be considered, though determination of its reversibility need to be established as a preamble to determining if the probe is short acting at the KOP receptor, which would give it a decided advantage over current compounds under consideration as drugs. Studies of this question in cells and animal models may clarify as to whether the underlying mechanism for antagonist anti-addictive behavior requires activation of JNK.
If the potency of this probe can be further improved to low nanomolar potency (Ki) it can be radiolabeled to serve as a key probe for receptor distribution and internalization studies, as well as a probe to map out the contribution of different steps along the β-arrestin mediated signaling pathway within cells.
1. Introduction
Specific Aims
The identification of small molecules, each able to block or activate only a distinct receptor underlying an addiction will provide a means to untangle the many pathways resulting in addictive behavior and create detailed pharmacological maps for designing novel targeted treatments. This project proposes screening a G protein-coupled receptor relevant to drug abuse and to the study and treatment of addiction, in a fashion that affords the unique opportunity to discriminate between G protein and β–arrestin-based signaling modalities. This project will hopefully contribute to understanding and treating addiction by providing chemical probes for dissecting the individual brain pathways that underlie addictive behavior thus enabling improved understanding of the molecular basis of addiction and potentially providing targeted therapeutics for this affliction.
The specific aim of this project is to identify subtype specific small molecule antagonists of the human kappa opioid (KOP) receptor. Such antagonists have been shown to prevent reinstatement of drug taking behavior in animal paradigms thought to model relapse. In addition, they have been shown to block aspects of nicotine withdrawal, and have antidepressant effects in animal models. Use of the existing kappa antagonists to explore these effects in vivo has been limited by their very long duration of pharmacological action (3–4 weeks in rhesus monkeys), which appears to be mediated not by pharmacokinetics but by activation of c-Jun N-terminal kinase (JNK) phosphorylation. Known kappa antagonists all appear to share this effect, which may contribute to their long duration of action in vivo. Novel kappa opioid receptor antagonists that do not activate the JNK pathway would be desirable, but their discovery is beyond the scope of the screening project. Therefore, selective kappa antagonists with new chemical structures may represent valuable leads to the discovery of shorter acting compounds. This is the explicit raison d’être as specifically requested by the National Institute on Drug Abuse (NIDA). Our Centers understand that there are currently, several literature antagonists with subnamomolar potency for the KOP with more than 100-fold selectivity against μ (MOP) and 1,000-fold δ (DOP) receptor subtypes (see Table 9, comparing current prior art probes), none of them have the desired short acting duration in vivo, which would decrease the development of tolerance to them. It is further recognized that the in vivo animal testing required to validate the desired pharmacodynamics of these selective antagonists are actually out of scope of the MLPCN. Therefore, the bar for project success was modified from the original goal from the CPDP “to find antagonists structurally distinct from current literature probes, with potencies of less than 1 μM for the kappa-opioid (KOP) receptor, with greater than 100-fold selectivity against the mu-opioid (MOP) receptor and 10-fold selectivity against the delta-opioid (DOP) receptor, or to the extent achievable by test concentration limitations.” As we achieved this with our first probe for NIDA, ML140 (CID342390), originally submitted February 27,2010 (https://mli.nih.gov/mli/?dl_id=1197), our 2nd generation probe should exceed the potency by at least 5–10 fold and selectivity improved beyond 25-fold.
Table 9
Comparison of prior art and current probe.
Background and Significance
For normal activities that produce rewards, there is a rapid habituation of the circuits involved and the behaviors will wane. However, for addictive drugs habituation does not occur and dopamine release persists despite repetitive trials. Upon withdrawal of the drug, a decrease of dopamine levels in the nucleus accumbens results, and this has been observed for opioids, cannabinoids, alcohol, amphetamines, and nicotine (1). This loss of dopamine accounts for the withdrawal syndromes observed with these drugs. The prototype opioid drug is morphine. It produces many effects typical of most opioids including analgesia, euphoria, nausea, and respiratory depression. Repeated use of opioids produces physical dependence and tolerance. These manifestations of opioid use are due to the three recognized types of opioid receptors that are members of the GPCR family, the mu (μ), delta (δ), and kappa (κ) subtype receptors. While stimulation of the mu and delta receptors increases dopamine release in the nucleus accumbens, κ opioid (KOP) receptor activation by its endogenous ligand dynorphin-A reduces extracellular dopamine. It has been suggested that stimulation of KOP receptor by endogenous opioids like dynorphins will produce an aversive state and thereby counter the effects of rewarding and addictive compounds like alcohol, cocaine and nicotine. Moreover, exogenous KOR agonists have also been observed to attenuate drug-taking behavior (2–6). However, it may be difficult to strike a balance between opposing the sense of reward gained by drugs of abuse and producing an aversive state; therefore, activation of the KOP receptor may not be therapeutically preferable. Although these statements appear contrary, KOP receptor agonists can both alleviate drug self-administration in animal models (most likely via dopamine regulation) and also trigger relapse. This conflicting dual action of KOP receptor agonists alludes to the complex physiological role of KOP receptors and underscores the need for a variety of chemical tools to facilitate their further investigation.
Intracranial self-stimulation has become a useful means of assessing reward thresholds in rodents and nonhuman primates. In essence, an animal will press a lever to electrically stimulate the brain via implanted probes. This “self stimulation” will be performed to a certain extent in training and that extent is an indication of the animal’s “reward threshold.” Administration of “drugs of abuse” have been shown to decrease this reward threshold such that the animal will seek less stimulation to achieve the desired effect. This model paradigm has been likened to positive hedonic states produced by drugs of abuse in human addicts. In rodents, the direct activation of KOP receptor using selective agonists increases reward thresholds (mimicking the withdrawal state) and creating a “depressive-like” state (where more self stimulation is required to achieve the desired effect). Treatment with antagonists has been shown to restore reward thresholds in this model (7,8). The restoration of reward thresholds may be a very important step in drug abuse treatment as drug cessation is strongly negatively reinforced by aversive feelings, which may be due to a increased reward threshold. Therefore, the development of KOP receptor antagonists may be particularly beneficial in “resetting” this threshold. Furthermore, since an increased reward threshold may manifest as a “depressive state,” then KOP receptor antagonists may also be beneficial for the treatment of depressive disorders. Currently, there are currently no approved agents or compounds for treating the altered reward pathways associated with drug addiction (2).
2. Materials and Methods
2.1. Assays
Table 1 summarizes the details for the assays that drove this probe project.
Table 1
Summary of assays and AIDs.
Unlike imaging or other second messenger assays, the DiscoveRx β-arrestin assay allows for a direct measure of GPCR activation by detection of β-arrestin binding to the KOP receptor. In this system, β-arrestin is fused to an N-terminal deletion mutant of β-gal (termed the enzyme acceptor of EA) and the GPCR of interest is fused to a smaller (42 amino acids), weakly complementing fragment termed ProLink™. In cells that stably express these fusion proteins, ligand stimulation results in the interaction of β-arrestin and the Prolink-tagged GPCR, forcing the complementation of the two β-gal fragments and resulting in the formation of a functional enzyme that converts substrate to detectable signal.
Assay materials
- OPRK1 β-Arrestin (DiscoveRx)
- Assay Medium: Opti-MEM Medium supplemented with 1% hiFBS, 1X Pen/Strep/Glu, 125 μg/mL Hygromycin (1/2 recommended), 250 μg/mL Geneticin (1/2 recommended)
- Growth Medium: MEM supplemented with 10% hiFBS, 1X Pen/Strep/Glu, 125 μg/mL Hygromycin (1/2 recommended), 250 μg/mL Geneticin (1/2 recommended)
Table 2Reagents used for the uHTS experiments
| Reagent | Vendor |
|---|---|
| OPRK1 β-Arrestin Cell Line | DiscoveRx |
| Assay Medium: Opti-MEM Medium supplemented with 1% hiFBS, 1X Pen/Strep/Glu, 125 μg/mL Hygromycin, 250 μg/mL Geneticin | Invitrogen |
| Growth Medium: MEM supplemented with 10% hiFBS, 1X Pen/Strep/Glu, 125 μg/mL Hygromycin, 250 μg/mL Geneticin | Invitrogen |
The following uHTS protocol was implemented at single point concentration confirmation
uHTS protocol
Day 1
- Harvest cells using Enzyme-Free Dissociation Buffer (Invitrogen Cat#13151-14). Add 500 cells/well in 5 uL of media to each well of a white, 1536 well plate.
- Spin cells at 500 rpm for 1 min, then wrap plates in Saran Wrap.
- Incubate overnight at 37°C with 5% CO2.
Day 2
- Using a Highres Biosolutions pintool pin 30 nL to wells. Columns 1–4 should be DMSO only (Control wells), Columns 5–48 contain test compounds (10μM final in well concentration).
- Immediately following pintool addition, add 1.0 uL of assay media to columns 1–2 and 1.0 uL of assay media containing 240 nM dynorphin A for a final assay concentration of 40 nM. Centrifuge plates at 500 rpm for 1 min immediately following additions.
- Incubate for 1hr and 30 minutes.
- During test incubation, prepare Detection Reagent Solution from DiscoveRx (1 part Galacton Star: 5 parts Emerald II and 19 parts Cell Assay Buffer)
- Add 2.5ul of detection reagent solution to each well.
- Incubate at room temperature for 60 min in the dark
- Read plates in a Perkin Elmer Envision using a luminescence protocol
Dose Response protocol
Day 1
- Harvest cells using Enzyme-Free Dissociation Buffer (Invitrogen Cat#13151-14). Add 500 cells/well in 5 uL of media to each well of a white, 1536 well plate.
- Spin cells at 500 rpm for 1 min, then wrap plates in Saran Wrap.
- Incubate overnight at 37°C with 5% CO2.
Day 2
- Using a Labcyte Echo, DMSO and test compounds are transferred to wells. DMSO only is transferred to columns 1–3 and 46–48(Control wells), while varying volumes of test compounds are transferred to columns 4–45 to achieve the desired test concentrations. Test compound wells in the assay plate are back-filled with DMSO to equalize final assay concentrations.
- Immediately following Echo transfer, 1.0 uL of assay media is added to columns 1–3 and 1.0 uL of assay media containing 240 nM dynorphin A is added to columns 4–48 for a final assay concentration of 40 nM. Centrifuge plates at 500 rpm for 1 min immediately following additions.
- Incubate for 1hr and 30 minutes.
- During test incubation, prepare Detection Reagent Solution from DiscoveRx (1 part Galacton Star: 5 parts Emerald II and 19 parts Cell Assay Buffer)
- Add 2.5ul of detection reagent solution to each well.
- Incubate at room temperature for 60 min in the dark
- Read plates in a Perkin Elmer Envision using a luminescence protocol
The average Z′ for the screen was 0.51, the signal to background (S/B) was 4.41, signal to noise (S/N) was 28.9 and signal to window was 4.26.
Rationale for confirmatory, counter and selectivity assays
The initial frontline counterscreen that was performed shortly following dose response confirmations on both the agonist and antagonist KOP receptor primary screens was the β-galactosidase dose response assay. Each confirmed hit (EC50 < 10 μM) was run in a β-gal dose response assay. Because the primary screen is based upon the formation of a functional β-gal enzyme upon β-arrestin migration to the GPCR, we wanted to rule out compound interaction, either stimulatory or inhibitory, with the β-gal enzyme in the absence of GPCR interaction.
The High-Content Imaging-based confirmatory (KOR) and selectivity assays (MOR, DOR) which are based upon the translocation of β-arrestin linked to GFP to other receptor subtypes were developed and performed to confirm antagonist activity in the KOP receptor antagonist primary assay, as well as to ascertain the selectivity of compounds for the KOP receptor vs. the MOP and DOP receptor sub-types.
Improved potency for KOP receptor and increased selectivity against MOP and DOP receptors were primary drivers for compound selection and optimization.
Confirmation assays
The initial confirmatory assays were performed in full dose-response for compounds from solvated DPI stock solutions to confirm activity seen first in test agents from screening library in the initial primary screen. Active compounds were then tested in an alternative format for inhibition of GPCR activation, via the imaging-based KOP receptor High-Content Transfluor Antagonist Assay. In the Transfluor assay, GPCR activation is measured indirectly by via the detection of β-Arrestin-GFP redistribution from the cytosolic compartment to the plasma membrane to coated pits and finally endosomal vesicles. The image-based KOP receptor assays allowed for independent confirmation of KOP receptor activation utilizing an alternative technology.
The following are confirmation assays for this project:
- Assay 1: HTS identification of small molecule antagonists of the kappa opioid receptor via a luminescent beta-arrestin assay (AID 1778)
- Assay 2: SAR analysis of small molecule antagonists of the kappa opioid receptor via a luminescent beta-arrestin assay (AID 2285)
- Assay 3: HTS Image-Based Screen for Selective Antagonists of the KOR Receptor (AID 2136)
- Assay 4: SAR analysis of Antagonists of the Kappa Opioid Receptor (KOR) using an Image-Based Assay (AID 2359)
Counterscreen assays
The β-Galactosidase Counterscreen Assay was utilized to ascertain possible enzyme inhibition, which might present the opportunity for false positives from the initial primary assay. The inhibition of activity of the b-galactosidase fragment complementation in the primary KOR1 β-Arrestin Assay in the presence of test agent could lead to decreased signal formation and therefore a false positive result. This counterscreen assay would allow for the detection of these artifactual compounds.
- Assay 1: HTS Dose response counterscreen for assays utilizing the enzyme, β-galactosidase (AID 1966)
Secondary Assays
The imaging-based MOP and DOP receptor High-Content Transfluor Antagonist Assays provide for the determination of KOP receptor selectivity. The probe criteria specifies the necessity of at least 100-fold selectivity against MOP and DOP receptors, or within the reasonable limitations imposed for testing compounds at high concentrations, i.e. 100 μM selectivity for a 1 μM compound.
- Assay 1: HTS Image-Based Screen for Antagonists of the MOR Receptor (AID 2344)
- Assay 2: HTS Image-Based Screen for Antagonists of the DOR Receptor (AID 2356)
- Assay 3: SAR Analysis of Antagonists of the MOR Receptor using an Image-Based Assay (AID 2420)
- Assay 4: SAR Analysis of Antagonists of the DOR Receptor using an Image-Based Assay (AID 2357)
2.2. Probe Chemical Characterization
a. Chemical name of probe compound [IUPAC name must match PubChem]
The IUPAC name of the probe, ML190, is N-(3-(4-(4-methoxyphenyl)piperazin-1-yl)propyl)-2-(1-methyl-6-oxopyrido[2,3-e]pyrrolo[1,2-a]pyrazin-5(6H)-yl)acetamide (PubChem currently does not have an IUPAC name). The actual batch prepared, tested and submitted to the MLSMR is SID88442997 corresponding to CID44665680.
b. Probe chemical structure including stereochemistry if known (indicate if racemic or diastereomeric)
One interesting chemical feature of this probe is that it is achiral, which is in contrast to previously known antagonists

c. Structural Verification Information of probe SID88442997 corresponding to CID44665680
Purity & Structure Proof by LC/MS: 95.2% (HPLC)
Mass Spec: HRMS (ESI) m/z calcd for C27H32N6O3 ([M+H]+), 489.2614, found 489.2600.
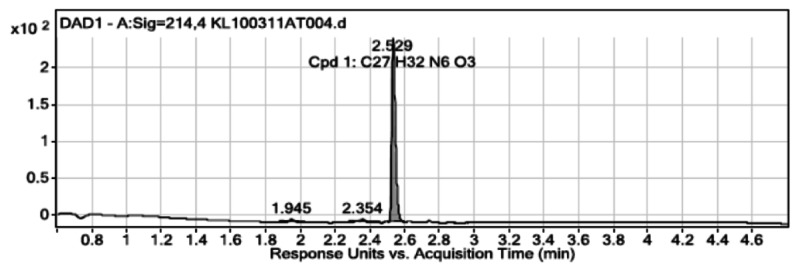
User Chromatogram Peak List
| Peak # | Compound Name | RT | Height | Height % | Area | Area % | Area Sum % | Width |
|---|---|---|---|---|---|---|---|---|
| 1 | 1.945 | 3.38 | 1.36 | 7.4 | 2.1 | 2 | 0.032 | |
| 2 | 2.354 | 3.59 | 1.45 | 10.35 | 2.93 | 2.79 | 0.04 | |
| 3 | Cpd 1: C27 H32 N6 O3 | 2.529 | 248.18 | 100 | 352.58 | 100 | 95.21 | 0.023 |

User Chromatogram Peak List
| Peak # | RT | Height | Height % | Area | Area % | Area Sum % | Width |
|---|---|---|---|---|---|---|---|
| 1 | 1.945 | 3.38 | 1.36 | 7.4 | 2.1 | 2 | 0.032 |
| 2 | 2.354 | 3.59 | 1.45 | 10.35 | 2.93 | 2.79 | 0.04 |
| 3 | 2.529 | 248.18 | 100 | 352.58 | 100 | 95.21 | 0.023 |

Purity by NMR & Structure Proof: >95% pure (1H NMR): 1H NMR (400 MHz, CDCl3) δ 8.17 (d, J = 4.9 Hz, 1H), 7.87 (dd, J = 1.4, 2.9 Hz, 1H), 7.33 (dd, J = 1.4, 4.0 Hz, 1H), 7.12 (s, 1H), 6.99 (d, J = 5.0 Hz, 1H), 6.84 (s, 4H), 6.68 (dd, J = 2.9, 4.0 Hz, 1H), 5.11 (s, 2H), 3.78 (s, 3H), 3.41 (dd, J = 5.8, 12.0 Hz, 2H), 3.02 – 2.91 (m, 4H), 2.74 (s, 3H), 2.63 – 2.54 (m, 4H), 2.49 (t, J = 6.4 Hz, 2H), 1.75–1.69 (m, 2H). 13C NMR (101 MHz, CDCl3) δ 167.9, 155.8, 153.8, 145.4, 143.2, 142.3, 134.8, 124.1, 122.8, 122.6, 120.4, 118.0, 114.4, 113.5, 113.4, 57.3, 55.6, 53.4, 50.4, 44.2, 39.4, 25.2, 22.8.

d. If available from a vendor, please provide details
This probe is not commercially available. The KSCC synthesized this compound and deposited 25 mg of newly synthesized material with the MLSMR (Bio-Focus DPI) (see Probe Submission Table 4 below).
Table 4
Probe and analog submissions to MLSMR (BioFocus DPI) for KOR antagonists.
e. Solubility and Stability of probe in PBS at room temperature
The probe, ML190, has a reasonable solubility of 12.9 μg/mL in 137 mM NaCl, 2.7 mM KCl, 10 mM sodium phosphate dibasic, 2 mM potassium phosphate monobasic, pH 7.4 (PBS) at room temperature (23°C). This is comparable to the solubility of 12.4 μg/mL in the phosphate-free buffer used by SBCCG’s Exploratory Pharmacology Group (see also related values detailed In vitro Pharmacology Profiles Table 7 in Sec. 3.6 below). At acidic pHs, the solubility of the probe improves dramatically to >90 μg/mL (see Table 7), presumably due to protonation of the secondary amine of the piperazine linker. ML190 has superior stability at room temperature in PBS in the absence of any antioxidants or other protectants (<0.1% DMSO v/v) with 94.42% of parent compound remaining after 48 hrs of incubation (see timecourse at right). Interestingly, it is rapidly lost when incubated at 37°C in PBS with only ~30% remaining after 3 hrs. This loss is completely ameliorated in the presence of 50% (v/v) mouse or human plasma (see Table 7).
Table 7
Summary of in vitro ADME properties of KOP receptor antagonist 2nd probe ML190.

f. A tabulation of calculated and known probe properties
Table 3ML190 (CID44665680)
| Calculated Property | Value |
|---|---|
| Molecular Weight | 488.58138 [g/mol] |
| Molecular Formula | C27H32N6O3 |
| XLogP3-AA | 2.7 |
| H-Bond Donor | 1 |
| H-Bond Acceptor | 6 |
| Rotatable Bond Count | 8 |
| Tautomer Count | 2 |
| Exact Mass | 488.253589 |
| MonoIsotopic Mass | 488.253589 |
| Topological Polar Surface Area | 82.9 |
| Heavy Atom Count | 36 |
| Formal Charge | 0 |
| Complexity | 752 |
| Isotope Atom Count | 0 |
| Defined Atom StereoCenter Count | 0 |
| Undefined Atom StereoCenter Count | 0 |
| Defined Bond StereoCenter Count | 0 |
| Undefined Bond StereoCenter Count | 0 |
| Covalently-Bonded Unit Count | 1 |
g. Provide MLS# that verifies the submission of probe molecule and five related samples that were submitted to the SMR collection
We submitted 25 mg of the probe and 20 mg of each of 5 analogs (Table 4.) to the NIH MLSMR on October 28, 2010.
2.3. Probe Preparation
The synthetic route to the probe, ML190, its characterization by 1H and 13C NMR, and its evaluation by HPLC and MS, are shown below. One interesting chemical feature of this probe is that it is achiral, which is in contrast to previously known antagonists. The experimental details and structural proof for all synthetic intermediates are also provided subsequently.
%202%2C5-dimethoxytetrahydrofuran%2C%20AcOH%3B%20(b)%20ammonia%2C%20MeOH%2C%20150%20%BAC%3B%20(c)%20triphosgene%2C%20toluene%3B%20(d)%20sodium%20hydride%2C%20methyl%20bromoacetate%2C%20DMF%3B%20(e)%20LiOH%2C%20MeOH%3ATHF%3AH2O%3B%20(f)%20acryl%20nitrile%3B%20(g)%20lithium%20aluminum%20hydride%2C%20ether%3B%20(h)%20DIC%2C%20DMAP%2C%20CH2Cl2&p=BOOKS&id=66151_ml190fu12.jpg "Click on image to zoom")
(a) 2,5-dimethoxytetrahydrofuran, AcOH; (b) ammonia, MeOH, 150 ºC; (c) triphosgene, toluene; (d) sodium hydride, methyl bromoacetate, DMF; (e) LiOH, MeOH:THF:H2O; (f) acryl nitrile; (g) lithium aluminum hydride, ether; (h) DIC, DMAP, CH2Cl2.

2-Fluoro-4-methyl-3-(1H-pyrrol-1-yl)pyridine: 2-fluoro-4-methylpyridin-3-amine (1.0 g, 7.93 mmol) and 2,5-dimethoxytetrahydrofuran (1.08 mL, 1.05 eqiv.) were suspended in 3 mL of acetic acid and refluxed for 2 hrs. The reaction was cooled down to room temperature. The solvents were removed and the residue was purified by silca gel chromatography (EtOAc/hexanes = 1:8, Rf = 0.3) to afford 1.0 g (72%) oil. 1H NMR (400 MHz, CDCl3) δ 8.10 (dd, J = 0.8, 5.1 Hz, 1H), 7.17 (d, J = 5.1 Hz, 1H), 6.74 (td, J = 2.1, 0.9 Hz, 2H), 6.40 (t, J = 2.1 Hz, 2H), 2.26 (s, 3H). 13C NMR (101 MHz, CDCl3) δ 160.2, 157.8, 149.6, 149.5, 145.5, 145.4, 123.80, 123.76, 122.1, 109.8, 17.29, 17.25. HRMS (m/z): calcd for C10H10FN2 (M+H) 177.0828; found 177.0827.

Richards, J.J.; Reed, C.S.; Melander, C., Bioorganic & Medicinal Chemistry Letters 18 (2008) 4325–4327.

4-Methyl-3-(1H-pyrrol-1-yl)pyridin-2-amine: 2-fluoro-4-methyl-3-(1H-pyrrol-1-yl)pyridine (3.9 g, 22.1 mmol) was dissolved in 80 mL of ammonia solution (7N in MeOH) in a sealed tube (350 mL). The mixture was heated at 150 °C for 2 days protected with a blast shield. The mixture was cooled to room temperature, then cooled in the ice for 30 min. The filtrate was evaporated to dryness and purified by flash chromatography (EtOAc/Hexanes = 1:1, Rf = 0.5) to give 2.9 g (76%) white solid. 1H NMR (400 MHz, CDCl3) δ 7.96 (d, J = 5.1 Hz, 1H), 6.67 (t, J = 2.1 Hz, 2H), 6.60 (d, J = 5.2 Hz, 1H), 6.41 (t, J = 2.1 Hz, 2H), 4.52 (s, 2H), 2.02 (s, 3H). 13C NMR (101 MHz, CDCl3) δ 156.1, 147.2, 145.9, 121.5, 121.2, 116.0, 110.0, 16.7. HRMS (m/z): calcd for C10H12N3 (M+H) 174.1031; found 174.1026. (Peet, N. P.; Sunder, S. Heterocycles 1986, 24, 3213–3221)

1-Methylpyrido[2,3-e]pyrrolo[1,2-a]pyrazin-6(5H)-one: 4-methyl-3-(1H-pyrrol-1-yl)pyridin-2-amine (1.0 g, 5.8 mmol) and triphosgene (2.6 g, 8.7 mmol) were dissolved in 100 mL of toluene. The mixture was refluxed for 3 h, then cooled to room temperature. The red solid was collected after filtration and washed with CH3CN. 0.5 g (43%). The material was used directly for next step reaction without purification. 1H NMR (400 MHz, DMSO) δ 11.64 (s, 1H), 8.15 (dd, J = 1.4, 2.9 Hz, 1H), 8.13 (d, J = 4.9 Hz, 1H), 7.20 – 7.08 (m, 2H), 6.75 (dd, J = 2.9, 3.9 Hz, 1H), 2.81 (s, 3H).


Methyl 2-(1-methyl-6-oxopyrido[2,3-e]pyrrolo[1,2-a]pyrazin-5(6H)-yl)acetate: To a solution of 1-methylpyrido[2,3-e]pyrrolo[1,2-a]pyrazin-6(5H)-one (50 mg, 0.25 mmol) in 2 mL of DMF, was added NaH (60%, 11 mg, 0.28 mmol). The mixture was stirred at room temperature for 1 h. Methyl bromoacetate (26 mL, 0.28 mmol) was added. The mixture was stirred for 16 h. Solvents were removed under vacuum and the residue was purified by silca gel flash chromatography (DCM/MeOH = 1:10, Rf = 0.5) to afford 37 mg (54%) light yellow solid). 1H NMR (400 MHz, CDCl3) δ 8.15 (d, J = 4.9 Hz, 1H), 7.95 (dd, J = 1.5, 2.9 Hz, 1H), 7.36 (dd, J = 1.5, 4.0 Hz, 1H), 7.00 (d, J = 4.9 Hz, 1H), 6.71 (dd, J = 2.9, 4.0 Hz, 1H), 5.25 (s, 2H), 3.77 (s, 3H), 2.83 (s, 3H). 13C NMR (101 MHz, CDCl3) δ 169.3, 155.5, 143.1, 142.1, 134.8, 124.2, 122.7, 122.6, 120.4, 113.5, 113.4, 52.3, 41.9, 22.9. HRMS (m/z): calcd for C14H14N3O3 (M+H) 272.1035; found 272.1042.

2-(1-Methyl-6-oxopyrido[2,3-e]pyrrolo[1,2-a]pyrazin-5(6H)-yl)acetic acid: methyl 2-(1-methyl-6-oxopyrido[2,3-e]pyrrolo[1,2-a]pyrazin-5(6H)-yl)acetate (517 mg, 1.91 mmol) was dissolved in 20 mL of MeOH/H2O/THF (1:1:4). LiOH (68.5 mg, 2.86 mmol) was added. The mixture was stirred at room temperature for 16 h. The solvents were removed and residue was dissolved in water, washed with ether, then neutralized with 2N HCl to pH = 3. 356 mg (73%) white solid was obtained after filtration and dried under vacuum. 1H NMR (400 MHz, DMSO) δ 12.90 (s, 1H), 8.27 – 8.17 (m, 2H), 7.29 – 7.19 (m, 2H), 6.80 (dd, J = 2.9, 3.9 Hz, 1H), 5.02 (s, 2H), 2.85 (s, 3H). 13C NMR (101 MHz, DMSO, APT) δ 169.8, 154.5, 143.1, 141.4, 135.9, 123.9, 123.3, 122.8, 119.5, 113.3, 112.7, 41.6, 22.2. HRMS (m/z): calcd for C13H12N3O3 (M+H) 258.0879; found 258.0894.

3-(4-(4-Methoxyphenyl)piperazin-1-yl)propanenitrile: 4-methoxyphenypiperazine (0.92 g, 4.68 mmol) and acrylonitrile (0.31 mL, 4.68 mmol) were mixed in a 10 mL reaction tube and stirred for 16 h. The product was purified by sical gel flash chromatography (EtOAc/hexanes = 1:8, Rf = 0.3) to give 0.8 g (74%) white solid. 1H NMR (400 MHz, CDCl3) δ 6.98 – 6.90 (m, 2H), 6.90 – 6.82 (m, 2H), 3.79 (s, 3H), 3.17 – 3.07 (m, 4H), 2.78 (t, J = 7.0 Hz, 2H), 2.74 – 2.64 (m, 4H), 2.57 (t, J = 7.0 Hz, 2H). 13C NMR (101 MHz, CDCl3) δ 154.0, 145.5, 118.8, 118.4, 114.5, 55.6, 53.4, 52.8, 50.6, 15.9. [Upadhayaya, R.S.; Sinha, N.; Jain, S.; Chandrab, N.K.R. and Arora, S. K. Bioorganic & Medicinal Chemistry 12 (2004) 2225–2238]

3-(4-(4-Methoxyphenyl)piperazin-1-yl)propan-1-amine: A solution of 3-(4-(4-methoxyphenyl) piperazin-1-yl)propanenitrile (0.8 g, 3.26 mmol) in 15 mL ether was added to the suspension of LiAlH4 (0.19 g, 4.89 mmol) in 5 mL of ether. The mixture was stirred at room temperature for 16 h. Then quenched with 2N NaOH (1 mL). The ether phase was dried over MgSO4 and evaporated to dryness to give 0.68 g (84%) white solid, which was used directly without further purification. 1H NMR (400 MHz, CDCl3) δ 6.89 (d, J = 9.1 Hz, 2H), 6.82 (d, J = 9.1 Hz, 2H), 3.75 (s, 3H), 3.15 – 3.04 (m, 4H), 2.87 (s, br. 2H), 2.76 (t, J = 6.8 Hz, 2H), 2.67 – 2.53 (m, 4H), 2.51 – 2.37 (m, 2H), 1.75 – 1.54 (m, 2H). 13C NMR (101 MHz, CDCl3) δ 153.8, 145.7, 118.1, 114.4, 56.4, 55.5, 53.48, 50.6, 40.6, 30.1.

Valenta, V.; Vlkova, M.; Holubek, J.; Svatek, E.; Metysova, J.; Protiva, M. Collect. Czech. Chem. Commun. 1990, 55, 797–808

N-(3-(4-(4-Methoxyphenyl)piperazin-1-yl)propyl)-2-(1-methyl-6-oxopyrido[2,3-e] pyrrolo [1,2-a] pyrazin-5(6H)-yl)acetamide: 2-(1-methyl-6-oxopyrido[2,3-e]pyrrolo[1,2-a]pyrazin-5(6H)-yl)acetic acid (30 mg, 0.12 mmol), 3-(4-(4-methoxyphenyl)piperazin-1-yl)propan-1-amine (43.6 mg, 0.17 mmol) and DMAP (1.4 mg, 0.012 mmol) were dissolved in 1 mL of DCM. Diisopropylcarbodiimide (0.09 mL, 0.58 mmol) was added. The mixture was stirred at room temperature for 16 h. And the product was purified by silica gel flash chromatography (DCM/MeOH = 10 :1, Rf= 0.5) to give 30 mg (53%) white solid. 1H NMR (400 MHz, CDCl3) δ 8.17 (d, J = 4.9 Hz, 1H), 7.87 (dd, J = 1.4, 2.9 Hz, 1H), 7.33 (dd, J = 1.4, 4.0 Hz, 1H), 7.12 (s, 1H), 6.99 (d, J = 5.0 Hz, 1H), 6.84 (s, 4H), 6.68 (dd, J = 2.9, 4.0 Hz, 1H), 5.11 (s, 2H), 3.78 (s, 3H), 3.41 (dd, J = 5.8, 12.0 Hz, 2H), 3.02 – 2.91 (m, 4H), 2.74 (s, 3H), 2.63 – 2.54 (m, 4H), 2.49 (t, J = 6.4 Hz, 2H), 1.75–1.69 (m, 2H). 13C NMR (101 MHz, CDCl3) δ 167.9, 155.8, 153.8, 145.4, 143.2, 142.3, 134.8, 124.1, 122.8, 122.6, 120.4, 118.0, 114.4, 113.5, 113.4, 57.3, 55.6, 53.4, 50.4, 44.2, 39.4, 25.2, 22.8. HRMS (m/z): calcd for C27H33N6O3 (M+H) 489.2609; found 489.2600.

3. Results
After primary HTS and hit confirmation phase of the project, we initially identified 3 chemotypes, which were the subject of an earlier Center Probe Report for KOR antagonists. Through continued hit confirmation an additional chemotype was identified as a novel and promising scaffold for SAR optimization. This scaffold contained a pyrrolopyrazine and a p-methoxyphenyl substituted piperazine moiety and subsequent SAR led to the present probe which has an potency of 120 nM IC50 for KOR as measured by the DiscoveRx β-arrestin technology which estimates a >267-fold selectivity against both the MOP and DOP receptors (measured by HCS). The apparent higher KOR potency of the probe (3 nM IC50) in the HCS Transfluor assay for β-arrestin translocation is unexpected. The KOR potency estimates for our previously reported probe, ML140 (CID3342390), were 850 nM and 1310 nM, by DiscoveRx and Transfluor methods, respectively. The following subsections provide in-depth details and discussion of the screening, hit follow-up, subsequent SAR development, and characterization of the biological and chemical properties/liabilities of the probe.
3.1. Summary of Screening Results
The following flowchart summarizes the compound triage and decision tree for advancement of compounds:

Primary Screen/Confirmation Triage
A library of approximately 290,000 compounds was tested in the KOR1 DiscoveRx β-arrestin primary screen. Upon data analysis, 606 hits with activity >50% at a single concentration point of 10 μM were identified. Liquid samples were then ordered through DPI and 531 compounds were received.
The compound solutions resupplied by the MLSMR were first confirmed in 10 μM single-point duplicate in the KOR1 DiscoveRx β-arrestin primary assay. Of these, 213 compounds were confirmed to have at least 50% activity at a 10 μM assay concentration (see Critical Path flowchart below).

Critical Path Flowchart for KOR Antagonist Project
(revised as per 10/23/09 CPDP Chem Update telecon)
The confirmed compounds were further tested in dose response in the KOR1 DiscoveRx β-arrestin primary assay to obtain EC50 values and were also tested in a β-galactosidase Counterscreen assay to assess the possibility that these compounds might inhibit the enzyme. The KOR1 antagonist dose response experiments revealed 148 compounds with EC50 potencies at or below 10 μM. Twenty-nine of the compounds were eliminated from future consideration because they were found to inhibit β-galactosidase activity in the enzymatic counterscreen.
The active, confirmed compounds were then tested in the KOR1 High-Content Transfluor Antagonist assay for further confirmation, then in the MOR and DOR High-Content Transfluor Antagonist assays to determine subtype selectivity.
Chemistry and cheminformatics resources were then employed in the selection of both novel and chemically tractable molecules to pursue for a KOR selective probe. Structures of interest and analogs thereof were either purchased as commercial dry powders. In total, 32 structures were received from commercial vendors. These constituted the SAR driving chemistries from which the KOR1 antagonist probe candidate and analogs emerged.
SAR testing of re-constituted powders encompassed dose response testing of compounds in four assays: KOR1 DiscoveRx β-arrestin Antagonist assay, the KOR High-Content Transfluor Antagonist assay, and the MOR and DOR High-Content Transfluor Antagonist assays.
3.2. Dose Response Curves for Probe
The normalized dose response curves for inhibition of the κ- μ-, and δ-opioid receptor (KOR, MOR, and DOR, respectively) signaling stimulated by 240 nM dynorphin A agonist by the probe ML190 CID44665680, SID88442997) are show in the graphs below. For the κ-opioid receptor the responses from both the primary luminescent screen DiscoveRx β-arrestin binding assay from lysed cell and the Transfluor HCS β-arrestin translocation imaging-based assay are also plotted. The greater potency of the probe in the HCS system (3 nM IC50) compared to the DiscoveRx (DRx) system (120 nM IC50) is somewhat unexpected as noted previously. There is essentially no dose-responsiveness of the MOR and DOR HCS systems. This is in contrast to our prior KOR antagonist probe ML140 (CID3342390) where the potencies are very close between the two assay technologies (850 nM by DRx versus 1310 nM by HCS) (https://mli.nih.gov/mli/?dl_id=1197).

3.3. Scaffold/Moiety Chemical Liabilities
This scaffold contains no reactive moieties or functional groups known to form covalent bonds. The amide bond linking the two hemispheres of the probe molecule provides a facile site for metabolism of the compound in vivo.
3.4. SAR Tables
During the HTS and continuted hit confirmation phase of the project, an additional chemotype emerged presently, as a novel and promising scaffold for SAR optimization (Figure 1). Two compounds, CID 22553442 and CID 22522554, were found to possess promising antagonist activity in preliminary β-arrestin assays (AID 1778 and AID 1785) while four additional compounds were found to have IC50 values above ten micromolar. Notably, both active compounds contained a p-methoxyphenyl substituted piperazine moiety and a pyrrolopyrazine moiety.

Figure 1
Preliminary screening of hit structures.
SAR Analysis. A single round of SAR comprised of 8 commercial and 18 synthesized analogs were screened in both the KOP receptor β-arrestin assay and secondary, high content transfluor assays for KOP, DOP and MOP receptor activities. These results are summarized in Tables 5 and 6. Impressively, the incorporation of a single methyl group on the heterocyclic core increased the potency of the p-methoxyphenyl substituted piperazine analog by over ten fold in the β-arrestin assay and afforded a KOP receptor-selective compound with a more potent IC50 of 120 nM (Table 5. entry 1, CID 44665680, ML190). While less potent than JDTic (CID 9956146, IC50 = 0.02 nM), this compound (CID 44665680, ML190) is over >267-fold selective for the KOP receptor over both the DOP and MOP receptors, an improved selectivity compared to JDTic (202-fold selective for the KOP over the MOP receptor). The most valuable attribute of this probe lies in its structural novelty compared to JDTic and other established KOP receptor-selective compounds. Such novel structural chemotypes could possess subtle variations in their interactions with the KOP receptor that would be useful in the investigation into the precise signaling pathways involved with KOP receptor modulation. The discovery of new structural chemotypes for KOR research was the main objective of this project as established in our approved Chemical Probe Development Plan (CPDP). Further pharmacodynamic studies in animal behavioral models are required to determine if the ultimate objective finding shorter acting antagonists has been achieved, as there are no predictive in vitro assays to evaluate this. These studies are beyond the scope and funding of the Molecular Libraries Program for this present probe report.
Table 5
SAR analysis for selective κ–opioid receptor antagonist for the tricyclic lactam scaffold.
Table 6
SAR analysis for selective κ–opioid receptor antagonist for the tricyclic lactam scaffold.
The modular synthetic route developed here can readily provide access to the requisite quantities necessary for the advanced assays and in vivo studies needed to determine the binding profile of ML190. The present synthetic methods also allow for the synthesis of additional analogues to augment the limited set of analogues discussed here. Based on these merits, the compound (CID 44665680, ML190) is nominated as a probe compound. Several other compounds sharing the additional methyl group also exceeded the probe criteria to a lesser extent (Table 5., entries 2 through 5). The 2,4-dimethoxy analogue (entry 2, CID 44665679) is only slightly less potent in both the β-arrestin and transfluor assays, suggesting that additional analogues exploring the methoxy substitution patern could be a fruitful area for followup SAR studies. That five individual compounds of this chemotype possess submicromolar potency is encouraging for the potential to incorporate tracking moieties such as bromo or azide (the 4-chloro analogue is particularly relevant here). The present probe candidate is of adequate potency and high KOR selectivity for utilization in additional studies in KOR research or could be further refined through additional rounds of SAR to optimize potency or improve other characteristics desirable to individual research groups. The scaffold is highly amenable to modification via the present synthetic route and the effects of varying the substitution of this chemotype have only begun to be explored.
The analogues shown in Table 6 contain slightly greater structural variation than those above and most of these changes conferred a drastic loss in activity. The compounds in entries 8 (CID 45479166) and 9 (CID 45479168) demonstrate the connection between tether length and activity. While not an exhaustive study, the lower activity of both the two carbon and four carbon tether analogues supports the three-carbon tether length of the probe candidate as the optimal length. Entries 6 (CID 22553452) and 7 (CID 22553453) contain compounds that could provide lead structures for a MOP receptor-selective compound based on the present scaffold.
3.5. Cellular Activity
The probe molecule has demonstrated potent 120 nM IC50 (DiscoveRx) antagonist activity in both the primary enzyme complementation assay for inhibition of β-arrestin mediated signaling of the kappa opioid receptors, with > 267-fold selectivity for inhibition of activation over the mu- and delta opioid receptors of the selectivity is calculated for the HCS vs. DiscoveRx values. Unexpectedly, these have even higher apparent potency (3 nM IC50) when ascertained by the High-Content imaging assay versus the plate-reader based DiscoveRx luminescent assay (see cover page), with then provides an even higher selectivity of >10,700-fold over the mu- and delta-opioid receptors, comparing HCS to HCS IC50 values. As all of these assay are cell-based functional signaling assays, therefore by definition they have cellular activity and are expected have some cell permeability. Consistent with this is the finding that the probe has excellent PAMPA and moderate Blood-Brain-Barrier PAMPA permeability (see below in Table 7 In vitro ADMET properties). The hepatocyte toxicity (see Table 7 In vitro ADMET properties) estimates are still pending, and are expected shortly.
3.6. Profiling Assays
In vitro Pharmacology Profiles conducted by SBCCG Exploratory Pharmacology group of Probe CID44665680 [ML190] (See Table 7 below).
The probe, ML190 (CID44665680), had very high solubility of 96.6 μg/mL and 90.6 μg/mL at pH 5.0 and 6.2 respectively. This could be due to the protonation of one tertiary amine(s) of the piperazine linker (pKa’s of ~5.8 and 9.5), consistent with decreasing solubility as the pH increases. At pH 7.4 in phosphate-free buffer, the solubility was a moderate 12.4 μg/mL, comparable to the 12.9 μg/mL in PBS consistent with the little effect of phosphate effect or ionic strength on solubility. This probe ML190 has superior solubility compared the previous probe ML140 (less than 0.8 μg/mL at all pH’s tested).
The PAMPA (Parallel Artificial Membrane Permeability Assay) assay is used as an in vitro model of passive, transcellular permeability. An artificial membrane immobilized on a filter is placed between a donor and acceptor compartment. At the start of the test, drug is introduced in the donor compartment. Following the permeation period, the concentrations of drug in the donor and acceptor compartments are measured using UV spectroscopy. In this assay, the probe, CID44665680, had a moderate permeability (Pe) of 27 ×10−6 cm/s at pH 5 that rapidly increased to 757 ×10−6 cm/s as the pH rose to 7.4, consistent with loss of protonation and positive charge, which would improve permeability. This probe exhibited moderate permeability in the blood brain barrier (BBB-Pe) PAMPA assay of 51 ×10−6 cm/s. By comparison our first antagonist [ML140] CID03342390 have very poor solubility (< 1 μg/mL at all pHs), but very good Pe (>1710–1940 ×10−6 cm/s) and BBB-Pe (419 ×10−6 cm/s).
Plasma Protein Binding is a measure of a drug’s efficiency to bind to the proteins within blood plasma. The less bound a drug is, the more efficiently it can traverse cell membranes or diffuse. Highly plasma protein bound drugs are confined to the vascular space, thereby having a relatively low volume of distribution. In contrast, drugs that remain largely unbound in plasma are generally available for distribution to other organs and tissues. The probe, CID44665680, is highly bound (80 – 94%) to both human and mouse plasma.
Plasma Stability is a measure of the stability of small molecules and peptides in plasma and is an important parameter, which strongly can influence the in vivo efficacy of a test compound. Drug candidates are exposed in plasma to enzymatic processes (proteinases, esterases), and they can undergo intramolecular rearrangement or bind irreversibly (covalently) to proteins. The probe, CID44665680, shows excellent stability (100% remaining after 3 hrs at 37°C) in both human and mouse plasma. Interestingly, in the companion control experiments without plasma, the probe rapidly is lost (~30% remaining), so its strong binding to protein also stabilizes it.
The microsome stability assay is commonly used to rank compounds according to their metabolic stability. This assay addresses the pharmacologic question of how long the parent compound will remain circulating in plasma within the body. The probe, CID44665680, is rapidly metabolized in both human or mouse microsomes with 22% and 7.3 % remaining after 1 hr. Data for toxicity to human hepatocyctes is pending and should be available shortly.
Profiling against other GPCRs. The probe, ML190 (CID44665680), was submitted to the Psychoactive Drug Screening Program (PDSP) at the University of North Carolina (PDSP, Bryan Roth, PI) and the data received to date for the probe CID44665680 against a GPCR binding assay panel is shown in Table 8. Overall, this 2nd probe shows a slightly cleaner binding profile than our Centers’ prior antagonist probe ML140 (CID3342390), although this probe does posses a rather high affinity for the D3 receptor (250 nM vs. 1,234 for ML140). This affinity, while not optimal, may also encourage its development as a D3 receptor antagonist. Compounds of this type have also shown great promise in the treatment of addictive disorders (9). The binding Ki from the PDSP for ML190 of 129 nM is in excellent agreement with the 120 nM (DiscoveRx) estimate for the IC50 inhibition of KOR response to dynorphin A. At this time, the results for the secondary binding assays are pending for the DAT secondary assays. The primary binding assay values (performed at 10 μM) was 57% for DAT, which is only marginally over the hit threshold for significant inhibition of 50% (10).
Table 8
Receptor profiling of KOP receptor antagonist ML190 (CID44665680).
Profiling against the NCI cell line panel. The probe, ML190,, was submitted to the Developmental Therapeutics Program (DTP) for screening against the NCI-60 panel of human tumor cell lines. The compound was screened against each cell line in a single dose at 10 μM and the results summarized on the next page. No significant inhibition of tumor cell growth was observed and the compound was not selected for additional screening. The absence of selective cytotoxicity is not surprising given that the compound was developed to target the KOR. In fact, inhibition of cellular growth in this panel would have been cause for concern that the compound might possess general cellular toxicity.

Developmental Therapeutics Program One Dose Mean Graph
4. Discussion
The criteria for probe as defined in the CPDP Chem Update document filed on October 28, 2009 and revised and re-filed on November 21, 2009, and finally re-filed after corrections requested by NIH on January 12, 2010 with the NIH PT were: a potency for KOP receptor of less than 1 μM, and at least 100-fold selectivity over MOP and 10-fold selectivity over DOP receptors or as obtained by the achievable test concentrations, (e.g. solubility limited). This current antagonist is a novel scaffold compared to those in the literature and exceeds all the criteria for KOP receptor potency (120 nM by DiscoverRx) and for DOP and MOP receptor selectivity when assessed by the ratio of the DiscoveRx IC50 for KOP compared to the MOP or DOP receptor HCS IC50 values (>267-fold). This probe also significantly exceeds the first KOP receptor antagonist probe ML140 (CID3342390) originally filed February 27, 2010, revised several times and filed in final revised form on Sept 15, 2010 after review by an External Scientific panel convened in June 2010 and feedback with the NIH PT the August 5, 2010.
In this probe report, we describe the discovery and optimization of a novel more potent antagonist (120 nM by DiscoveRx) for the kappa-(κ)opioid (KOP) receptor that is >267-fold selective over the mu-(μ) (MOP) and the delta-(δ) (DOP) opioid receptors. Importantly, this probe and its analogs represent a novel chemical class compared to current literature antagonists and our previously submitted probe, ML140. Accordingly, this probe and its analogs may serve as interesting tools to advance addiction research. Additionally, this new chemotype is less complicated compared to known KOP receptor antagonist compounds. The structure contains no stereochemical centers and the short, versatile synthetic route enables both the synthesis of potential analogs and the production of the compound on larger scale.
4.1. Comparison to existing art and how the new probe is an improvement
As described in the CPDP these studies are now on-going in the assay provider’s and collaborating laboratories, as post-probe nomination research and we hope to publish jointly in the future. Additionally, we sent the probe ML190 for broad GPCR paneling and the results are in Table 8, and as noted this probe is “cleaner” against all the other tested GPCR, though it has a 250 nM Ki for D3 vs. 1,234 nM for ML140. Furthermore, the relatively good agreement among the GPCR panel, cell-based β-arrestin mediated enzyme complementation assay and the more downstream image based β-arrestin mediated G-protein redistribution with these compounds is notable.
As defined in the CPDP and the initial teleconference calls with the National Institute on Drug Abuse, this probe project was unusual as there are already examples of very potent agonists and antagonists of the kappa-opioid receptors with low nanomolar EC50 and IC50s, that are very selective against the mu- and delta- opioid subtypes. As emphasized during those initial discussions, the overarching purpose was to find new chemical scaffolds that are chemically distinct from the rich literature of known agonists and antagonists as starting points for further synthesis and work by the assay provider's lab and their collaborative chemists. Furthermore, NIDA is ultimately interested in new antagonists that are short acting. While these animal model studies are out of scope of the MLPCN and indeed would take much more compound and more time than a probe nomination project, NIDA was clear that new scaffolds would be a key measure of success.
As a comparative measure, the following tables summarize our antagonist probe against the precedent state-of-art probes. The binding Ki from the PDSP for ML190 (CID44665680) of 129 nM is in excellent agreement with the 120 nM (DiscoveRx) estimate of IC50. JDTic is entering an IND phase (communication by Assay Provider), but it is still a long-acting drug. It is hoped that the current probe may be a short acting probe. Our first probe was found to rapidly wash-out suggesting that it was in rapid equilibrium with a high-off rate and suggesting that it could be short acting.
This probe exceeds both the potency and selectivity criteria set by our revised CPDP Chem Update by more than 5-fold. The assay provider is interested in this structure and finds the SAR intriguing. We consider this probe and project to be an unmitigated success in achieving the goals of defining a novel chemical scaffold that may well have different and interesting pharmacological properties than the current literature examples. We await the eventual evaluation of this probe in NIDA’s model for drug wash-out and pharmacodynamic efficacy and confirmation of a short duration of action.
4.2. Mechanism of Action Studies
Dr. Bohn, the assay provider’s collaborator performed follow-up studies to verify where in the pathway for GPCR activation of the KOP receptor the probes acted. The probe and an isosteric analog lacking the 4-methyl substitution and the nitrogen heteroatom of the pyridine group in the probe were selected for study. Nor-BNI was used as a control.
The probe was found to be a potent inhibitor of the 35S-GTPγS Coupling indicating a direct functional effect on G-coupling. Potency was comparable to the Transfluor HCS assay.

Antagonists: 35S-GTPγS Coupling
| Ligand | IC50, nM | Imax (% NBNI) |
|---|---|---|
| Nor-BNI | 4.64 ± 0.83 | 101 ± 1 |
| 22553442 | 95.7 ± 48 | 122 ± 5 a |
| 44665680 | 434.2 ± 154.1 a | 177 ± 5 a |
n≥3 curves performed in duplicate.
Ligand vs NBNI:
- a
p<0.05; t-test. n≥3.
The probe was also a potent inhibitor of the downstream ERK 1/2 Activation pathway, whose potency was comparable to the Transfluor HCS assay.

Antagonists: ERK 1/2 Activation
| Ligand | IC50, nM | Imax (% NBNI) |
|---|---|---|
| Nor-BNI | 4.46 ± 0.64 | 100 ± 0.3 |
| 22553442 | 65.0 ± 9.2 a | 101 ± 3 |
| 44665680 | 330.0 ± 29.4 a,b | 90 ± 2 a |
n≥3 curves performed in replicates of 6.
Ligand vs NBNI:
- a
p<0.001.
Ligand vs 22553442:
- b
p<0.001, t-test.
Interestingly, it appears that when KOR β-arrestin potencies are enhanced, the G protein coupling and ERK activation potencies are diminished. This could be an example of functional selectivity.
4.3. Planned Future Studies
Of particular interest is whether the probe is long or short acting at the KOR, and studies of this question in cells and animal models may clarify as to whether the underlying mechanism for antagonist anti-addictive behavior requires activation of JNK. The previously reported probe, ML140 (CID3342390) has been shown in preliminary studies to be short acting in the mouse brain, appearing in the brain 2 h following i.p injection and being completely washed out after 24 h. The behavior of CID3342390 is distinct from that of nor-BNI, which is still largely present in the brain over the same time course. Having shown that it is possible for small molecule KOR antagonists to show this type of KOR PK profile, similar studies are underway with the presently proposed probe. Studies of this question in cells and animal models may clarify as to whether the underlying mechanism for antagonist anti-addictive behavior requires activation of JNK.
Three of the most potent and selective of the KOR antagonists, NorBNI, GNTI, and JDTic have been recognized for their long acting properties at the KOR that may be associated with JNK activation. While they have common structural features their differences are sufficient to cloud the SAR that underlies this long acting physiological behavior that can be blocked by reversible nonselective opioid antagonists. It is therefore important to determine how this selective, nanomolar probe functions at the KOR with respect to NorBNI, GNTI, and JDTic (see Table 9).
If the potency of this probe can be further improved to subnanomolar potency (Ki) it can be radiolabeled to serve as a key probe for receptor distribution and internalization studies, as well as a probe to map out the contribution of different steps along the β-arrestin mediated signaling pathway in cells.
The probe is approaching the range of potencies where initial dosing in small animals might be considered, though determination of it’s reversibility need to be established as a preamble to determining if the probe is short acting at the KOR, which would give it a decided advantage over current compounds under consideration as drugs. This probe may be a candidate for future extended characterization and small animal dosing for exposure by SBCCG’s Exploratory Pharmacology group prior to advanced studies by the assay provider and by NIDA.
5. References
- 1.
- Cami J, Farre M. Drug addiction. N Engl J Med. 2003;349:975. [PubMed: 12954747]
- 2.
- Prisinzano TE, Tidgewell K, Harding WW. Kappa opioids as potential treatments for stimulant dependence. Aaps J. 2005;7:E592. [PMC free article: PMC2751263] [PubMed: 16353938]
- 3.
- Xuei X, Dick D, Flury-Wetherill L, Tian HJ, Agrawal A, Bierut L, Goate A, Bucholz K, Schuckit M, Nurnberger J Jr, Tischfield J, Kuperman S, Porjesz B, Begleiter H, Foroud T, Edenberg HJ. Association of the kappa-opioid system with alcohol dependence. Mol Psychiatry. 2006;11:1016. [PubMed: 16924269]
- 4.
- Prisinzano TE. Psychopharmacology of the hallucinogenic sage Salvia divinorum. Life Sci. 2005;78:527. [PubMed: 16213533]
- 5.
- Hasebe K, Kawai K, Suzuki T, Kawamura K, Tanaka T, Narita M, Nagase H. Possible pharmacotherapy of the opioid kappa receptor agonist for drug dependence. Ann N Y Acad Sci. 2004;1025:404. [PubMed: 15542743]
- 6.
- Metcalf MD, Coop A. Kappa opioid antagonists: past successes and future prospects. AAPS J. 2005;7:E704. [PMC free article: PMC2751273] [PubMed: 16353947]
- 7.
- Glick SD, Maisonneuve IM, Raucci J, Archer S. Kappa opioid inhibition of morphine and cocaine self-administration. Brain Res. 681:147. [PubMed: 7552272]
- 8.
- Bruijnzeel AW. Kappa-opioid receptor signaling and brain reward function. Brain Res. Rev. 62:127. [PMC free article: PMC2787673] [PubMed: 19804796]
- 9.
- Heidbreder CA, Newman AH. Current perspectives on selective dopamine D(3) receptor antagonists as pharmacotherapeutics for addictions and related disorders. Ann N Y Acad Sci. 1187:4. [PMC free article: PMC3148950] [PubMed: 20201845]
- 10.
- Detailed protocols for all assays are available online (http://pdsp
.med.unc.edu /UNC-CH%20Protocol%Book.pdf). - 11.
- Thomas JB, Atkinson RN, Rothman RB, Fix SE, Mascarella SW, Vinson NA, Xu H, Dersch CM, Lu Y, Cantrell BE, Zimmerman DM, Carroll FI. Identification of the first trans-(3R,4R)-dimethyl-4-(3-hydroxyphenyl)piperidine derivative to possess highly potent and selective opioid kappa receptor antagonist activity. J. Med. Chem. 44:2687. [PubMed: 11495579]
- 12.
- Lipkowski AW, Nagase H, Portoghese PS. A novel pyrole synthesis via reaction of ketones with N-aminoimides. Tet. Lett. 27:4257.
- 13.
- Portoghese PS, Lipkowski AW, Takemori AE. Binaltorphimine and nor-binaltorphimine, potent and selective κ-opioid receptor antagonists. Life Sciences. 40:1287. [PubMed: 2882399]
- 14.
- Portoghese PS, Lipkowski AW, Takemori AE. Bimorphinans as highly selective, potent κ opioid receptor antagonists. J. Med. Chem. 30:238. [PubMed: 3027336]
- 15.
- Jones RM, Hjorth SA, Schwartz TW, Portoghese PS. Mutational Evidence for a common κ antagonist binding pocket in the wild-type κ and mutant μ[K303E] opioid receptors. J. Med. Chem. 41:4911. [PubMed: 9836606]
Appendix. Synthetic procedures and compound characterization
A pdf of KU synthesis details for all analogs made for this project will be appended or supplied searately to this report.
Additional Characterization of SAR compounds

2-fluoro-4-methyl-3-(1H-pyrrol-1-yl)pyridine: 2-fluoro-4-methylpyridin-3-amine (1.0 g, 7.93 mmol) and 2,5-dimethoxytetrahydrofuran (1.08 mL, 1.05 eqiv.) were suspended in 3 mL of acetic acid and refluxed for 2 hrs. The reaction was cooled down to room temperature. The solvents were removed and the residue was purified by silca gel chromatography (EtOAc/hexanes = 1:8, Rf = 0.3) to afford 1.0 g (72%) oil. 1H NMR (400 MHz, CDCl3) δ 8.10 (dd, J = 0.8, 5.1 Hz, 1H), 7.17 (d, J = 5.1 Hz, 1H), 6.74 (td, J = 2.1, 0.9 Hz, 2H), 6.40 (t, J = 2.1 Hz, 2H), 2.26 (s, 3H). 13C NMR (101 MHz, CDCl3) δ 160.2, 157.8, 149.6, 149.5, 145.5, 145.4, 123.80, 123.76, 122.1, 109.8, 17.29, 17.25. HRMS (m/z): calcd for C10H10FN2 (M+H) 177.0828; found 177.0827.

Richards, J.J.; Reed, C.S.; Melander, C., Bioorganic & Medicinal Chemistry Letters 18 (2008) 4325–4327

4-methyl-3-(1H-pyrrol-1-yl)pyridin-2-amine: 2-fluoro-4-methyl-3-(1H-pyrrol-1-yl)pyridine (3.9 g, 22.1 mmol) was dissolved in 80 mL of ammonia (7N in MeOH) in a sealed tube (250 mL). The mixture was heated at 150 °C for 2 days protected with shield. The mixture was cooled to room temperature, then cooled in the ice for 30 min. The filtrate was evaporated to dryness and purified by flash chromatography (EtOAc/Hexanes = 1:1, Rf = 0.5) to give 2.9 g (76%) white solid. 1H NMR (400 MHz, CDCl3) δ 7.96 (d, J = 5.1 Hz, 1H), 6.67 (t, J = 2.1 Hz, 2H), 6.60 (d, J = 5.2 Hz, 1H), 6.41 (t, J = 2.1 Hz, 2H), 4.52 (s, 2H), 2.02 (s, 3H). 13C NMR (101 MHz, CDCl3) δ 156.1, 147.2, 145.9, 121.5, 121.2, 116.0, 110.0, 16.7. HRMS (m/z): calcd for C10H12N3 (M+H) 174.1031; found 174.1026.


1-methylpyrido[2,3-e]pyrrolo[1,2-a]pyrazin-6(5H)-one: 4-methyl-3-(1H-pyrrol-1-yl)pyridin-2-amine (1.0 g, 5.8 mmol) and triphosgene (2.6 g, 8.7 mmol) were dissolved in 100 mL of toluene. The mixture was refluxed for 3 h, then cooled to room temperature. The red solid was collected after filtration and washed with CH3CN. 0.5 g (43%). The material was used directly for next step reaction without purification. 1H NMR (400 MHz, DMSO) δ 11.64 (s, 1H), 8.15 (dd, J = 1.4, 2.9 Hz, 1H), 8.13 (d, J = 4.9 Hz, 1H), 7.20 – 7.08 (m, 2H), 6.75 (dd, J = 2.9, 3.9 Hz, 1H), 2.81 (s, 3H).


methyl 2-(1-methyl-6-oxopyrido[2,3-e]pyrrolo[1,2-a]pyrazin-5(6H)-yl)acetate: To a solution of 1-methylpyrido[2,3-e]pyrrolo[1,2-a]pyrazin-6(5H)-one (50 mg, 0.25 mmol) in 2 mL of DMF, was added NaH (60%, 11 mg, 0.28 mmol). The mixture was stirred at room temperature for 1 h. Methyl bromoacetate (26 mL, 0.28 mmol) was added. The mixture was stirred for 16 h. Solvents were removed under vacuum and the residue was purified by silca gel flash chromatography (DCM/MeOH = 1:10, Rf = 0.5) to afford 37 mg (54%) light yellow solid). 1H NMR (400 MHz, CDCl3) δ 8.15 (d, J = 4.9 Hz, 1H), 7.95 (dd, J = 1.5, 2.9 Hz, 1H), 7.36 (dd, J = 1.5, 4.0 Hz, 1H), 7.00 (d, J = 4.9 Hz, 1H), 6.71 (dd, J = 2.9, 4.0 Hz, 1H), 5.25 (s, 2H), 3.77 (s, 3H), 2.83 (s, 3H). 13C NMR (101 MHz, CDCl3) δ 169.3, 155.5, 143.1, 142.1, 134.8, 124.2, 122.7, 122.6, 120.4, 113.5, 113.4, 52.3, 41.9, 22.9. HRMS (m/z): calcd for C14H14N3O3 (M+H) 272.1035; found 272.1042.


2-(1-methyl-6-oxopyrido[2,3-e]pyrrolo[1,2-a]pyrazin-5(6H)-yl)acetic acid: methyl 2-(1-methyl-6-oxopyrido[2,3-e]pyrrolo[1,2-a]pyrazin-5(6H)-yl)acetate (517 mg, 1.91 mmol) was dissolved in 20 mL of MeOH/H2O/THF (1:1:4). LiOH (68.5 mg, 2.86 mmol) was added. The mixture was stirred at room temperature for 16 h. The solvents were removed and residue was dissolved in water, washed with ether, then neutralized with 2N HCl to pH = 3. 356 mg (73%) white solid was obtained after filtration and dried over vacuum. 1H NMR (400 MHz, DMSO) δ 12.90 (s, 1H), 8.27 – 8.17 (m, 2H), 7.29 – 7.19 (m, 2H), 6.80 (dd, J = 2.9, 3.9 Hz, 1H), 5.02 (s, 2H), 2.85 (s, 3H). 13C NMR (101 MHz, DMSO, APT) δ 169.8, 154.5, 143.1, 141.4, 135.9, 123.9, 123.3, 122.8, 119.5, 113.3, 112.7, 41.6, 22.2. HRMS (m/z): calcd for C13H12N3O3 (M+H) 258.0879; found 258.0894.


3-(4-(4-methoxyphenyl)piperazin-1-yl)propanenitrile: 4-methoxyphenypiperazine (0.92 g, 4.68 mmol) and acrylonitrile (0.31 mL, 4.68 mmol) were mixed in a 10 mL reaction tube and stirred for 16 h. The product was purified by sical gel flash chromatography (EtOAc/hexanes = 1:8, Rf = 0.3) to give 0.8 g (74%) white solid. 1H NMR (400 MHz, CDCl3) δ 6.98 – 6.90 (m, 2H), 6.90 – 6.82 (m, 2H), 3.79 (s, 3H), 3.17 – 3.07 (m, 4H), 2.78 (t, J = 7.0 Hz, 2H), 2.74 – 2.64 (m, 4H), 2.57 (t, J = 7.0 Hz, 2H). 13C NMR (101 MHz, CDCl3) δ 154.0, 145.5, 118.8, 118.4, 114.5, 55.6, 53.4, 52.8, 50.6, 15.9.
Upadhayaya, R.S.; Sinha, N.; Jain, S.; Chandrab, N.K.R. and Arora, S. K. Bioorganic & Medicinal Chemistry 12 (2004) 2225–2238

3-(4-(4-methoxyphenyl)piperazin-1-yl)propan-1-amine: A solution of 3-(4-(4-methoxyphenyl)piperazin-1-yl)propanenitrile (0.8 g, 3.26 mmol) in 15 mL ether was added to the suspension of LiAlH4 (0.19 g, 4.89 mmol) in 5 mL of ether. The mixture was stirred at room temperature for 16 h. Then quenched with 2N NaOH (1 mL). The ether phase was dried over MgSO4 and evaporated to dryness to give 0.68 g (84%) white solid, which was used directly without further purification. 1H NMR (400 MHz, CDCl3) δ 6.89 (d, J = 9.1 Hz, 2H), 6.82 (d, J = 9.1 Hz, 2H), 3.75 (s, 3H), 3.15 – 3.04 (m, 4H), 2.87 (s, br. 2H), 2.76 (t, J = 6.8 Hz, 2H), 2.67 – 2.53 (m, 4H), 2.51 – 2.37 (m, 2H), 1.75 – 1.54 (m, 2H). 13C NMR (101 MHz, CDCl3) δ 153.8, 145.7, 118.1, 114.4, 56.4, 55.5, 53.48, 50.6, 40.6, 30.1.

Valenta, V.; Vlkova, M.; Holubek, J.; Svatek, E.; Metysova, J.; Protiva, M. Collect. Czech. Chem. Commun. 1990, 55, 797–808

N-(3-(4-(4-methoxyphenyl)piperazin-1-yl)propyl)-2-(1-methyl-6-oxopyrido[2,3-e]pyrrolo[1,2-a]pyrazin-5(6H)-yl)acetamide: 2-(1-methyl-6-oxopyrido[2,3-e]pyrrolo[1,2-a]pyrazin-5(6H)-yl)acetic acid (30 mg, 0.12 mmol), 3-(4-(4-methoxyphenyl)piperazin-1-yl)propan-1-amine (43.6 mg, 0.17 mmol) and DMAP (1.4 mg, 0.012 mmol) were dissolved in 1 mL of DCM. Diisopropylcarbodiimide (0.09 mL, 0.58 mmol) was added. The mixture was stirred at room temperature for 16 h. And the product was purified by silica gel flash chromatography (DCM/MeOH = 10 :1, Rf= 0.5) to give 30 mg (53%) white solid. 1H NMR (400 MHz, CDCl3) δ 8.17 (d, J = 4.9 Hz, 1H), 7.87 (dd, J = 1.4, 2.9 Hz, 1H), 7.33 (dd, J = 1.4, 4.0 Hz, 1H), 7.12 (s, 1H), 6.99 (d, J = 5.0 Hz, 1H), 6.84 (s, 4H), 6.68 (dd, J = 2.9, 4.0 Hz, 1H), 5.11 (s, 2H), 3.78 (s, 3H), 3.41 (dd, J = 5.8, 12.0 Hz, 2H), 3.02 – 2.91 (m, 4H), 2.74 (s, 3H), 2.63 – 2.54 (m, 4H), 2.49 (t, J = 6.4 Hz, 2H), 1.75–1.69 (m, 2H). 13C NMR (101 MHz, CDCl3) δ 167.9, 155.8, 153.8, 145.4, 143.2, 142.3, 134.8, 124.1, 122.8, 122.6, 120.4, 118.0, 114.4, 113.5, 113.4, 57.3, 55.6, 53.4, 50.4, 44.2, 39.4, 25.2, 22.8. HRMS (m/z): calcd for C27H33N6O3 (M+H) 489.2609; found 489.2600.


2-(1-methyl-6-oxopyrido[2,3-e]pyrrolo[1,2-a]pyrazin-5(6H)-yl)-N-(3-(4-phenylpiperazin-1-yl)propyl)acetamide: 24 mg, 79%. 1H NMR (400 MHz, CDCl3) δ 8.08 (d, J = 4.9 Hz, 1H), 7.76 (dd, J = 1.4, 2.9 Hz, 1H), 7.25 (dd, J = 1.4, 4.0 Hz, 1H), 7.17 (dd, J = 1.7, 6.8 Hz, 2H), 7.00 (s, 1H), 6.90 (d, J = 4.9 Hz, 1H), 6.77 (dd, J = 7.7, 8.5 Hz, 3H), 6.58 (dd, J = 2.9, 4.0 Hz, 1H), 5.02 (s, 2H), 3.33 (dd, J = 5.8, 12.0 Hz, 2H), 2.99 – 2.84 (m, 4H), 2.62 (s, 3H), 2.50 – 2.42 (m, 4H), 2.38 (t, J = 6.3 Hz, 2H), 1.67 – 1.52 (m, 2H). 13C NMR (101 MHz, CDCl3) δ 167.9, 155.8, 151.0, 143.2, 142.3, 134.9, 129.1, 124.0, 122.8, 122.7, 120.4, 119.7, 115.9, 113.6, 113.5, 57.4, 53.3, 48.9, 44.4, 39.5, 25.1, 22.8. HRMS (m/z): calcd for C26H31N6O2 (M+H) 459.2503; found 459.2507.


2-(1-methyl-6-oxopyrido[2,3-e]pyrrolo[1,2-a]pyrazin-5(6H)-yl)-N-(3-(4-(p-tolyl)piperazin-1-yl)propyl)acetamide: 29 mg, 53%. 1H NMR (400 MHz, CDCl3) δ 8.14 (d, J = 4.9 Hz, 1H), 7.84 (dd, J = 1.4, 2.9 Hz, 1H), 7.31 (dd, J = 1.4, 4.0 Hz, 1H), 7.09 (s, 1H), 7.05 (d, J = 8.2 Hz, 2H), 6.96 (d, J = 4.9 Hz, 1H), 6.76 (d, J = 8.6 Hz, 2H), 6.65 (dd, J = 2.9, 4.0 Hz, 1H), 5.08 (s, 2H), 3.39 (dd, J = 5.8, 12.0 Hz, 2H), 3.03 – 2.92 (m, 4H), 2.70 (s, 3H), 2.60 – 2.51 (m, 4H), 2.46 (t, J = 6.4 Hz, 2H), 2.26 (s, 3H), 1.72 – 1.66 (m, 2H). 13C NMR (101 MHz, CDCl3) δ 167.9, 155.8, 148.9, 143.2, 142.3, 134.9, 129.6, 129.2, 124.1, 122.8, 122.6, 120.4, 116.2, 113.5, 113.4, 57.3, 53.3, 49.5, 44.2, 39.4, 25.2, 22.8, 20.4. HRMS (m/z): calcd for C27H33N6O2 (M+H) 473.2600; found 473.2657.


N-(3-(4-(4-chlorophenyl)piperazin-1-yl)propyl)-2-(1-methyl-6-oxopyrido[2,3-e]pyrrolo[1,2-a]pyrazin-5(6H)-yl)acetamide: 34 mg, 59%. 1H NMR (400 MHz, CDCl3) δ 8.17 (d, J = 4.9 Hz, 1H), 7.87 (dd, J = 1.5, 2.9 Hz, 1H), 7.32 (dd, J = 1.4, 4.0 Hz, 1H), 7.25 – 7.16 (m, 2H), 7.02 (s, 1H), 6.99 (d, J = 4.9 Hz, 1H), 6.80 – 6.73 (m, 2H), 6.67 (dd, J = 2.9, 4.0 Hz, 1H), 5.11 (s, 2H), 3.41 (dd, J = 5.9, 12.0 Hz, 2H), 3.06 – 2.94 (m, 4H), 2.74 (s, 3H), 2.61 – 2.51 (m, 4H), 2.47 (t, J = 6.4 Hz, 2H), 1.75 – 1.68 (m, 2H). 13C NMR (101 MHz, CDCl3) δ 167.9, 155.8, 149.6, 143.2, 142.3, 134.8, 128.9, 124.4, 124.1, 122.8, 122.6, 120.4, 117.0, 113.5, 113.5, 57.2, 53.1, 48.9, 44.3, 39.3, 25.3, 22.8. HRMS (m/z): calcd for C26H30ClN6O2 (M+H) 493.2113; found 493.2108.


N-(3-(4-(benzo[d][1,3]dioxol-5-yl)piperazin-1-yl)propyl)-2-(1-methyl-6-oxopyrido[2,3-e]pyrrolo[1,2-a]pyrazin-5(6H)-yl)acetamide: 24 mg, 41%. 1H NMR (400 MHz, CDCl3) δ 8.08 (d, J = 4.9 Hz, 1H), 7.80 (dd, J = 1.4, 2.9 Hz, 1H), 7.25 (dd, J = 1.4, 4.0 Hz, 1H), 6.96 (s, 1H), 6.91 (d, J = 4.9 Hz, 1H), 6.66 – 6.58 (m, 2H), 6.40 (d, J = 2.4 Hz, 1H), 6.20 (dd, J = 2.4, 8.5 Hz, 1H), 5.82 (s, 2H), 5.02 (s, 2H), 3.32 (dd, J = 5.8, 12.0 Hz, 2H), 2.89 – 2.80 (m, 4H), 2.67 (s, 3H), 2.52 – 2.43 (m, 4H), 2.39 (t, J = 6.4 Hz, 2H), 1.69 – 1.56 (m, 2H). 13C NMR (101 MHz, CDCl3) δ 167.9, 155.7, 148.3, 147.1, 143.2, 142.3, 141.3, 134.8, 124.1, 122.8, 122.6, 120.4, 113.6, 113.5, 108.8, 108.2, 100.9, 99.7, 57.3, 53.3, 50.6, 44.3, 39.4, 25.2, 22.9. HRMS (m/z): calcd for C27H31N6O4 (M+H) 503.2401; found 503.2397.

N-(3-(4-(2,4-dimethoxyphenyl)piperazin-1-yl)propyl)-2-(1-methyl-6-oxopyrido[2,3-e]pyrrolo[1,2-a]pyrazin-5(6H)-yl)acetamide: 38 mg, 63%. 1H NMR (400 MHz, CDCl3) δ 8.06 (d, J = 4.9 Hz, 1H), 7.81 (dd, J = 1.4, 2.9 Hz, 1H), 7.24 (dd, J = 1.4, 4.0 Hz, 1H), 7.14 (s, 1H), 6.89 (d, J = 4.9 Hz, 1H), 6.70 (d, J = 8.6 Hz, 1H), 6.59 (dd, J = 2.9, 4.0 Hz, 1H), 6.39 (d, J = 2.7 Hz, 1H), 6.32 (dd, J = 2.7, 8.6 Hz, 1H), 5.03 (s, 2H), 3.75 (s, 3H), 3.69 (s, 3H), 3.31 (dd, J = 5.9, 11.9 Hz, 2H), 2.87 (s, br. 4H), 2.68 (s, 3H), 2.56 (s, br. 4H), 2.42 (t, J = 6.4 Hz, 2H), 1.72 – 1.55 (m, 2H). 13C NMR (101 MHz, CDCl3) δ 167.8, 156.1, 155.8, 153.3, 143.2, 142.3, 135.0, 134.8, 124.2, 122.7, 122.6, 120.4, 118.5, 113.4, 113.4, 103.4, 100.0, 57.3, 55.5, 55.4, 53.5, 51.2, 44.1, 39.3, 25.2, 22.9. HRMS (m/z): calcd for C28H35N6O4 (M+H) 519.2714; found 519.2710.

2-(6-oxopyrido[2,3-e]pyrrolo[1,2-a]pyrazin-5(6H)-yl)-N-(3-(4-phenylpiperazin-1-yl)propyl)acetamide: 40 mg, 73%. 1H NMR (400 MHz, CDCl3) δ 8.30 (dd, J = 1.5, 4.8 Hz, 1H), 7.83 (dd, J = 1.5, 8.1 Hz, 1H), 7.54 (dd, J = 1.4, 2.8 Hz, 1H), 7.34 – 7.18 (m, 4H), 7.14 (dd, J = 4.8, 8.0 Hz, 1H), 6.93 – 6.82 (m, 3H), 6.64 (dd, J = 2.8, 3.9 Hz, 1H), 5.10 (s, 2H), 3.43 (dd, J = 5.8, 11.9 Hz, 2H), 3.13 – 2.98 (m, 4H), 2.64 – 2.54 (m, 4H), 2.50 (t, J = 6.3 Hz, 2H), 1.73 (p, J = 6.3 Hz, 2H). 13C NMR (101 MHz, CDCl3) δ 167.7, 155.9, 151.0, 144.3, 141.6, 129.1, 122.8, 121.8, 120.1, 119.7, 118.5, 117.0, 115.9, 114.1, 113.9, 57.4, 53.3, 49.0, 43.6, 39.6, 25.1. HRMS (m/z): calcd for C25H29N6O2 (M+H) 445.2347; found 445.2344.

2-(6-oxopyrido[2,3-e]pyrrolo[1,2-a]pyrazin-5(6H)-yl)-N-(3-(4-(p-tolyl)piperazin-1-yl)propyl)acetamide: 30 mg, 53%. 1H NMR (400 MHz, CDCl3) δ 8.20 (dd, J = 1.5, 4.8 Hz, 1H), 7.75 (dd, J = 1.5, 8.1 Hz, 1H), 7.46 (dd, J = 1.4, 2.8 Hz, 1H), 7.14 (dt, J = 4.2, 8.3 Hz, 2H), 7.05 (dd, J = 4.8, 8.0 Hz, 1H), 6.99 (d, J = 8.2 Hz, 2H), 6.70 (d, J = 8.6 Hz, 2H), 6.56 (dd, J = 2.8, 3.9 Hz, 1H), 5.00 (s, 2H), 3.33 (dd, J = 5.8, 11.9 Hz, 2H), 2.99 – 2.85 (m, 4H), 2.54 – 2.45 (m, 4H), 2.40 (t, J = 6.3 Hz, 2H), 2.19 (s, 3H), 1.63 (p, J = 6.3 Hz, 2H). 13C NMR (101 MHz, CDCl3) δ 167.6, 155.9, 148.9, 144.3, 141.6, 129.6, 129.2, 122.8, 121.8, 120.2, 118.5, 117.0, 116.3, 114.1, 113.9, 57.4, 53.3, 49.6, 43.5, 39.5, 25.1, 20.4. HRMS (m/z): calcd for C26H31N6O2 (M+H) 459.2503; found 459.2501.

N-(3-(4-(4-methoxyphenyl)piperazin-1-yl)propyl)-2-(6-oxopyrido[2,3-e]pyrrolo[1,2-a]pyrazin-5(6H)-yl)acetamide: 19 mg, 32%. 1H NMR (400 MHz, CDCl3) δ 8.22 (dd, J = 1.5, 4.8 Hz, 1H), 7.77 (dd, J = 1.5, 8.1 Hz, 1H), 7.48 (dd, J = 1.4, 2.8 Hz, 1H), 7.16 (dd, J = 1.4, 3.9 Hz, 1H), 7.12 (s, 1H), 7.07 (dd, J = 4.8, 8.0 Hz, 1H), 6.76 (s, 4H), 6.58 (dd, J = 2.8, 3.9 Hz, 1H), 5.02 (s, 2H), 3.69 (s, 3H), 3.34 (dd, J = 5.8, 11.9 Hz, 2H), 2.96 – 2.83 (m, 4H), 2.57 – 2.47 (m, 4H), 2.42 (t, J = 6.3 Hz, 2H), 1.71 – 1.58 (m, 2H). 13C NMR (101 MHz, CDCl3) δ 167.6, 155.9, 153.8, 145.4, 144.4, 141.6, 122.9, 121.8, 120.2, 118.5, 118.0, 116.9, 114.4, 114.1, 113.9, 57.3, 55.6, 53.4, 50.4, 43.5, 39.5, 25.1. HRMS (m/z): calcd for C26H31N6O3 (M+H) 475.2452; found 475.2448.

N-(3-(4-(4-chlorophenyl)piperazin-1-yl)propyl)-2-(6-oxopyrido[2,3-e]pyrrolo[1,2-a]pyrazin-5(6H)-yl)acetamide: 35 mg, 59%. 1H NMR (400 MHz, CDCl3) δ 8.22 (d, J = 4.7 Hz, 1H), 7.77 (dd, J = 1.3, 8.0 Hz, 1H), 7.47 (dd, J = 1.4, 2.7 Hz, 1H), 7.17 – 7.05 (m, 4H), 7.02 (s, 1H), 6.73 – 6.63 (m, 2H), 6.60 – 6.51 (m, 1H), 5.01 (s, 2H), 3.33 (dd, J = 5.9, 11.9 Hz, 2H), 2.98 – 2.87 (m, 4H), 2.52 – 2.44 (m, 4H), 2.39 (t, J = 6.3 Hz, 2H), 1.63 (p, J = 6.3 Hz, 2H). 13C NMR (101 MHz, CDCl3) δ 167.7, 155.9, 149.6, 144.4, 141.6, 128.9, 124.5, 122.8, 121.8, 120.2, 118.5, 117.1, 116.9, 114.1, 113.9, 57.3, 53.1, 49.0, 43.6, 39.4, 25.2. HRMS (m/z): calcd for C25H28ClN6O2 (M+H) 479.1957; found 479.1949.

N-(3-(4-(benzo[d][1,3]dioxol-5-yl)piperazin-1-yl)propyl)-2-(6-oxopyrido[2,3-e]pyrrolo[1,2-a]pyrazin-5(6H)-yl)acetamide: 24 mg, 40%. 1H NMR (400 MHz, CDCl3) δ 8.22 (dd, J = 1.4, 4.8 Hz, 1H), 7.79 (dd, J = 1.4, 8.1 Hz, 1H), 7.50 (dd, J = 1.4, 2.8 Hz, 1H), 7.16 (dd, J = 1.4, 3.9 Hz, 1H), 7.08 (dd, J = 4.8, 8.0 Hz, 2H), 6.63 (d, J = 8.4 Hz, 1H), 6.58 (dd, J = 2.8, 3.9 Hz, 1H), 6.41 (d, J = 2.4 Hz, 1H), 6.21 (dd, J = 2.4, 8.5 Hz, 1H), 5.82 (s, 2H), 5.01 (s, 2H), 3.33 (dd, J = 5.8, 11.9 Hz, 2H), 2.93 – 2.80 (m, 4H), 2.54 – 2.44 (m, 4H), 2.40 (t, J = 6.3 Hz, 2H), 1.71 – 1.57 (m, 2H). 13C NMR (101 MHz, CDCl3) δ 167.7, 155.9, 148.2, 147.1, 144.4, 141.6, 141.5, 122.8, 121.8, 120.2, 118.5, 116.9, 114.1, 113.9, 108.8, 108.1, 100.9, 99.7, 57.3, 53.3, 50.7, 43.6, 39.4, 25.2. HRMS (m/z): calcd for C26H29N6O4 (M+H) 489.2245; found 489.2237.


N-(3-(4-(2,4-dimethoxyphenyl)piperazin-1-yl)propyl)-2-(6-oxopyrido[2,3-e]pyrrolo[1,2-a]pyrazin-5(6H)-yl)acetamide: 36 mg, 58%. 1H NMR (400 MHz, CDCl3) δ 8.29 (dd, J = 1.5, 4.8 Hz, 1H), 7.90 (dd, J = 1.5, 8.1 Hz, 1H), 7.61 (dd, J = 1.4, 2.8 Hz, 1H), 7.37 (s, 1H), 7.25 (dd, J = 1.4, 3.9 Hz, 1H), 7.15 (dd, J = 4.8, 8.0 Hz, 1H), 6.82 (d, J = 8.6 Hz, 1H), 6.66 (dd, J = 2.8, 3.9 Hz, 1H), 6.48 (d, J = 2.7 Hz, 1H), 6.42 (dd, J = 2.7, 8.6 Hz, 1H), 5.12 (s, 2H), 3.85 (s, 3H), 3.78 (s, 3H), 3.43 (dd, J = 5.8, 11.8 Hz, 2H), 2.98 (s, br. 4H), 2.67 (s, br. 4H), 2.54 (t, J = 6.3 Hz, 3H), 1.82 – 1.68 (m, 2H). 13C NMR (101 MHz, CDCl3) δ 167.6, 156.2, 155.9, 153.4, 144.3, 141.6, 135.0, 122.9, 121.8, 120.2, 118.5, 118.4, 116.9, 114.0, 113.8, 103.3, 99.9, 57.3, 55.5, 55.5, 53.5, 51.2, 43.4, 39.4, 25.1. HRMS (m/z): calcd for C27H33N6O4 (M+H) 505.2558; found 505.2552.


2-(2-bromo-6-oxopyrido[2,3-e]pyrrolo[1,2-a]pyrazin-5(6H)-yl)-N-(3-(4-(p-tolyl)piperazin-1-yl)propyl)acetamide: 12 mg, 24%. 1H NMR (400 MHz, CDCl3) δ 8.23 (d, J = 2.0 Hz, 1H), 7.86 (d, J = 2.0 Hz, 1H), 7.45 – 7.36 (m, 1H), 7.25 (s, 1H), 7.16 (dd, J = 1.3, 3.9 Hz, 1H), 7.00 (d, J = 8.3 Hz, 2H), 6.71 (d, J = 8.6 Hz, 2H), 6.61 – 6.54 (m, 1H), 4.95 (s, 2H), 3.34 (dd, J = 5.7, 11.7 Hz, 2H), 3.00 – 2.88 (m, 4H), 2.58 – 2.47 (m, 4H), 2.44 (t, J = 6.2 Hz, 2H), 2.20 (s, 3H), 1.72 – 1.59 (m, 2H). 13C NMR (101 MHz, CDCl3) δ 167.2, 155.5, 148.9, 144.8, 140.5, 129.6, 129.3, 124.3, 122.8, 120.9, 117.2, 116.3, 114.6, 114.5, 113.5, 57.6, 53.3, 49.6, 43.5, 39.8, 24.9, 20.4. HRMS (m/z): calcd for C26H30BrN6O2 (M+H) 539.1591; found 539.1581.

2-(2-bromo-6-oxopyrido[2,3-e]pyrrolo[1,2-a]pyrazin-5(6H)-yl)-N-(3-(4-phenylpiperazin-1-yl)propyl)acetamide: 31 mg, 95%. 1H NMR (400 MHz, CDCl3) δ 8.24 (d, J = 2.0 Hz, 1H), 7.84 (d, J = 2.0 Hz, 1H), 7.38 (dd, J = 1.4, 2.8 Hz, 1H), 7.27 – 7.12 (m, 5H), 6.80 (dd, J = 6.3, 7.9 Hz, 3H), 6.58 (dd, J = 2.9, 3.9 Hz, 1H), 4.95 (s, 2H), 3.35 (dd, J = 5.7, 11.7 Hz, 2H), 3.06 – 2.88 (m, 4H), 2.58 – 2.48 (m, 4H), 2.44 (t, J = 6.2 Hz, 2H), 1.68 – 1.63 (m, 2H). 13C NMR (101 MHz, CDCl3) δ 167.2, 155.5, 150.9, 144.8, 140.5, 129.1, 124.3, 122.7, 120.9 119.8, 117.2, 115.9, 114.6, 114.6, 113.5, 57.7, 53.3, 49.0, 43.6, 39.9, 24.9. HRMS (m/z): calcd for C25H28BrN6O2 (M+H) 525.1435; found 525.1429.

2-(2-bromo-6-oxopyrido[2,3-e]pyrrolo[1,2-a]pyrazin-5(6H)-yl)-N-(3-(4-(4-methoxyphenyl)piperazin-1-yl)propyl)acetamide: 31 mg, 90%. 1H NMR (400 MHz, CDCl3) δ 8.33 (d, J = 2.0 Hz, 1H), 7.97 (d, J = 2.0 Hz, 1H), 7.51 (dd, J = 1.4, 2.8 Hz, 1H), 7.36 (s, 1H), 7.26 (dd, J = 1.4, 3.9 Hz, 1H), 6.86 (s, 4H), 6.68 (dd, J = 2.9, 3.8 Hz, 1H), 5.05 (s, 2H), 3.79 (s, 3H), 3.44 (dd, J = 5.7, 11.7 Hz, 2H), 3.07 – 2.95 (m, 4H), 2.68 – 2.59 (m, 4H), 2.54 (t, J = 6.2 Hz, 2H), 1.78 – 1.71 (m, 2H). 13C NMR (101 MHz, CDCl3) δ 167.2, 155.5, 153.8, 145.4, 144.8, 140.5, 124.3, 122.8, 120.8, 118.0, 117.2, 114.6, 114.5, 114.5, 113.5, 57.6, 55.6, 53.4, 50.5, 43.5, 39.8, 24.9. HRMS (m/z): calcd for C26H30BrN6O3 (M+H) 553.1557; found 553.1544.

2-(2-bromo-6-oxopyrido[2,3-e]pyrrolo[1,2-a]pyrazin-5(6H)-yl)-N-(3-(4-(4-chlorophenyl)piperazin-1-yl)propyl)acetamide: 30 mg, 87%. 1H NMR (400 MHz, CDCl3) δ 8.34 (d, J = 2.0 Hz, 1H), 7.97 (d, J = 2.0 Hz, 1H), 7.52 (dd, J = 1.4, 2.8 Hz, 1H), 7.28 – 7.17 (m, 4H), 6.85 – 6.76 (m, 2H), 6.69 (dd, J = 2.9, 3.9 Hz, 1H), 5.05 (s, 2H), 3.44 (dd, J = 5.8, 11.8 Hz, 2H), 3.10 – 2.98 (m, 4H), 2.66 – 2.57 (m, 4H), 2.52 (t, J = 6.2 Hz, 2H), 1.78 – 1.71 (m, 2H). 13C NMR (101 MHz, CDCl3) δ 167.2, 155.5, 149.6, 144.9, 140.5, 128.9, 124.6, 124.3, 122.8, 120.8, 117.2, 117.1, 114.7, 114.6, 113.5, 57.5, 53.1, 49.0, 43.6, 39.7, 25.0. HRMS (m/z): calcd for C25H27BrClN6O2 (M+H) 559.1042; found 559.1031.

N-(3-(4-(benzo[d][1,3]dioxol-5-yl)piperazin-1-yl)propyl)-2-(2-bromo-6-oxopyrido[2,3-e]pyrrolo[1,2-a]pyrazin-5(6H)-yl)acetamide: 31 mg, 88%. 1H NMR (400 MHz, CDCl3) δ 8.24 (d, J = 1.9 Hz, 1H), 7.89 (d, J = 1.9 Hz, 1H), 7.45 (s, 1H), 7.26 – 7.14 (m, 3H), 6.69 – 6.56 (m, 2H), 6.43 (d, J = 2.3 Hz, 1H), 6.23 (dd, J = 2.4, 8.5 Hz, 1H), 5.83 (s, 2H), 4.96 (s, 2H), 3.34 (d, J = 5.9 Hz, 2H), 2.88 (d, J = 4.9 Hz, 4H), 2.53 (s, 4H), 2.44 (t, J = 6.2 Hz, 2H), 1.70 – 1.58 (m, 2H). 13C NMR (101 MHz, CDCl3) δ 167.2, 155.5, 148.2, 147.0, 144.8, 141.6, 140.5, 124.3, 120.9, 117.1, 114.7, 114.6, 113.5, 108.8, 108.2, 100.9, 99.8, 57.4, 53.3, 50.6, 43.5, 39.6, 24.9. HRMS (m/z): calcd for C26H28BrN6O4 (M+H) 569.1333; found 569.1321.

2-(2-bromo-6-oxopyrido[2,3-e]pyrrolo[1,2-a]pyrazin-5(6H)-yl)-N-(3-(4-(2,4-dimethoxyphenyl)piperazin-1-yl)propyl)acetamide: 34 mg, 94%. 1H NMR (400 MHz, CDCl3) δ 8.33 (s, 1H), 8.02 (s, 1H), 7.57 (s, 1H), 7.50 (s, 1H), 7.28 (dd, J = 2.7, 5.7 Hz, 2H), 6.83 (d, J = 8.7 Hz, 1H), 6.70 (s, 1H), 6.50 (s, 1H), 6.44 (d, J = 8.7 Hz, 1H), 5.07 (s, 2H), 3.86 (s, 3H), 3.80 (s, 3H), 3.44 (d, J = 5.7 Hz, 2H), 3.01 (s, br. 4H), 2.71 (s, br. 4H), 2.58 (d, J = 6.0H, 2H), 1.79 – 1.73 (m, 2H). 13C NMR (101 MHz, CDCl3) δ 167.1, 156.2, 155.5, 153.4, 144.8, 140.6, 134.8, 124.2, 122.9, 120.9, 118.5, 117.1, 114.6, 114.5, 113.4, 103.3, 99.9, 57.5, 55.49, 55.46, 53.5, 51.2, 43.4, 39.7, 24.8. HRMS (m/z): calcd for C27H32BrN6O4 (M+H) 585.1647; found 585.1637.

N-(2-(4-(4-methoxyphenyl)piperazin-1-yl)ethyl)-2-(1-methyl-6-oxopyrido[2,3-e]pyrrolo[1,2-a]pyrazin-5(6H)-yl)acetamide: 19.6 mg, 97%. 1H NMR (400 MHz, CDCl3) δ 8.19 (d, J = 4.9 Hz, 1H), 7.87 (dd, J = 1.5, 2.9 Hz, 1H), 7.37 (dd, J = 1.4, 4.0 Hz, 1H), 6.99 (d, J = 5.2 Hz, 1H), 6.92 – 6.76 (m, 4H), 6.69 (dd, J = 2.9, 4.0 Hz, 1H), 6.52 (s, 1H), 5.18 (s, 2H), 3.80 (s, 3H), 3.37 (dd, J = 5.8, 11.0 Hz, 2H), 2.86 – 2.73 (m, 4H), 2.51–2.47 (m, 6H). 13C NMR (101 MHz, CDCl3) δ 167.9, 155.6, 153.8, 145.5, 143.3, 142.1, 134.9, 124.0, 122.9, 122.7, 120.4, 118.0, 114.4, 113.7, 113.6, 55.7, 55.6, 52.6, 50.4, 44.1, 35.7, 22.8. HRMS (m/z): calcd for C26H31N6O3 (M+H) 475.2452; found 475.2450.

N-(4-(4-(4-methoxyphenyl)piperazin-1-yl)butyl)-2-(1-methyl-6-oxopyrido[2,3-e]pyrrolo[1,2-a]pyrazin-5(6H)-yl)acetamide: 20 mg, 99%. 1H NMR (400 MHz, CDCl3) δ 8.09 (d, J = 4.9 Hz, 1H), 7.86 (dd, J = 1.4, 2.9 Hz, 1H), 7.26 (dd, J = 1.4, 4.0 Hz, 1H), 6.91 (d, J = 4.9 Hz, 1H), 6.86 – 6.78 (m, 2H), 6.78 – 6.71 (m, 2H), 6.62 (dd, J = 2.9, 4.0 Hz, 1H), 6.31 (s, 1H), 5.04 (s, 2H), 3.69 (s, 3H), 3.21 (d, J = 5.7 Hz, 2H), 3.09 – 2.92 (m, 4H), 2.73 (s, 3H), 2.58 – 2.43 (m, 4H), 2.32 (s, 2H), 1.48 – 1.45 (m, 4H). 13C NMR (101 MHz, CDCl3) δ 167.9, 155.8, 153.8, 145.7, 143.3, 142.2, 134.8, 124.1, 122.8, 122.6, 120.4, 118.2, 114.4, 113.5, 57.9, 55.6, 53.3, 50.6, 44.2, 39.4, 27.4, 24.1, 23.0. HRMS (m/z): calcd for C28H35N6O3 (M+H) 503.2765; found 503.2761.

- PMCPubMed Central citations
- PubChem BioAssay for Chemical ProbePubChem BioAssay records reporting screening data for the development of the chemical probe(s) described in this book chapter
- PubChem SubstanceRelated PubChem Substances
- PubMedLinks to PubMed
- Review Selective KOP Receptor Agonists: Probe 1 & Probe 2.[Probe Reports from the NIH Mol...]Review Selective KOP Receptor Agonists: Probe 1 & Probe 2.Hedrick MP, Gosalia P, Frankowski K, Shi S, Prisinzano TE, Schoenen F, Aubé J, Su Y, Vasile S, Sergienko E, et al. Probe Reports from the NIH Molecular Libraries Program. 2010
- Opioid receptor involvement in food deprivation-induced feeding: evaluation of selective antagonist and antisense oligodeoxynucleotide probe effects in mice and rats.[J Pharmacol Exp Ther. 2004]Opioid receptor involvement in food deprivation-induced feeding: evaluation of selective antagonist and antisense oligodeoxynucleotide probe effects in mice and rats.Hadjimarkou MM, Singh A, Kandov Y, Israel Y, Pan YX, Rossi GC, Pasternak GW, Bodnar RJ. J Pharmacol Exp Ther. 2004 Dec; 311(3):1188-202. Epub 2004 Aug 27.
- Synthesis, opioid receptor binding, and bioassay of naltrindole analogues substituted in the indolic benzene moiety.[J Med Chem. 1998]Synthesis, opioid receptor binding, and bioassay of naltrindole analogues substituted in the indolic benzene moiety.Ananthan S, Johnson CA, Carter RL, Clayton SD, Rice KC, Xu H, Davis P, Porreca F, Rothman RB. J Med Chem. 1998 Jul 16; 41(15):2872-81.
- New benzomorphan derivatives of MPCB as MOP and KOP receptor ligands.[Pharmazie. 2007]New benzomorphan derivatives of MPCB as MOP and KOP receptor ligands.Pasquinucci L, Iadanza M, Marrazzo A, Prezzavento O, Ronsisvalle S, Scoto GM, Parenti C, De Luca L, Ronsisvalle G. Pharmazie. 2007 Nov; 62(11):813-24.
- Review Selective KOP Receptor Antagonists: Probe 1.[Probe Reports from the NIH Mol...]Review Selective KOP Receptor Antagonists: Probe 1.Hedrick MP, Gosalia P, Frankowski K, Whipple DA, Shi S, Prisinzano TE, Schoenen F, Aubé J, Su Y, Vasile S, et al. Probe Reports from the NIH Molecular Libraries Program. 2010
- Antagonist for the Kappa Opioid Receptor - Probe Reports from the NIH Molecular ...Antagonist for the Kappa Opioid Receptor - Probe Reports from the NIH Molecular Libraries Program
- ML346: A Novel Modulator of Proteostasis for Protein Conformational Diseases - P...ML346: A Novel Modulator of Proteostasis for Protein Conformational Diseases - Probe Reports from the NIH Molecular Libraries Program
- Therapeutic Inhibitors of Phosphomannose Isomerase - Probe 1 - Probe Reports fro...Therapeutic Inhibitors of Phosphomannose Isomerase - Probe 1 - Probe Reports from the NIH Molecular Libraries Program
- Characterization of an agonist probe for opioid receptor mu 1 (OPRM1)-opioid rec...Characterization of an agonist probe for opioid receptor mu 1 (OPRM1)-opioid receptor delta 1 (OPRD1) heterodimerization - Probe Reports from the NIH Molecular Libraries Program
- Discovery and characterization of a small molecule allosteric agonist of MrgX1 -...Discovery and characterization of a small molecule allosteric agonist of MrgX1 - Probe Reports from the NIH Molecular Libraries Program
Your browsing activity is empty.
Activity recording is turned off.
See more...