

NCBI Bookshelf. A service of the National Library of Medicine, National Institutes of Health.
IARC Working Group on the Evaluation of Carcinogenic Risks to Humans. Some Chemicals Used as Solvents and in Polymer Manufacture. Lyon (FR): International Agency for Research on Cancer; 2017. (IARC Monographs on the Evaluation of Carcinogenic Risks to Humans, No. 110.)
1.1. Identification of the agent
1.1.1. Nomenclature
- Chem. Abstr. Serv. Reg. No.: 335-67-1
- Chem. Abstr. Serv. Name: Perfluorooctanoic acid
- IUPAC Name: 2,2,3,3,4,4,5,5,6,6,7,7,8,8,8-pentadecafluorooctanoic acid
- Synonyms: PFOA; pentadecafluoro-1-octanoic acid; pentadecafluoro-n-octanoic acid; pentadecaflurooctanoic acid; perfluorocaprylic acid; perfluoroctanoic acid; perfluoroheptanecarboxylic acid; APFO; ammonium perfluorooctanoate
- Isomers and Salts: There are 39 possible structural isomers of pentadecafluorooctanoic acid (1 with chain length 8, 5 with chain length 7, 13 with chain length 6, 16 with chain length 5, and 4 with chain length 4). These isomers can also exist as the ammonium, sodium, or potassium salt (Nielsen, 2012). Fig. 1.1 presents the few isomers and salts that have Chemical Abstracts Service (CAS) references.
Fig. 1.1
Structures of isomers and salts of perfluorooctanoic acid (PFOA)
1.1.2. Structural and molecular formulae, and relative molecular mass: straight-chain isomer
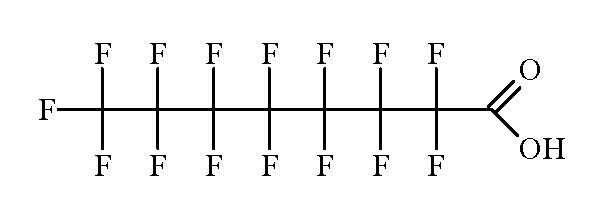
Molecular formula: C8HF15O2
Relative molecular mass: 414
1.1.3. Chemical and physical properties of the pure substance: straight-chain isomer
- From HSDB (2014), unless otherwise indicated
- Description: White to off-white powder
- Boiling point: 192.4 °C
- Melting point: 54.3 °C
- Density: 1.792 g/cm3 at 20 °C
- Solubility: 9.5 g/L in water at 25 °C
- Vapour pressure: 0.0023 kPa at 20 °C (extrapolated); 0.127 kPa at 59.25 °C (measured) (ATSDR, 2009); 0.070 kPa at 25 °C
- Stability: When heated to decomposition it emits toxic vapours of hydrogen fluoride
- Conversion factor: Assuming normal temperature (25 °C) and pressure (101 kPa), 1 mg/m3 = 16.9 ppm.
1.1.4. Technical products and impurities
See Fig. 1.1
Perfluorooctanoic acid (PFOA) produced by the electrochemical fluorination (ECF) method, before 2002, was reported to have a consistent isomer composition of 78% linear isomer (standard deviation, 1.2%) and 22% branched-chain isomer (standard deviation, 1.2%) in 18 production lots over a 20-year period, as determined by 19F nuclear magnetic resonance. PFOA produced by the telomerization method (major use from 2002 to present) is typically an isomerically pure, linear product (Benskin et al., 2010).
PFOA produced by ECF was reported to contain the following impurities: perfluorohexanoate, 0.73%; perfluoroheptanoate, 3.7%; perfluorononanoate, 0.2%; perfluorodecanoate, 0.0005%; perfluoroundecanoate, 0.0008%; and perfluorododecanoate, 0.0008% (Benskin et al., 2010).
1.1.5. Analysis
Selected methods for the analysis of PFOA in various matrices are listed in Table 1.1. Methods for the trace analysis of PFOA in human serum and milk, in food and consumer products, as well as in environmental samples such as wildlife, water, solid matrices, and air have been reviewed (ATSDR, 2009; Jahnke & Berger, 2009).
Table 1.1
Selected methods for the analysis of perfluorooctanoic acid (PFOA).
1.2. Production and use
1.2.1. Production process
Perfluoroalkyls have been manufactured industrially by two methods: electrochemical fluorination (ECF) and telomerization. The two techniques can be distinguished based on the isomeric profile of their products. ECF (major use from the 1950s to 2002) results in a product containing both linear and branched isomers, while telomerization (major use from 2002 to present) typically yields an isomerically pure, linear product (ATSDR, 2009).
During the ECF process, an organic acyl backbone structure is dissolved in a solution of aqueous hydrogen fluoride. A direct electrical current is then passed through the solution, which replaces all of the hydrogens on the molecule with fluorines. Perfluoroacyl fluorides produced by ECF are hydrolysed to form the perfluorocarboxylic acid, which is then separated via distillation (ATSDR, 2009).
From 1947 until 2002, ECF was used worldwide to manufacture most (80–90% in 2000) PFOA, as the ammonium salt. The largest production sites were in the USA and Belgium, the next largest were in Italy, and small-scale producers were located in Japan. From about 1975 to the present, the remaining 10–20% of ammonium perfluorooctanoate was manufactured by direct oxidation of perfluorooctyl iodide at one site in Germany, and at least one site in Japan. In 1999, the global annual production of ammonium perfluorooctanoate was approximately 260 tonnes. By 2002, the principal worldwide manufacturer of ammonium perfluorooctanoate using ECF had discontinued external sales and ceased production, leaving only a few relatively small producers in Europe and in Asia (Prevedouros et al., 2006). Production volumes of PFOA, as both the acid and the ammonium salt, in the USA from 1986 to 2002 are shown in Table 1.2.
Table 1.2
Production volumes for perfluorooctanoic acid (PFOA) in the USA, 1986–2002.
The telomerization process begins with the preparation of pentafluoroiodoethane from tetrafluoroethane. Tetrafluoroethane is then added to the product at a molar ratio that gives a product of desired chain length, and the final product is oxidized to form the carboxylic acid. The telomerization process produces linear perfluorocarboxylic acids with even numbers of carbon atoms (ATSDR, 2009).
New production capacity for ammonium perfluorooctanoate based on perfluorooctyl iodide commenced in the USA in late 2002. In 2006, the eight major manufacturers of PFOA in the USA joined the 2010/2015 PFOA Stewardship Program, a voluntary programme run by the United States Environmental Protection Agency (EPA) with the aim of reducing facility emissions and product content of PFOA, its precursors, and higher homologues by 95% by 2010, compared with the year 2000 (EPA, 2014). These manufacturers also agreed to the goal of totally eliminating these substances from emissions and product contents by 2015. Six of the eight manufacturers reported at least 95% reduction in emissions of PFOA by the end of 2010 in the USA. Substantial reductions in product content were also reported by these manufacturers for 2010 relative to 2000, both in the USA and in global operations. In a few cases, data were withheld by the manufacturers to protect business interests – particularly for non-USA operations and for precursors (EPA, 2014). Ammonium perfluorooctanoate is currently manufactured in Japan via oxidation of a mixture of linear fluorotelomer olefins (Prevedouros et al., 2006).
1.2.2. Uses
PFOA and it salts have been used as emulsifiers to solubilize fluoromonomers and to facilitate their aqueous polymerization in the production of fluoropolymers such as polytetrafluoroethylene and fluoroelastomers, used as non-stick coatings on cookware, membranes for clothing that are both waterproof and breathable, electrical-wire casing, fire- and chemical-resistant tubing, and plumber’s thread-seal tape (ATSDR, 2009). Fluoropolymer manufacture is the single largest direct use of the ammonium salts of PFOA (Prevedouros et al., 2006).
PFOA has also been used in cosmetics, greases and lubricants, paints, polishes, adhesives, and fluorinated surfactants (HSDB, 2014). Widespread use of perfluorocarboxylates, including PFOA, and derivatives as additives in industrial and consumer products in 1966 included metal cleaners, electrolytic-plating baths, self-shine floor polishes, cement, fire-fighting formulations, varnishes, emulsion polymerization, lubricants, gasoline, and paper, leather, and textile treatments (Prevedouros et al., 2006). PFOA has found use as a grease and water-repellent coating in food packaging (Fromme et al., 2009).
Perfluorocarboxylates, including PFOA, were used as a component in aqueous fire-fighting foam from about 1965 to 1975. These formulations were used by the military (e.g. at aircraft bases and aboard ship) and in oil and gas production, refining industries, and airports worldwide (Prevedouros et al., 2006).
1.3. Occurrence and exposure
1.3.1. Environmental occurrence
The sources of emissions of PFOA to the environment are: (a) their manufacture, use and disposal; (b) their presence as impurities in substances that are emitted to the environment; and (c) precursor substances that degrade abiotically or biotically in the environment (Buck et al., 2011). One reference defined all chemicals with a C7F15 or C8F17 perfluorinated alkyl moiety and a direct bond to any chemical moiety other than a fluorine, chlorine, or bromine atom, as potential precursors of PFOA (Environment Canada, 2012). For example, 8:2 polyfluoroalkyl phosphates have been measured in human serum and can be metabolized to 8:2 fluorotelomer alcohol (8:2 FTOH) and/or PFOA in animal models (Lee & Mabury, 2011; Environment Canada, 2012). However, the extent to which the various precursors are metabolized in humans, and their relative contribution to serum concentrations of PFOA, are not well understood.
Under normal environmental conditions, PFOA is highly persistent, with photodegradation and hydrolysis half-lives of months to years, and insignificant biotic degradation (Environment Canada, 2012). It has low to moderate potential to accumulate in aquatic species, but does appear to accumulate in some terrestrial and marine mammals (Environment Canada, 2012).
(a) Natural occurrence
PFOA is not known to occur naturally.
(b) Air
Although PFOA is not routinely monitored in air, sporadic measurements have been reported. Fromme et al. (2009) reviewed the literature and reported site mean concentrations of PFOA in air ranging from 1.4 to 552 pg/m3 from 11 rural and urban outdoor sampling sites in Japan, Canada, the United Kingdom, Norway, Ireland, and the USA; the highest measurements were from urban locations or adjacent to busy roads. PFOA and 8:2 FTOH have been found in remote Arctic areas far from known sources, suggesting long-range aerial transport. Concentrations of PFOA ranging from 0.012 to 0.147 ng/L were reported in polar ice caps in the High Arctic in 2006 (Environment Canada, 2012).
(c) Water
Samples from potable water supplies without known point sources of perfluorooctanoate contamination typically contain perfluorooctanoate at < 1 ng/L, or at levels below the detection limit (Fromme et al., 2009). However, higher concentrations in drinking-water have been reported for some locations. For example, Kim et al. (2011b) reported average concentration of perfluorooctanoate of 5.4 ng/L, and a maximum concentration of 33 ng/L, for 15 tap-water samples collected in 8 cities in the Republic of Korea. Surface water from Boulder basin of Lake Mead, the Hoover dam, and the lower Colorado River in the USA had average concentrations of perfluorooctanoate that were below the method reporting limit of 5 ng/L; however, samples affected by run-off from municipal wastewater treatment facilities had average concentrations of perfluorooctanoate ranging from 26 to 120 ng/L (Quiñones & Snyder, 2009).
Concentrations of perfluorooctanoate in water were measured in six public-water districts and for selected private wells in West Virginia, USA; these concentrations differed substantially by water district, varying by about three orders of magnitude (Fig. 1.2) (Shin et al., 2011a). Perfluorooctanoate has also been measured at concentrations exceeding 1 ng/L in many of more than 8000 samples of surface water and groundwater collected in the region surrounding a large fluoropolymer-production facility in West Virginia, USA, probably due to direct emissions to the Ohio River, the air, and long-term transport through the vadose zone (DuPont, 2010). The highest off-site environmental concentrations of PFOA were predicted to occur about 1 mile [1.6 km] away from the production facility, and average concentrations in drinking-water ranged from < 0.05 to 10.1 µg/L in 2002–2004 (Paustenbach et al., 2007).
Fig. 1.2
Measured and modelled concentrations of perfluorooctanoic acid (PFOA) in water for the six public water districts in the C8 Health Project/C8 Science Panel studies, USA
(d) Food
PFOA may be found in food due to contamination of plants and animals, and/or via transfer from food-packaging materials. Trudel et al. (2008) summarized several studies reporting measurements of PFOA in food in North America and Europe. Among the food categories, snacks and potatoes were reported to have the highest concentrations of PFOA (up to 3 ng/g wet weight), followed by packaged cereal products, meat, and North American fish/shellfish (up to 0.5, 1.0, and 2.0 ng/g, respectively). A list of measurements of PFOA concentrations in various foods is provided in Table 1.3.
Table 1.3
Concentrations of perfluorooctanoic acid (PFOA) in food and water.
(e) Dust
Trudel et al. (2008) and Fromme et al. (2009) reviewed the literature and estimated the concentrations of PFOA in dust in typical indoor environments as 100 ng/g and 19.72 ng/g, respectively.
Several studies suggested that the potential contribution of dust ingestion to exposure was higher than previously estimated. For example, one study in the USA reported a median concentration of PFOA in dust of 142 ng/g, and a 95th percentile of 1200 ng/g in dust collected at 102 homes and 10 day-care centres in Ohio and North Carolina, USA, in 2000–2001 (Strynar & Lindstrom, 2008). A study of 102 homes in Vancouver, Canada, reported median concentrations of 30 ng/g for PFOA in dust, 63 ng/g for 8:2 FTOH, and 1362 ng/g for the sum of polyfluoroalkyl phosphoric acid diesters containing at least one 8:2 polyfluoroalkyl group, suggesting that these potential precursors may contribute substantially to the body burden of PFOA if efficiently metabolized in the human body (De Silva et al., 2012).
1.3.2. Occupational exposure
In occupational settings, the primary routes of exposure are thought to be dermal and by inhalation (IFA, 2014). Studies of occupational exposure have typically described exposures to ammonium perfluorooctanoate, a salt of PFOA that is often produced in industry (Lundin et al., 2009; Woskie et al., 2012).
Woskie et al. (2012) summarized measurements of ammonium perfluorooctanoate in 2125 blood samples collected from workers in a fluoropolymer-production facility in West Virginia, USA, in 1972–2004; there was a peak in median serum concentrations in 2000 that exceeded 1000 μg/L in most highly exposed groups when PFOA was at the point of highest use. In 2000–2004, median serum concentration of perfluorooctanoate among these workers was 240 μg/L. Measured serum concentrations were paired with work histories to construct a model predicting serum concentration by job-exposure group from 1950 to 2004; in most years, the highest exposures were predicted for operators exposed to the fine powder or granular polytetrafluoroethylene chemical, for whom the predicted serum perfluorooctanoate concentration peaked in 1980, exceeding 6000 μg/L, and declined to about 2000 μg/L in 2004. Predicted serum concentrations in operators exposed to fluorinated ethylene propylene/perfluoroalkoxy were < 1000 μg/L before 1975, increasing to about 2000 μg/L by 2004. Predicted serum concentrations for operators using the fine powder/granular polytetrafluoroethylene finish declined from about 1500–2000 μg/L in 1950–1980 to about 500–1000 μg/L in 1990–2004. Predicted serum concentrations for job-exposure groups with intermittent direct or plant background exposures were < 1600 μg/L in all years.
Another study of 506 fluoropolymer-production workers in Belgium, Minnesota, and Alabama, USA, reported a median serum concentration of perfluorooctanoate of 1100 μg/L in 2000 (Olsen & Zobel, 2007). Median serum concentrations of perfluorooctanoate were 650, 950, and 1510 μg/L among workers at the facilities in Belgium, Minnesota, and Alabama, respectively.
In both studies described above, serum perfluorooctanoate measurements exceeded 10 000 μg/L for some workers (Olsen & Zobel, 2007; Woskie et al., 2012). No measurements of PFOA, ammonium perfluorooctanoate, or precursors in workplace air, work surfaces, or skin were reported in these studies of occupational exposure. In a separate study, Kaiser et al. (2010) reported eight-hour time-weighted average (TWA) concentrations of PFOA in air ranging from 0.004–0.065 mg/m3 near process sumps in an unidentified facility producing ammonium perfluorooctanoate and PFOA.
In China, 48 workers involved in the manufacture of footware had mean serum concentrations of PFOA of 6.93 μg/L (range, 0.17–117.7 μg/L) (Zhang et al., 2011).
As part of an international epidemiological study of workers in six plants manufacturing polytetrafluoroethylene in Germany, the Netherlands, Italy, the United Kingdom, New Jersey, and West Virginia, Sleeuwenhoek & Cherrie (2012) estimated exposure to ammonium perfluorooctanoate by inhalation and dermal routes using modelling. The exposure reconstructions were made using descriptive information about the workplace environment and work processes, including changes over time in local ventilation, use of respiratory protective equipment, working in a confined space, outdoor work, cleanliness and the level of involvement of the workers in the process (for example, operator or supervisor). There were very few measurements of exposure available from the plants (all unpublished) and so the exposure estimates were expressed on an arbitrary dimensionless scale. In each plant, the highest estimated exposures to ammonium perfluorooctanoate were considered to have occurred in the polymerization area, with an annual decline in exposure varying from 2.2% to 5.5%. At any point in time, the differences between plants in the average estimated exposure level for polymerization workers were up to about fivefold. Among workers in the six plants whose jobs involved exposure to both tetrafluoroethylene and ammonium perfluorooctanoate, the correlation between the two exposure estimates was 0.72 (Sleeuwenhoek & Cherrie, 2012). There were some workers with no exposure to ammonium perfluorooctanoate and low-to-moderate exposure to tetrafluoroethylene, but no workers who were exposed to ammonium perfluorooctanoate without tetrafluoroethylene exposure (Sleeuwenhoek & Cherrie, 2012; Consonni et al., 2013).
1.3.3. Exposure in the general population
(a) Serum concentrations
Human exposure to PFOA has often been assessed using measured or predicted concentrations of perfluorooctanoate in serum or plasma (Eriksen et al., 2009; Fromme et al., 2009; Bonefeld-Jorgensen et al., 2011; Barry et al., 2013; Vieira et al., 2013a; Hardell et al., 2014). The pharmacokinetics of PFOA differ widely between species, with short half-lives and strong sex differences in rats, but a half-life of 2.3–3.5 years and no observed sex differences in humans (Olsen et al., 2007; Bartell et al., 2010). The Canadian Health Measures Survey reported that the median and geometric mean plasma concentrations of perfluorooctanoate among Canadians aged 20–79 years in 2007–2009 were both 2.5 μg/L, and the 95th percentile was 5.5 μg/L (Environment Canada, 2012).
The California Environmental Contaminant Biomonitoring Program reported median serum measurements of perfluorooctanoate of 2.49 μg/L for 1337 teachers and school administrators in 2011–2014, and 0.474 μg/L for 77 pregnant women in 2010–2011 (California Department of Public Health, 2014). Yeung et al. (2013) reported a median serum PFOA concentration of 2.34 µg/L among 25 Australian liver donors in 2007–2009, noting a substantial decline in serum PFOA compared with previous reports of pooled Australian samples in 2002–2003 [7.6 μg/L] (Kärrman et al., 2006) and 2006–2007 [6.4 μg/L] (Toms et al., 2009). In a study of 413 pregnant and nursing women in Sweden, serum PFOA concentrations declined by an average of 3.1% per year (95% CI, 1.8–4.4%) from 1996–2010 (Glynn et al., 2012).
Geometric mean serum concentrations of perfluorooctanoate in the USA population based on serum measurements from the National Health and Nutrition Examination Survey were 5.2 μg/L, 3.9 μg/L, 3.9 μg/L, and 4.1 μg/L in 1999–2000, 2003–2004, 2005–2006, and 2007–2008, respectively, with similar concentrations in different age groups, but slightly higher concentrations in males than females (Calafat et al., 2007a; Kato et al., 2011). The 95th percentile of serum perfluorooctanoate concentrations did not exceed 12 μg/L in any of those years (Kato et al., 2011). Pooled samples from 3802 Australian residents in 2002–2003 yielded a mean perfluorooctanoate serum concentration of 7.6 μg/L (Kärrman et al., 2006) – a value roughly consistent with the geometric mean in the USA, considering that these measurements were positively skewed. Smaller studies of general populations in Europe, Asia, and the USA for samples collected in 1989–2006 have produced similar findings, with reported average concentrations ranging from 1.6 to 11.6 μg/L (Fromme et al., 2009).
Several studies of serum measurements of perfluorooctanoate are available for stored samples collected before the 1990s. Olsen et al. (2005) reported a median serum concentration of perfluorooctanoate of 2.3 μg/L for 178 blood samples collected in Maryland, USA, in 1974, and Harada et al. (2004) reported a geometric mean serum concentration of perfluorooctanoate of 0.2 μg/L for 39 blood samples collected from females in Miyagi, Japan, in 1977. Haug et al. (2009) reported serum concentrations of perfluorooctanoate in samples from a biobank of hospital patients in Norway, pooling samples by year (n > 19 for most years) for the period 1977–2006. Perfluorooctanoate serum concentrations in this study rose from 0.58 μg/L in 1977 to 1.3 μg/L in 1980, 3.3 μg/L in 1990, and 4.5 μg/L in 2000, falling to 2.7 μg/L in 2006.
Mean concentrations of perfluorooctanoate were measured in 258 samples of blood, serum, or plasma collected from men between 2000 and 2004 in the USA (Michigan) (5.7 μg/L; < 3–14.7 μg/L), Colombia (6.2 μg/L; 3.9–12.2 μg/L), Brazil (< 20 μg/L), Belgium (5.0 μg/L; 1.1–13 μg/L), Italy (< 3 μg/L), Poland (20.5 μg/L; 11–40 μg/L), India (3.5 μg/L; < 3–3.5 μg/L), Malaysia (< 10 μg/L), suggesting the presence of specific sources of PFOA in this country (Kannan et al., 2004). Relatively higher concentrations of PFOA were reported in the Republic of Korea (35.5 μg/L; < 15–71.4 μg/L) (Kannan et al., 2004).
Overall, the published data suggested that serum PFOA concentrations in the general population increased over time until about 2000, and have remained constant or decreased since that time.
Higher serum concentrations of perfluorooctanoate have been reported in general populations near production facilities and other known exposure sources. For example, the geometric mean serum concentration of perfluorooctanoate in 2005–2006 among 69030 residents living near a production facility in West Virginia, USA, was 32.9 μg/L (standard deviation, 241 μg/L). Exposures in that community varied substantially across six water districts; the mean serum concentration of PFOA was about 16 µg/L in the two water districts with the lowest water concentrations of PFOA, and 228 µg/L in the water district with the highest concentrations (Frisbee et al., 2009). A study of 641 residents of Arnsberg, Germany, in 2006 reported mean serum concentrations of perfluorooctanoate of 24.6, 26.7, and 28.5 μg/L in children, mothers, and men, respectively, due to surface water contamination from upstream agricultural use of soil conditioner mingled with industrial waste (Hölzer et al., 2008).
(b) Breast milk
PFOA has been measured in breast milk; these data are presented in Table 1.4.
Table 1.4
Concentrations of perfluorooctanoic acid (PFOA) in human breast milk.
In North Rhine-Westphalia, Germany, more than half of the samples analysed in 2007 (n = 203) contained PFOA; concentrations up to 610 ng/L have been reported (Bernsmann & Fürst, 2008). In China, PFOA was measured in 100% of the breast milk samples analysed (n = 19) in 2004 (So et al., 2006).
(c) Exposure sources
As PFOA and its precursors are not routinely or systematically monitored in air, water, dust, food, or drinking-water, the relative contributions of exposure sources in the general population are not well understood. Published studies of exposure have relied on synthesis of environmental measurements collected at varying times and places, often in different countries. These studies comprise the best available data, but are typically based on convenience samples in one or few locations, and may not be representative of regional, national, or global exposures.
One such study has estimated that diet (including transfer of PFOA from food packaging) contributes 99% of total exposure to PFOA for adults in the general population in “western” countries, with negligible contributions from inhalation and ingestion of house dust and drinking-water (Fromme et al., 2009). Estimated adult mean PFOA intakes via indoor air, outdoor air, house dust, diet, and drinking-water were 0.053, 0.076, 0.986, 169, and 1.3 ng/day, respectively. The estimated dietary contribution was based on PFOA measurements in a 7-day duplicate-diet study of 31 participants aged 16–45 years in Germany (Fromme et al., 2007); estimated inhalation contributions were based on PFOA measurements at one indoor and four outdoor sites in Europe (Barber et al., 2007; the estimated house-dust ingestion contribution was based on measurements of PFOA from 67 homes in Ottawa, Canada, in the winter (Kubwabo et al., 2005), and the estimated contribution of drinking-water ingestion was based on river-water samples from the Rhine and its tributaries in Germany (Skutlarek et al., 2006). The contribution of house dust to PFOA exposure was based on a conservative estimate of 5% conversion of 8:2 FTOH to PFOA. Other precursor concentrations may actually exceed those of PFOA and 8:2 FTOH in house dust, but the extent of precursor metabolism in humans is unclear (De Silva et al., 2012).
Trudel et al. (2008) estimated that ingestion of food and house dust contributed > 90% of exposure to PFOA in adults, noting that PFOA-treated carpets and ingestion of dust may account for a larger proportion of exposure among children than adults. Typical uptake doses of PFOA for infants, toddlers, children, and teenagers/adults were estimated at 9.8, 7.6, 5.0, and 2.5–3.1 ng/kg body weight (bw) per day in North America and 6.0, 7.6, 6.7, and 2.8–4.1 ng/kg bw per day in Europe, respectively, based primarily on food concentrations of PFOA from data extracted from four previous studies covering 17 food categories with 1–131 samples each (for most food categories, measurements from Europe and North America were combined due to small sample sizes) and house-dust concentrations of PFOA from data from three small studies in Canada, Japan, and the USA (Moriwaki et al., 2003; Costner et al., 2005; Kubwabo et al., 2005). Infants may be exposed primarily through mother’s milk (So et al., 2006; Kärrman et al., 2010; Kim et al., 2011a), for which the estimated perfluorooctanoate concentration was reported as 0.1 ng/g (Trudel et al., 2008).
However, drinking-water may have a larger contribution to exposure to PFOA in some populations. For example, Kim et al. (2011b) estimated that drinking-water ingestion contributes 30% of total exposure to PFOA in the Republic of Korea, where urban water supplies are often contaminated.
Drinking-water is thought to have been the predominant source of intake of PFOA for a highly exposed population near a production facility in West Virginia, USA, studied by the C8 Science Panel (Barry et al., 2013; Vieira et al., 2013a; Steenland et al., 2014), where both surface water and groundwater were contaminated by water and air emissions from the facility (Shin et al., 2011a).
Although residual amounts of PFOA (4–75 ng/g) and 8:2 FTOH are contained in non-stick cookware and can be released to the gas phase in small quantities when heated to normal cooking temperature, their contribution to exposure tends to decline with repeated use and is believed to be negligible compared with other exposure sources (Fromme et al., 2009). One study of four non-stick cookware items (with three samples each) reported emission rates of 19–287 and 42–625 pg/cm2, for PFOA and 8:2 FTOH respectively, upon first heating after purchase; concentrations of gas-phase PFOA were shown to decrease after repeated use (four times) for some cookware brands, but not for others. PFOA may be off-gassed at different rates from non-stick coatings, depending on how the non-stick coating was prepared and applied (Sinclair et al., 2007).
1.4. Regulations and guidelines
The EPA has a Provisional Health Advisory value of 0.4 µg/L for PFOA in drinking-water (EPA, 2009b).
The European Food Safety Authority (EFSA) recommended a tolerable daily intake (TDI) for PFOA of 1.5 µg/kg bw per day (EFSA, 2008).
The Environmental Agency of Norway has announced the following limits on PFOA in consumer products, which became effective as from 1 July 2014: 10 ppm in substances and mixtures; 1 mg/m2 in textiles, carpeting, and other coated consumer products; and 1000 ppm in other consumer products. Food packaging, food contact materials, and medical devices are exempt from these limits in Norway (UL, 2014).
Germany has established an air quality control limit for PFOA of 0.15 g/hour and 0.05 mg/m3 of dusts (including ammonium perfluorooctanoate) in exhaust gas (IFA, 2014).
PFOA and ammonium pentadecafluorooctanoate have been identified by the European Chemicals Agency as a Substance of Very High Concern under Article 57 (c) of the REACH (Registration, Evaluation, Authorisation and Restriction of Chemicals) regulations as toxic for reproduction 1B and under Article 57 (d) as a substance that is persistent, bioaccumulative, and toxic, in accordance with the criteria and provisions set out in Annex XIII of the Regulations (ECHA, 2013).
- Exposure Data - Some Chemicals Used as Solvents and in Polymer ManufactureExposure Data - Some Chemicals Used as Solvents and in Polymer Manufacture
Your browsing activity is empty.
Activity recording is turned off.
See more...