

NCBI Bookshelf. A service of the National Library of Medicine, National Institutes of Health.
The NCBI Handbook [Internet]. 2nd edition. Bethesda (MD): National Center for Biotechnology Information (US); 2013-.
This publication is provided for historical reference only and the information may be out of date.

Scope
The Gene Expression Omnibus (GEO) is an international public repository that archives and freely distributes microarray, next-generation sequencing, and other forms of high-throughput functional genomic data sets (1). Approximately 90% of the data in GEO are gene expression studies that investigate a broad range of biological themes including disease, development, evolution, immunity, ecology, toxicology, metabolism, and more. The non-expression data in GEO represent other categories of functional genomic and epigenomic studies including those that examine genome methylation, chromatin structure, genome copy number variations, and genome–protein interactions. A breakdown of GEO data types and technologies is provided on the repository Summary page.
Data in GEO represent original research submitted by the scientific community in compliance with grant or journal provisos that require data to be made available in a public repository, the objective being to facilitate independent evaluation of results, reanalysis, and full access to all parts of the study. The resource supports archiving of all parts of a study including raw data files, processed data, and descriptive metadata, which are indexed, cross-linked, and searchable. While the principal role of GEO is to serve as a primary data archive, the resource also offers several tools and features that allow users to explore, analyze, and visualize expression data from both gene-centric and study-centric perspectives.
To summarize, the main goals of GEO are to:
- Provide a robust, versatile primary data archive database in which to efficiently store a wide variety of high-throughput functional genomic data sets.
- Offer simple submission procedures and formats that support complete and well-annotated data deposits from the research community.
- Provide user-friendly mechanisms that allow users to locate, review, and download studies and gene expression profiles of interest.
History
The post-genomic era has led to a multitude of high-throughput methodologies that generate massive volumes of gene expression and other types of functional genomic and epigenomic data. The GEO database was established in 2000 to archive the burgeoning volumes of microarray gene expression data beginning to be produced by the research community at that time (2). Furthermore, as microarrays became used routinely in almost every area of biological research, many journals adopted the requirement that the microarray data discussed in manuscripts should be deposited in a public repository so that anyone could freely access and critically evaluate the data. Today, GEO archives data for approximately 40,000 studies comprising a million samples, for over 2200 organisms, submitted by 15,000 laboratories from around the world. Users can track database growth on the GEO History page.
Since its inception, many aspects of the GEO database and operating procedures have undergone major revisions and development, including: increasingly stringent submission requirements, concomitant with developing community standards like MIAME (Minimum Information About a Microarray Experiment) (3); enhanced submission formats that ease the burden on submitters and promote well-annotated MIAME-compliant data; improved indexing and analysis tools that help users more easily locate information relevant to their interests; and database modifications to support evolving data types, including next-generation sequence data.
Data Model
The GEO database archives a wide variety of rapidly evolving, large-scale functional genomic experiment types. These studies generate data of many different file types, formats, and content that consequently present considerable challenges in terms of data handling and querying. The core GEO database has built-in flexibility to accommodate diverse data types. Notably, tabular data are not fully granulated in the core database. Rather, they are stored as plain text, tab-delimited tables that have no restrictions on the number of rows or columns allowed. However, some columns reserve special meaning, and data from these are extracted to secondary resources, including the GEO Profiles database, and used in downstream query and analysis applications such as GEO2R. Accompanying raw data files are stored on an FTP server and linked from each record. Contextual biological descriptions, protocols, references, and other metadata are stored in designated fields within a relational MSSQL database.
An outline of the GEO data structure is presented in Figure 1. The data are organized into the following entities:
Platform
A Platform record contains a description of the array or sequencer and, for array-based Platforms, a data table defining the array template. The information within Platform records is supplied by submitters or commercial vendors. Each Platform record is assigned a unique and stable GEO accession number with prefix GPL. A Platform may reference many Samples that have been deposited by multiple submitters. Platforms are indexed and searchable using the Entrez GEO DataSets interface.
Sample
A Sample record contains a description of the biological material and the experimental protocols to which it was subjected. A data table with normalized abundance measurements for each feature on the corresponding Platform is usually included, as well as links to corresponding raw data files. The information within Sample records is supplied by submitters. Each Sample record is assigned a unique and stable GEO accession number with prefix GSM. A Sample entity must reference only one Platform and may be included in multiple Series. Samples are indexed and searchable using the Entrez GEO DataSets interface.
Series
A Series record links together a group of related Samples and provides a focal point and description of the whole study. The information within Series records is supplied by submitters. Each Series record is assigned a unique and stable GEO accession number with prefix GSE. Series are indexed and searchable using the Entrez GEO DataSets interface.
DataSet
The submitter-supplied Platform, Sample, and Series data are very heterogeneous with regards to the style, content, and level of detail with which the studies are described. But despite this diversity, all array-based gene expression submissions share a common core set of elements:
- sequence identity tracking information of each feature on the Platform
- normalized expression measurements within Sample tables
- text describing the biological source of the sample and the study aim
Through a procedure that employs both automated data extraction and manual curation, these three categories of information are captured from the submitter-supplied records and organized into an upper-level record called a curated GEO DataSet. A DataSet comprises a description of the study as well as consistently processed and comparable Samples that are categorized according to experimental variables. Each DataSet record is assigned a unique and stable GEO accession number with prefix GDS. DataSets are indexed and searchable using the Entrez GEO DataSets interface.
Profiles
GEO Profiles are derived from GEO DataSets. A GEO Profile is a gene-centered representation of the data that presents gene expression measurements for one gene across a DataSet. Profiles are indexed and searchable using the Entrez GEO Profiles interface.
Information about how to use and interpret GEO DataSets and Profiles is provided in the Access section.
Dataflow
Researchers typically initiate a data deposit to GEO before a manuscript describing the study has been submitted to a journal for review. Researchers use their MyNCBI account to login and register submissions. Several submission formats are supported including spreadsheets and XML, see the full submission instructions.
All deposits undergo syntactic validation as well as review by a GEO curator to ensure that data are organized correctly and contain sufficient information to interpret the study. If content or structural problems are identified, the curator works with the submitter until the issue is resolved. Once the data pass review, stable GEO accession numbers are assigned and can be cited in the manuscript. Researchers usually keep their GEO records private until the corresponding manuscript is published. During this period, researchers have the option to generate a reviewer URL that grants anonymous, confidential access to their private data, which can be provided to journal editors for review purposes.
Upon release, Platform, Sample, and Series records are indexed in the Entrez GEO DataSets database where users can query and download the data, or perform a gene expression analysis using the GEO2R comparison tool. Some components of GEO submissions are brokered to other NCBI databases, including original next generation sequence reads to SRA and study descriptions to BioProject, with reciprocal links back to GEO as appropriate.
At approximately monthly intervals, selected Series undergo further processing by curators to create GEO DataSet and GEO Profile records. GEO DataSet records represent curated collections of biologically and statistically comparable GEO Samples, and are indexed in the Entrez GEO DataSets database. GEO Profiles are derived from GEO DataSets and depict expression measurements for an individual gene across all Samples in that DataSet. Profiles are indexed in the Entrez GEO Profiles database.
Access
GEO has a suite of tools that allow users to browse, download, query, analyze, and visualize data relevant to their specific interests.
Browse
The GEO repository browser has tabs containing tables that list Series, Sample, Platform, and DataSet records. The tables include information that can be searched and filtered, as well as links to related records and supplementary file downloads. The tables can be exported and include further information not displayed on the browser, including corresponding PubMed identifiers and related SRA accessions.
Download
All the data in GEO can be downloaded in a variety of formats using a variety of mechanisms (see the Download GEO data documentation). Options include bulk data download directly from the FTP site or from links on records using the ‘Send to: File’ feature on Entrez GEO DataSet or Entrez GEO Profiles retrievals or programmatically using E-utilities.
Query
NCBI has a powerful search and retrieval system called Entrez that can be used to search the content of its network of integrated databases. GEO data are available in two separate Entrez databases referred to as Entrez GEO DataSets and Entrez GEO Profiles. A typical workflow is for the user to first identify studies of interest by querying Entrez GEO DataSets, and then use either GEO2R or GEO Profiles to identify specific genes or gene expression patterns within that study. Alternatively, the user can query the Entrez GEO Profiles database directly to retrieve the expression patterns of a specific gene across all curated GEO DataSets. A rich complement of Entrez links is generated to connect data to related information: inter-database links reciprocally connect GEO to other NCBI resources such as PubMed, GenBank, and Gene; intra-database links connect genes related by expression pattern, chromosomal position, or sequence. Both databases are extensively indexed under many separate fields, meaning that users can refine their searches by constructing fielded queries. The Faceted search tool, located on the left side of retrievals, can help users filter and refine their Entrez results, and the Advanced search tools enable generation of complex multipart queries or combinations of multiple queries to find common intersections in search results.
Query Entrez GEO DataSets
This database stores descriptions of the original submitter-supplied Platform, Sample, and Series records as well as curated DataSets. The Entrez GEO DataSets database can be searched using many different attributes including keywords, organism, study type, and authors. More information about how the results are displayed and supported query fields is provided at About GEO DataSets and Querying GEO DataSets pages. Example queries include:
| Retrieve studies that investigate the effect of smoking or diet on non-human mammals |
| (smok* OR diet) AND (mammals[organism] NOT human[organism]) |
| Search for studies that examine gene expression using next-generation sequencing |
| "expression profiling by high throughput sequencing"[DataSet Type] |
| Retrieve submissions that have Affymetrix CEL files |
| cel[Supplementary Files] |
| Search for curated DataSets that have 'age' as an experimental variable |
| age[Subset Variable Type] |
| Retrieve studies that consist of between 100 and 500 samples |
| 100:500[Number of Samples] |
| Retrieve studies that include ‘Smith, A.’ as an author |
| smith a[Author] |
Query Entrez GEO Profiles
This database stores gene expression profiles derived from curated GEO DataSets. Each Profile is presented as a chart that displays the expression level of one gene across all Samples within a DataSet. Experimental context is provided in the bars along the bottom of the charts making it possible to see at a glance whether a gene is differentially expressed across different experimental conditions. The Entrez GEO Profiles database can be searched using many different attributes including keywords, gene symbols, gene names, GenBank accession numbers, or Profiles flagged as being differentially expressed. More information about how the results are displayed and supprted query fields is provided at About GEO Profiles and Querying GEO Profiles pages. Example queries include:
| Retrieve all gene expression profiles for CYP1A1 |
| CYP1A1[Gene Symbol] |
| Retrieve gene expression profiles of CYP1A1 or ME1 in DataSets that investigate the effects of smoking or diet |
| (CYP1A1[Gene Symbol] OR ME1[Gene Symbol]) AND (smok* OR diet) |
| Retrieve gene expression profiles for all kinases in the DataSet with accession number GDS182 |
| kinase[Gene Description] AND GDS182 |
| Retrieve all gene expression profiles for genes that have the Gene Ontology(GO) term ‘apoptosis’ in the DataSet with accession number GDS182 |
| apoptosis[Gene Ontology] AND GDS182 |
| Retrieve gene expression profiles for genes that lie within base range 10000:3000000 on chromosome 8 in mouse |
| (8[Chromosome] AND 10000:3000000[Base Position]) AND mouse[organism] |
| Retrieve genes that exhibit differential expression in DataSets that examine the effect of an agent |
| agent[Flag Information] AND "value subset effect"[Flag Type] |
GEO BLAST
Another way to query the GEO Profiles database is by nucleotide sequence similarity using GEO BLAST. The GEO BLAST database contains all GenBank sequences represented on microarray Platforms that participate in curated DataSets. This BLAST interface performs a standard BLAST sequence search and retrievals point to corresponding gene expression profiles in the GEO Profiles database. This interface is helpful in identifying gene expression information for sequence homologs of interest, e.g., related gene family members or for cross-species comparisons.
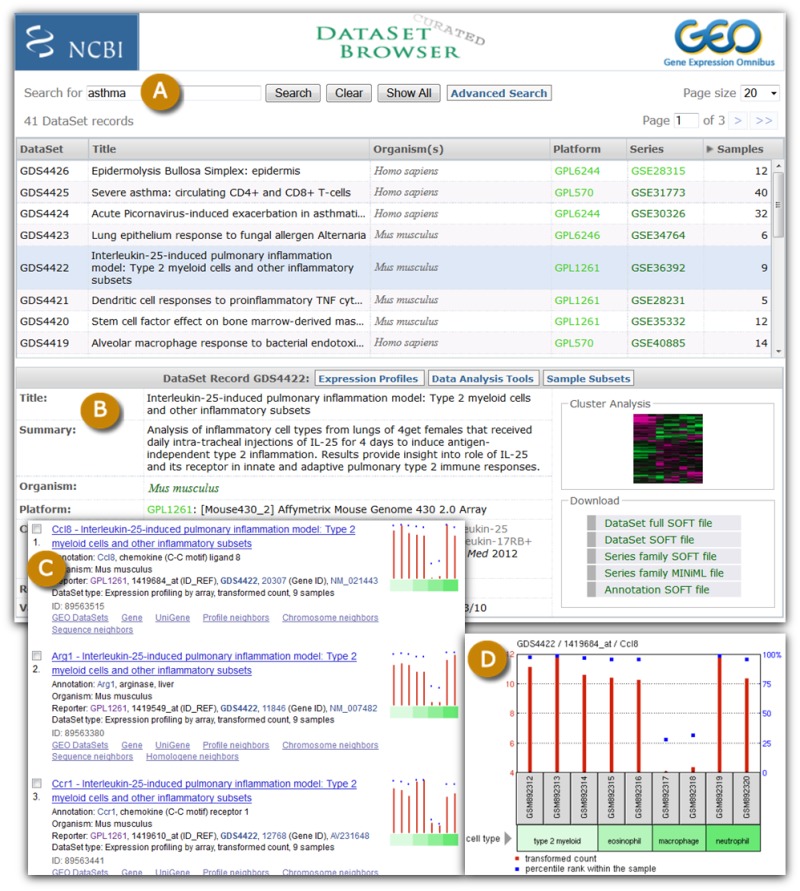
Figure 2.
A selection of GEO DataSet and Profile screenshots. The DataSet Browser (A) enables simple keyword searches for curated GEO DataSets. When a DataSet is selected, a window appears (B) that contains detailed information about that DataSet, download options, and links to analysis features including gene expression profiles in Entrez GEO Profiles (C). Each expression profile chart can be viewed in more detail to see the activity of that gene across all Samples in that DataSet (D).
Analyze and visualize
In addition to being able to query and locate specific studies and genes of interest as described above, users may choose to examine those studies further and identify genes that have particular expression characteristics such as being highly expressed in one type of experimental condition compared to another, or having similar expression patterns to a selected profile of interest. GEO provides several tools and graphical renderings that facilitate interpretation and visualization of microarray-based gene expression data. These tools do not require specialized knowledge of microarray analysis methods, nor do they require time-consuming download or processing of large sets of data.
DataSet Analysis Tools
Several features are provided on curated DataSet and Profile records to assist with identification of genes of interest. These include:
- Pre-calculated, interactive cluster heatmap images that help detect natural groups of coordinately regulated genes. Areas of the cluster can be selected and underlying expression values downloaded or exported to Entrez GEO Profiles.
- A ‘compare 2 sets of samples’ tool that offers rudimentary Student’s t-test analysis to locate differentially expressed genes between two sets of samples.
- A Find genes feature that retrieves genes that have been flagged as being differentially expressed according to specific experimental variables.
- Boxplot images that display the distribution of expression values together with experimental design are useful for quality control checks.
- Various categories of Neighbors on GEO Profiles, which, e.g., connect genes that show a similar expression pattern to the chosen Profile, or retrieve Profiles from across all DataSets that are related by Homologene group.
GEO2R
GEO2R is an interactive online tool that allows users to perform a sophisticated R-based analysis of GEO data to help identify and visualize differential gene expression. Unlike GEO’s DataSet Analysis Tools described above, GEO2R does not rely on curated DataSet records but rather interrogates original submitter-supplied data directly as soon as they are released. GEO2R uses established Bioconductor R packages (4, 5) to transform and analyze GEO data. The application allows users to designate up to 10 groups of Samples to compare, and offers several statistical parameters with which to perform the analysis. Results are presented as a table of genes ordered by significance. The results table contains various categories of statistics, including P-values, t-statistics, and fold change, as well as gene annotations, including gene symbols, gene names, Gene Ontology (GO) terms, and chromosome locations. The expression pattern of each gene in the table can be visualized by clicking the row to reveal expression profile graphs or the complete set of ordered results can be downloaded as a table. Alternatively, if users are not interested in performing differential expression analysis but rather only want to see the expression profile of a specific gene within a study, they can bypass all the above and simply enter the Platform gene ID to visualize that profile. To assist users replicate their analyses, the native R script generated in each session is provided so it can be saved as a reference for how results were calculated, or used to reproduce GEO2R top genes results. A YouTube video tutorial demonstrating GEO2R functionality is available.
References
- 1.
- Barrett T, Wilhite SE, Ledoux P, Evangelista C, Kim IF, Tomashevsky M, Marshall KA, Phillippy KH, Sherman PM, Holko M, Yefanov A, Lee H, Zhang N, Robertson CL, Serova N, Davis S, Soboleva A. NCBI GEO: archive for functional genomics data sets--update. Nucleic Acids Res. 2013Jan 41Database issueD991–5. [PMC free article: PMC3531084] [PubMed: 23193258]
- 2.
- Edgar R, Domrachev M, Lash AE. Gene Expression Omnibus: NCBI gene expression and hybridization array data repository. Nucleic Acids Res. 2002Jan 1 30(1):207–10. [PMC free article: PMC99122] [PubMed: 11752295]
- 3.
- Brazma A, Hingamp P, Quackenbush J, Sherlock G, Spellman P, Stoeckert C, Aach J, Ansorge W, Ball CA, Causton HC, Gaasterland T, Glenisson P, Holstege FC, Kim IF, Markowitz V, Matese JC, Parkinson H, Robinson A, Sarkans U, Schulze-Kremer S, Stewart J, Taylor R, Vilo J, Vingron M. Minimum information about a microarray experiment (MIAME)-toward standards for microarray data. Nat Genet. 2001Dec 29(4):365–71. [PubMed: 11726920]
- 4.
- Davis S, Meltzer PS. GEOquery: a bridge between the Gene Expression Omnibus (GEO) and BioConductor. Bioinformatics. 2007Jul 15 23(14):1846–7. [PubMed: 17496320]
- 5.
- Gentleman RC, Carey VJ, Bates DM, Bolstad B, Dettling M, Dudoit S, Ellis B, Gautier L, Ge Y, Gentry J, Hornik K, Hothorn T, Huber W, Iacus S, Irizarry R, Leisch F, Li C, Maechler M, Rossini AJ, Sawitzki G, Smith C, Smyth G, Tierney L, Yang JY, Zhang J. Bioconductor: open software development for computational biology and bioinformatics. Genome Biol. 2004;5(10):R80. [PMC free article: PMC545600] [PubMed: 15461798]
- Gene Expression Omnibus (GEO) - The NCBI HandbookGene Expression Omnibus (GEO) - The NCBI Handbook
Your browsing activity is empty.
Activity recording is turned off.
See more...