Introduction
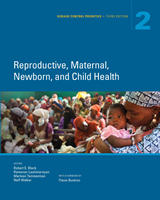
Each year, 27 percent of the world’s newborn deaths— about 748,000—occur in India according to 2013 estimates (UN IGME 2014). India’s newborn mortality rate (NMR) has declined by nearly 43 percent since 1990. However, this decline has been much slower than the decline in the mortality rate for children under age five years, which has dropped by 58 percent during the same period. Consequently, the share of newborn deaths among all under-five deaths in India has risen from 41 percent in 1990 to 56 percent in 2013, highlighting the relative lack of progress made in newborn survival. Conditions associated with neonates—such as preterm birth complications and sepsis—rank among the top 10 causes of all premature mortality in India (CDC 2015). A study in 2005 found that prematurity and low birth weight, infections, birth asphyxia, and birth trauma caused nearly 80 percent of newborn deaths (Bassani and others 2010).
India’s NMR of 29 per 1,000 live births continues to be among the highest in the world,1 underscoring the need for a policy response (UN IGME 2014) ().2 Although antenatal care and other preventive interventions such as encouraging institutional delivery and improving maternal health care access have been implemented, their impact on newborn survival has been minimal (Hollowell and others 2009; Lim and others 2010; Singh and others 2013). Good quality postnatal care may prevent about 67 percent of all newborn deaths (WHO 2012) in India. However, availability of and access to postnatal care remain low. Data from the District Level Household Survey conducted between 2007 and 2008 suggest that only 45 percent of newborns in India underwent a health examination within the first 24 hours (IIPS 2010).
Newborn, Infant, and Child Mortality in India, 1990–2015.
In addition to low levels of access to newborn care in general, large regional and socioeconomic differences in access lead to significant variations in outcomes. The mortality among newborns in India’s rural areas is twice that in urban areas—34 and 17 per 1,000 live births, respectively— with mortality rates substantially exceeding the national average in the poorer and larger states of Madhya Pradesh, Uttar Pradesh, Odisha, Rajasthan, Jammu and Kashmir, and Chhattisgarh (Chand and others 2013).
In this chapter, we examine the health and economic benefits and the cost to the government associated with scaling up a publicly financed home-based neonatal care (HBNC) package in rural India. We consider two intervention scenarios against a baseline of no HBNC:
In the first scenario, we examine the scaling up of access to HBNC through the current network of accredited social health activists (ASHA)—a group of community health workers (CHWs) that covers 60.1 percent of India’s villages (or roughly 54 percent of the rural population)—to those not presently receiving care. Of rural newborns, 39.8 percent receive some form of home- or facility-based newborn care during the first 10 days of life (
IIPS 2010). By extending HBNC within the current network of ASHA workers, 72 percent of the rural newborn population would have access to care either through the HBNC package or their existing home-or facility-based care.
In the second scenario, we analyze a near-universal setting in which access to HBNC—through expansion of the network of CHWs—is extended to 83.4 percent of those not presently receiving care. With this extension, 90 percent of the rural neonate population would have access to the HBNC package or their existing home- or facility-based care.
Box 18.1 provides information on the types of CHWs and the primary health systems in which they operate.

Community Health Workers in India. Structure of India’s health system India’s primary care network consists of two types of institutions: primary health subcenters and primary health centers. As of March 2014, India had 152,326 primary (more...)
Home- and Community-Based Neonatal Care in India
In 2011, the government of India introduced an HBNC package—to be delivered by ASHAs—that includes five or six home visits during the first month after birth for children born at health facilities or at home, respectively (Ministry of Health and Family Welfare 2011). The ASHAs provide essential newborn care, particularly for preterm and low-birth-weight infants; identify illnesses; refer sick infants to health facilities; and provide information to mothers on care practices, such as thermal care and breastfeeding.
In their joint statement, the World Health Organization and the United Nations Children’s Fund recognized the role of home-based care in providing postnatal care to mothers who are unable to access it otherwise because of financial, social, physical, or other barriers (WHO/UNICEF Joint Statement 2009). In a widely cited field trial in the Indian state of Maharashtra, Bang and others (1999) find that an HBNC package—the key components of which included a method of screening high-risk neonates; management of sepsis, low birth weight, and birth asphyxia; and education and training of mothers on newborn care—reduced mortality by more than 60 percent. Kumar and others (2008) also conducted an efficacy trial of a similar community-based prevention package of essential newborn care in Uttar Pradesh. This package comprised birth preparedness, clean delivery and cord care, thermal care including skin-to-skin care, breastfeeding promotion, danger sign recognition, and liquid crystal hypothermia indicators. The authors find mortality reductions of about 54 percent. Similar results in Bangladesh and Pakistan have contributed to the growing body of evidence demonstrating the effectiveness of home-based and community-based care in improving access to postnatal care and curbing newborn deaths in countries with high barriers to institutional care (Baqui and others 2008; Bhutta and others 2008).
Although the home-based care packages in these studies share similarities, they also contain important differences in the number of home visits, kind of training provided to community workers, extent of community mobilization, and quality of the local health infrastructure (community-worker-to-population ratio). These are important considerations that might affect the efficacy of the intervention as it is scaled up to the national level (Gogia and others 2011). We note these differences but still use parameters from various studies (with sensitivity analyses) to assess the potential magnitude of the benefits that can be derived from implementing a home-based package.
Priority-Setting Methodologies
Resource allocations are guided by evidence. Cost-effectiveness analysis (CEA) is an extremely useful and widely applied method that identifies interventions that provide the most value for money on the basis of cost per disability-adjusted life year (DALY) averted (Brouwer and Koopmanschap 2000; Garber and Phelps 1997; Jamison and others 2006; WHO 2003).
CEAs are relatively simple in application, but do not include the nonhealth benefits of interventions. Adverse health events in low- and middle-income countries (LMICs) are often associated with economic hardship (O’Donnell and others 2008; van Doorslaer and others 2006, 2007; Wagstaff 2008). Households experiencing health shocks may need to finance health care costs through out-of-pocket (OOP) expenditures, which may lead to borrowing or selling of assets, thereby causing impoverishment (Gertler and Gruber 2002; Kruk, Goldmann, and Galea 2009; Wagstaff 2007). Such economic shocks may have a lasting intergenerational effect if they reduce resources available to children (Dillon 2012; Sun and Yao 2010). Free or subsidized health interventions can potentially prevent such economic shocks.
Although the literature on economic impacts of newborn morbidity is limited, several studies have shown that the financial burden of care is significant (Asian Development Bank 2012). Bonu and others (2009) find that 16 percent of households incur catastrophic expenditures of more than 10 percent of annual household consumption for antenatal and postnatal care in India. Complications caused by hemorrhage, sepsis, and dystocia were associated with 15 percent to 34 percent of total household expenditures in Benin and 5 percent to 8 percent in Ghana (Borghi and others 2003).
Therefore, the impoverishing effects of newborn morbidity should not be ignored; the economic benefits of an intervention need to be incorporated into priority-setting methodologies. Other methodologies, such as cost-consequence analysis and benefit-cost analysis, attempt to incorporate the nonhealth benefits of health interventions; but these approaches are computationally intensive and do not explicitly capture the financial risk protection that interventions provide.
In this study, we apply the method of extended cost-effectiveness analysis (ECEA) to estimate the economic benefits, in addition to health gains, of health interventions (Verguet, Laxminarayan, and Jamison 2014). ECEA has been used to examine the impacts of publicly financed interventions—for example, tuberculosis treatments in India (Verguet, Laxminarayan, and Jamison 2014) and rotavirus vaccinations in India and Ethiopia (Verguet and others 2013)—and thus to measure the distributional consequences of interventions on the health and financial outcomes for a population. Similarly, we measure the health benefits of scaling up the HBNC package in India by the resulting reductions in newborn morbidity and mortality. The economic benefits are measured from the perspective of health systems accounting, that is, the amount of OOP private medical expenditures and associated financial risk that could be averted by the HBNC.
Data and Methods
We extract information on disease epidemiology from existing studies; presents these input parameters and the interventions in our analysis. The lack of recent disease data presents a significant challenge in generating health and economic estimates that we overcome in two ways.
Disease, Treatment, and Newborn Care Package Intervention Parameters for Community Health Worker Analysis.
First, some of the parameters have been revised based on current conditions. For example, a newborn’s risk of suffering from high-risk morbidity, such as sepsis, congenital anomaly, or birth asphyxia, was observed to be 48.2 percent by Bang and others (2001). This risk is likely to have changed significantly since the 1990s; therefore we assume that the baseline probability that a neonate suffers from high-risk morbidity equals 28.3 percent, based on the most recently available neonatal mortality rate of 29.2 per 1,000 live births in India (UN IGME 2014). We continue to use the case fatality rate of 10.3 percent from severe morbidity (Bang and others 1999) on the assumption that the underlying mortality risk after contracting the disease is unlikely to have changed significantly, even with progress in access or improved economic conditions. Furthermore, because of the lack of disease data disaggregated by population subgroups, we make the simplifying assumption that the incidence and mortality rates are the same across all income quintiles.
Second, recognizing the uncertainty surrounding the true morbidity and mortality risks of newborns, we Reproductive, Maternal, Newborn, and Child Health conducted a 100-simulation Latin hypercube sampling sensitivity analysis on these risks and other intervention and cost parameters (). Results from the sensitivity analysis are used to produce 95 percent uncertainty ranges for our mean estimates. These ranges are reported in the results in the next section.
Intervention and Treatment Data
Parameters with respect to the efficacy of interventions on prevention of newborn morbidity and mortality were obtained from published studies and secondary household survey data in India. According to the District Level Household Survey–3, 39.8 percent of rural newborns receive some form of home- or facility-based newborn care during the first 10 days of life (IIPS 2010). We assumed that the HBNC package in our analysis would be administered to the remaining 60.2 percent of the neonate population without access to care (that is, baseline coverage rate of 0). We scaled up the HBNC package in our model in two scenarios. First, responsibilities of the existing ASHAs (who were available to 54 percent of the neonate population) were extended to include the HBNC. In the second scenario, access to HBNC was extended to 83.4 percent of newborns without care by assuming that more ASHAs would be used. In this scenario, a total of 90 percent of newborns born in rural India would access care either directly through the intervention or through the home- or facility-based care provided in the baseline.
Studies have shown that care packages in Gadchiroli, Maharashtra, and in Shivgarh, Uttar Pradesh, reduced the incidence of severe newborn morbidity and mortality by 50.4 percent and 54.0 percent, respectively (Bang and others 2005; Kumar and others 2008). We assumed these efficacy rates on incidence and mortality for our study, but performed a sensitivity analysis on the parameters to estimate the impact of a wide range of possible levels of intervention effectiveness. Baqui and others (2007) observe a lower efficacy on mortality reduction (34 percent) in Bangladesh of a community-led intervention, which is significant given that the intervention was conducted in India’s geographic neighborhood. Because this effect size falls below the lower limit (37.8 percent) of the efficacy on mortality reduction parameter in our sensitivity analysis, we conducted a separate analysis using an effectiveness rate of 34 percent to report the corresponding reduction in deaths.
Under our intervention scenario, the government bears the full cost of administering or expanding the HBNC program. The cost of this program is derived from the costs of administering the Integrated Management of Childhood Illnesses (IMCI) program through CHWs in Faridabad district, examined by Prinja, Mazumder, and others (2013).
Within the current ASHA network, we assumed that the cost of implementing the intervention would approximate the annual per child cost under the IMCI program of US$1.52, in addition to the US$4.37 per neonate incentive provided to each ASHA worker for delivering care, which totals US$5.89.3 Prinja, Mazumder and others (2013) also estimate the incremental costs (including increased time commitments of ASHA workers and additional monitoring time) of expanding coverage of the IMCI program. We assumed that similar costs would be incurred to expand the intervention beyond the current network of ASHA workers. These additional costs of US$0.65 per newborn (including the cost of enlarging the ASHA network), result in a total cost of US$6.54 (2013 dollars) per neonate under this scenario.
Finally, we assumed the demand for newborn intensive treatment to be 75 percent, which means that the parents or guardians of 75 percent of neonates suffering from severe morbidity seek intensive care, if available, with an OOP treatment expenditure of US$108.97 (Prinja, Manchanda, and others 2013). As with other parameters, we considered a wide range of additional demand and cost scenarios in our sensitivity analysis.
Methods
Our analysis was conducted on an annual cohort of 10.48 million Indian newborns as of 2013. This cohort size was estimated in two steps. First, based on India’s birth rate of 20.438 per 1,000 and the total rural population of 852 million (World Bank, World Development Indicators),4 we estimated 17.40 million new births in rural India per year. We subtracted the 39.8 percent of rural newborns receiving some form of home- or facility-based care during the first 10 days of life (IIPS 2010) from this birth cohort to obtain the resultant cohort of 10.48 million neonates who do not receive any care each year.
We estimated the incident cases and deaths averted from severe newborn morbidity by the HBNC package under each of the two intervention scenarios, compared with the baseline. Our analysis is similar to the well-known Lives Saved Tool (LiST)—a powerful tool developed to model the impact on children of scaling up health interventions (Steinglass and others 2011). However, our estimates differ from its projections because the LiST is based on the effectiveness of interventions gathered from scientific evidence that is not restricted to a specific country. The ECEA method enables us to estimate the impacts of interventions based on the efficacy literature available for the target country. In addition to health outcomes, we estimated economic benefits of the HBNC including incremental OOP expenditures averted and the money-metric value of insurance provided. For simplicity, we only considered OOP expenditures related to treatment expenditure for newborn morbidity. Higher levels of access to HBNC are likely to lower the incidence of morbidity, reducing the need for treatment and associated expenditure.
The money-metric value of insurance is a metric that measures the financial protection provided by the HBNC package. It estimates the risk premium, that is, the amount of money an individual is willing to pay to avoid an ailment. To calculate the value of insurance, we started with a mean per capita gross domestic product (GDP) in India of US$1,489 (in 2013 U.S. dollars) (World Bank World Development Indicators).
We used a constant relative risk aversion utility function of the form  with a coefficient of relative risk aversion of ρ = 3 (McClellan and Skinner 2006). The probability of receiving treatment for a disease is denoted by r(y), a function of income. Therefore, the expected value of income will be as follows:
in which c denotes the OOP cost of treatment. The certainty equivalent of this expected income, denoted by y* is as follows:
The money-metric value of insurance denoted by v is as follows:
Results
reports the health and financial consequences of the HBNC package based on the disease and intervention parameters listed in . For our study cohort of neonates, we found that if the current network of ASHA workers were utilized with a coverage rate of 54 percent of the population, the corresponding reduction in incidence of morbidity and deaths would be 805,000 (95 percent uncertainty range 477,000 to 1,218,000) and 89,000 (95 percent uncertainty range 44,200 to 149,100), respectively, compared with the baseline. Extending the coverage of the care package in scenario 2 could avert a total of 1.25 million cases (95 percent uncertainty range 750,000 to 1,950,000) of newborn morbidity and 138,000 deaths (95 percent uncertainty range 76,400 to 244,100) compared with the baseline (). Even at a more conservative efficacy rate of 34 percent on mortality based on Baqui and others (2008), we found that the package averts 55,900 deaths (95 percent uncertainty range 34,700 to 85,100) when scaled up to the present ASHA coverage level, and 86,800 deaths (95 percent uncertainty range 49,000 to 130,000) when scaled up in scenario 2.
Estimates of the Impact of Home-Based Neonatal Care through Community Health Workers.
Estimated Impact of Home-Based Neonatal Care Package on the Incidence of Morbidity and Mortality.
The financial benefits of the estimated health reductions are significantly large as well. At US$108.97 for newborn intensive care (Prinja, Manchanda, and others 2013), the OOP expenditures averted by the care package amount to US$66 million (95 percent uncertainty range $35 million to $106 million) at the existing ASHA coverage, and US$102 million (95 percent uncertainty range $51 million to $182 million) under intervention scenario 2. At a relative risk averseness coefficient of 3 and income per capita of US$1,489, we estimate that the financial risk protection (value of insurance) afforded by the HBNC package amounts to US$474 (95 percent uncertainty range $222 to $885) per 1,000 births in the cohort within existing ASHA coverage levels, and US$826 (95 percent uncertainty range $351 to $1,626) per 1,000 births when scaled up further in the second intervention scenario.
The financial burden of the newborn care package on the government would amount to US$33 million (95 percent uncertainty range $24 million to $42 million) when the package is rolled out within the present ASHA network, and US$53 million (95 percent uncertainty range $41 million to $66 million) when extended to 83 percent of the population in scenario 2. To put this figure in context, the government allocated US$386.1 million (23.2 billion Indian rupees, assuming US$1 = 60 Indian rupees) for all child health-related programs in fiscal year 2013/14 (CBGA 2013).
The value of this package measured by costs per death averted indicates that it is cost saving under both scenarios (if we include the OOP expenditure averted). Otherwise, if we only consider programmatic costs and ignore OOP costs averted, the first intervention scenario extending the package to current ASHA worker levels costs US$373 per death averted from the baseline; the second scenario costs US$387 per death averted from the baseline. These costs suggest that these interventions are “very cost-effective” by the cost-effectiveness threshold of the WHO (WHO 2003).
Discussion and Conclusion
We assessed the health and financial benefits of expanding access to an HBNC package. Although the health benefits may be of primary importance, the direct and indirect costs of newborn care are also significant (Asian Development Bank 2012). Newborn morbidity poses a significant economic risk for households, and evaluating the financial risk protection benefits of the HBNC package is important.
Incorporating this aspect of financial risk protection and OOP expenditures averted favorably differentiates the ECEA method from other priority-setting tools.5 For the purpose of this analysis, we assumed that the government bears the full cost of the intervention and expands coverage to either 54 percent or 83 percent of the population that does not have access to care. The total cost to the government under these two intervention scenarios would be $33 million (up to $42 million) and $53 million (up to $66 million), respectively. The HBNC is a new program and the details of its budget allocations are not yet publicly available. However, we can compare the estimated financial requirements of the HBNC with other large-scale maternal and child health programs in India. The Janani Suraksha Yojana6 (Safe Motherhood Scheme) is one such program. It provides cash incentives to pregnant women for delivering their babies at health facilities (instead of home births). Implemented across the country beginning in 2005, it has led to some modest improvements in newborn and perinatal death rates (Lim and others 2010). However, in comparison with the estimated cost of HBNC, Janani Suraksha Yojana has a much larger budget of more than $300 million per year (Ministry of Health and Family Welfare 2012).
The two intervention scenarios in our analysis reflect some of the options available to the government. The policies can be adapted as needed, for example, by setting a lower threshold for coverage or by paying a percentage of the cost of the intervention. At the given rates of intervention efficacy, this adaptability would help strike a balance between the potential benefits and financial viability for the government.
The health and financial outcome estimates in this analysis illustrate the potential benefits under an ideal policy implementation scenario. The effectiveness of policy depends on more than access to ASHAs. On the demand side, it is essential to change the care-seeking practices and behaviors of mothers. Only 17 percent of pregnant women in rural Uttar Pradesh received at least one antenatal checkup during their entire period of pregnancy (Baqui and others 2007). Furthermore, only 5 percent of women were informed about thermal care and breastfeeding. These alarming statistics highlight the need to improve health education for mothers and increase incentives to seek proper care through programs like Janani Suraksha Yojana.
In addition to improving the demand for care and changing the practices of mothers, it is important to focus on improving health care delivery channels. The quality of training provided to ASHAs, motivation levels, and remuneration of workers are factors that contribute to the effectiveness of the intervention and influence its uptake among the population (Bang and others 1999). The challenges of delivery were highlighted by a recent situational analysis of the new HBNC program in Uttar Pradesh. The assessment found that ASHAs failed to identify critical signs and did not follow program guidelines. Furthermore, they were misclassifying sickness categories of a staggering 80 percent of newborn children (Das and others 2014).
Based on available evidence on the efficacy of the interventions, our results indicate that expanding the HBNC package within the current network of ASHA workers to 54 percent and further expanding it to 83 percent would significantly prevent newborn morbidity, extend the lives of neonates, and yield significant financial risk protection. Considering that newborn mortality constitutes 71 percent of infant mortality and 56 percent of mortality under age five years in India (UN IGME 2014), the HBNC has tremendous potential to lower NMR in India. Recognizing this potential and its ability to overcome the demand-side barriers to accessing postnatal care at health facilities, HBNC was recommended as the primary strategy for combating NMR by the Eleventh Five-Year Plan of India (2007–12) (Planning Commission of India 2008).
Furthermore, expanding coverage of the HBNC is in complete alignment with the objectives of continuum of care as outlined in India’s Newborn Action Plan (2014)— which aims to reduce preventable newborn deaths and stillbirths. It is also in harmony with the future goals of universal health coverage in India. The 2010 World Health Report (WHO 2010) outlines the need for public financing of health interventions in the developing world to reduce OOP private medical expenditure and protect vulnerable populations from catastrophic health shocks in an equitable way. The report also highlights the need to ensure that interventions are prepaid (through some form of progressive taxation), to enable the poor and the sick to benefit from the implicit subsidy provided to them by rich and healthy population groups through such a mechanism. The Indian Planning Commission’s report on universal health coverage has also emphasized such public financing (High Level Expert Group on Universal Health Coverage 2011).
The following factors circumscribe the conclusions of our study. Because data on HBNC are limited, we have relied on a research study conducted in 1996 for newborn morbidity and efficacy of interventions in a district of India. Although this study is dated and localized, we overcame the uncertainty in these estimates by conducting a rigorous sensitivity analysis. The estimates of this model would be enriched by the availability of geographic or economic segmentation in the data on incidence and mortality to provide an understanding of the distributional consequences of the intervention. As a result of the absence of such data, we were unable to estimate the equity impacts of the HBNC intervention and account for any spatial or economic heterogeneity, such as costs or income, in our results. Furthermore, differences in quality of interventions or factors that could affect behavioral responses to the intervention were not included. A more dynamic model could capture these heterogeneities.
Despite these limitations, our analysis takes an important step toward highlighting the overall magnitude of health and economic benefits provided by the HBNC for the welfare of India’s newborn population. Further research on the role of community worker training and supervision, the health system in which they operate, and community mobilization would lead to a broader understanding about the impacts of home- and community-based interventions in improving newborn survival in a variety of conditions.
References
Asian Development Bank. 2012. Impact of Maternal and Child Health Private Expenditure on Poverty and Inequity.
Manila:
Asian Development Bank.
Bang A T, Bang R A, Baitule S B, Reddy M H, Deshmukh M D. 1999. “
Effect of Home-Based Neonatal Care and Management of Sepsis on Neonatal Mortality: Field Trial in Rural India.”
The Lancet
354 (9194): 1955–61. [
PubMed: 10622298]
Bang A T, Bang R A, Baitule S, Deshmukh M, Reddy M H. 2001. “
Burden of Morbidities and the Unmet Need for Health Care in Rural Neonates—A Prospective Observational Study in Gadchiroli, India.”
Indian Pediatrics
38: 952–65. [
PubMed: 11568371]
Bang A T, Bang R A, Reddy M H, Deshmukh M, Baitule S. 2005. “
Reduced Incidence of Neonatal Morbidities: Effect of Home-Based Neonatal Care in Rural Gadchiroli, India.”
Journal of Perinatology
25 (Suppl 1): S51–61. [
PubMed: 15791279]
Baqui A H, El-Arifeen S, Darmstadt G L, Ahmed S, Williams E K., and others. 2008. “
Effect of Community-Based Newborn-Care Intervention Package Implemented through Two Service-Delivery Strategies in Sylhet District, Bangladesh: A Cluster-Randomised Controlled Trial.”
The Lancet
371 (9628): 1936–44. [
PubMed: 18539225]
Baqui A H, Williams E K, Darmstadt G L, Kumar V, Kiran T U., and others. 2007. “
Newborn Care in Rural Uttar Pradesh.”
Indian Journal of Pediatrics
74 (3): 241–47. [
PubMed: 17401262]
Bassani D G, Kumar R, Awasthi S, Morris S K, Paul V K., and others. 2010. “
Causes of Neonatal and Child Mortality in India: A Nationally Representative Mortality Survey.”
The Lancet
376 (9755): 1853–60. [
PMC free article: PMC3042727] [
PubMed: 21075444]
Bhutta Z A, Memon Z A, Soofi S, Salat M S, Cousens S, Martines J. 2008. “
Implementing Community-Based Perinatal Care: Results from a Pilot Study in Rural Pakistan.”
Bulletin of the World Health Organization
86 (6): 452–59. [
PMC free article: PMC2647462] [
PubMed: 18568274]
Bonu S, Bhushan I, Rani M, Anderson I. 2009. “
Incidence and Correlates of ‘Catastrophic’ Maternal Health Care Expenditure in India.”
Health Policy and Planning
24 (6): 445–56. [
PubMed: 19687135]
Borghi J, Hanson K, Acquah C A, Ekanmian G, Filippi V., and others. 2003. “
Costs of Near-Miss Obstetric Complications for Women and Their Families in Benin and Ghana.”
Health Policy and Planning
18 (4): 383–90. [
PubMed: 14654514]
Brouwer W B, Koopmanschap M A. 2000. “
On the Economic Foundations of CEA. Ladies and Gentlemen, Take Your Positions!”
Journal of Health Economics
19 (4): 439–59. [
PubMed: 11010234]
CBGA (Centre for Budget and Governance Accountability). 2013. How Has the Dice Rolled? Response to Union Budget 2013–14.
New Delhi:
Centre for Budget and Governance Accountability.
Chand R, Das B, Awasthi D P, Bisht R. 2013. Heath and Family Welfare Statistics in India 2013.
New Delhi:
Ministry of Health and Family Welfare, Government of India.
Das E, Panwar D S, Fischer E A, Bora G, Carlough M C. 2014. “
Performance of Accredited Social Health Activists to Provide Home-Based Newborn Care: A Situational Analysis.”
Indian Pediatrics
51 (November
2012): 142–44. [
PubMed: 24632696]
Dillon A. 2012. “Child Labour and Schooling Responses to Production and Health Shocks in Northern Mali.” Journal of African Economies
22 (2): 276–99.
Garber A M, Phelps C E. 1997. “
Economic Foundations of Cost-Effectiveness Analysis.”
Journal of Health Economics
16 (1): 1–31. [
PubMed: 10167341]
Gertler P, Gruber J. 2002. “
Insuring Consumption against Illness.”
American Economic Review
92 (1): 51–76. [
PubMed: 29058389]
Gogia S, Ramji S, Gupta P, Gera T, Shah D., and others. 2011. “
Community Based Newborn Care: A Systematic Review and Meta-Analysis of Evidence: UNICEF-PHFI Series on Newborn and Child Health, India.”
Indian Pediatrics
48 (7): 537–46. [
PubMed: 21813923]
High Level Expert Group on Universal Health Coverage. 2011. High Level Expert Group Report on Universal Health Coverage for India.
New Delhi:
Public Health Foundation of India.
Hollowell J, Kurinczuk J J, Oakley L, Brocklehurst P, Gray R. 2009. A Systematic Review of the Effectiveness of Antenatal Care Programmes to Reduce Infant Mortality and Its Major Causes in Socially Disadvantaged and Vulnerable Women, Final Report.
Oxford:
National Perinatal Epidemiology Unit.
IIPS (International Institute of Population Sciences).
2010. DLHS-3 District Level Household and Facility Survey, 2007–2008.
IIPS, Mumbai, India:
IIPS.
Jamison D T, Breman J G, Measham A R, Alleyne G, Claeson M., and others, eds. 2006.
Disease Control Priorities in Developing Countries. 2nd ed.
Washington, DC:
Oxford University Press and World Bank. [
PubMed: 21250309]
Kruk M E, Goldmann E, Galea S. 2009. “
Borrowing and Selling to Pay for Health Care in Low- and Middle-Income Countries.”
Health Affairs
28 (4): 1056–66. [
PubMed: 19597204]
Kumar V, Mohanty S, Kumar A, Misra R P, Santosham M., and others. 2008. “
Effect of Community-Based Behaviour Change Management on Neonatal Mortality in Shivgarh, Uttar Pradesh, India: A Cluster-Randomised Controlled Trial.”
Lancet
372 (9644): 1151–62. [
PubMed: 18926277]
Lim S S, Dandona L, Hoisington J A, James S L, Hogan M C., and others. 2010. “
India’s Janani Suraksha Yojana, a Conditional Cash Transfer Programme to Increase Births in Health Facilities: An Impact Evaluation.”
The Lancet
375 (9730): 2009–23. [
PubMed: 20569841]
Mavalankar D V, Vora K S. 2008. “The Changing Role of Auxiliary Nurse Midwife (ANM) in India: Implications for Maternal and Child Health (MCH).” Working Papers, Indian Institute of Management Ahmedabad, Ahmedabad, India.
McClellan M, Skinner J. 2006. “The Incidence of Medicare.” Journal of Public Economics
90 (1–2): 257–76.
Ministry of Health and Family Welfare.
2011. Home-Based Newborn Care Operational Guidelines.
New Delhi:
Ministry of Health and Family Welfare.
McClellan M, Skinner J. 2012. Annual Report 2011–12: Ministry of Health and Family Welfare.
New Delhi:
Ministry of Health and Family Welfare.
O’Donnell O, van Doorslaer E R, Rannan-Eliya R P, Somanathan A, Adhikari S R., and others. 2008. “
Who Pays for Health Care in Asia?”
Journal of Health Economics
27 (2): 460–75. [
PubMed: 18179832]
Perry H, Zulliger R. 2012. How Effective Are Community Health Workers?
Baltimore, MD:
Johns Hopkins Bloomberg School of Public Health.
Prinja S, Manchanda N, Mohan P, Gupta G, Sethy G., and others. 2013. “
Cost of Neonatal Intensive Care Delivered through District Level Public Hospitals in India.”
Indian Pediatrics
50 (9): 839–46. [
PubMed: 23502671]
Prinja S, Mazumder S, Taneja S, Bahuguna P, Bhandari N., and others. 2013. “
Cost of Delivering Child Health Care through Community Level Health Workers: How Much Extra Does IMNCI Program Cost?”
Journal of Tropical Pediatrics
59 (6): 489–95. [
PubMed: 23872793]
Sharma R, Webster P, Bhattacharyya S. 2014. “
Factors Affecting the Performance of Community Health Workers in India: A Multi-Stakeholder Perspective.”
Global Health Action
7: 1–8. [
PMC free article: PMC4197397] [
PubMed: 25319596]
Shashidhar R. 2012. “India’s Integrated Child Development Scheme and Its Implementation: Performance of Anganwadis and Analysis.” OIDA International Journal of Sustainable Development
5 (6): 29–38.
Steinglass R, Cherian T, Vandelaer J, Klemm R D, Sequeira J. 2011. “
Development and Use of the Lives Saved Tool (LiST): A Model to Estimate the Impact of Scaling Up Proven Interventions on Maternal, Neonatal and Child Mortality.”
International Journal of Epidemiology
40 (2): 519–20. [
PMC free article: PMC3066427] [
PubMed: 21036879]
Sun A, Yao Y. 2010. “Health Shocks and Children’s School Attainments in Rural China.” Economics of Education Review
29 (3): 375–82.
UN IGME (UN Inter-Agency Group for Child Mortality Estimation).
2014. Levels and Trends in Child Mortality: Report 2014: Estimates Developed by the UN Inter-Agency Group for Child Mortality Estimation (IGME).
New York:
United Nations Children’s Fund; World Health Organization; The World Bank; United Nations, Department of Economic and Social Affairs, Population Division; United Nations Economic Commission for Latin America and the Caribbean, Population Division.
UN IGME (UN Inter-Agency Group for Child Mortality Estimation).
2015. Levels and Trends in Child Mortality: Report 2015: Estimates Developed by the UN Inter-Agency Group for Child Mortality Estimation (IGME).
New York:
United Nations Children’s Fund; World Health Organization; The World Bank; United Nations, Department of Economic and Social Affairs, Population Division; United Nations Economic Commission for Latin America and the Caribbean, Population Division.
van Doorslaer E, O’Donnell O, Rannan-Eliya R P, Somanathan A, Adhikari S R., and others. 2006. “
Effect of Payments for Health Care on Poverty Estimates in 11 Countries in Asia: An Analysis of Household Survey Data.”
The Lancet
368 (9544): 1357–64. [
PubMed: 17046468]
van Doorslaer E, O’Donnell O, Rannan-Eliya R P, Somanathan A, Adhikari S R., and others. 2007. “
Catastrophic Payments for Health Care in Asia.”
Health Economics
16 (11): 1159–84. [
PubMed: 17311356]
Verguet S, Murphy S, Anderson B, Johansson K A, Glass R., and others. 2013. “
Public Finance of Rotavirus Vaccination in India and Ethiopia: An Extended Cost-Effectiveness Analysis.”
Vaccine
31 (42): 4902–10. [
PubMed: 23871824]
Verguet S, Laxminarayan R, Jamison D T. 2014. “
Universal Public Finance of Tuberculosis Treatment in India: An Extended Cost-Effectiveness Analysis.”
Health Economics
24 (3): 318–32. [
PubMed: 24497185]
Wagstaff A. 2007. “
The Economic Consequences of Health Shocks: Evidence from Vietnam.”
Journal of Health Economics
26: 82–100. [
PubMed: 16905205]
Wagstaff A. 2008. “Measuring Financial Protection in Health.” Policy Research Working Paper 4554, World Bank,
Washington, DC.
WHO (World Health Organization). 2003. Making Choices in Health: WHO Guide to Cost-Effectiveness Analysis. Edited by Tan-Torres T, Edejer R, Baltussen T, Adam T, Hutubessy R, Acharya A, editors. , and others.
Geneva:
World Health Organization.
WHO (World Health Organization). 2010. The World Health Report—Health Systems Financing: The Path to Universal Coverage.
Geneva:
World Health Organization.
WHO (World Health Organization). 2012. “Newborns: Reducing Mortality [Fact Sheet].”
World Health Organization,
Geneva.
WHO/UNICEF Joint Statement. 2009.
Home Visits for the Newborn Child: A Strategy to Improve Survival.
Geneva:
World Health Organization. [
PubMed: 24809117]
- 1
By comparison, the average NMR among countries in the same economic category as India (lower-middle-income) is 20.7 per 1,000 live births.
- 2
In 1990, India’s NMR was 51.1 per 1,000 live births, which declined to 29.2 in 2013 (UN IGME 2014).
- 3
Unless otherwise specified, all cost data in our analysis are in 2013 U.S. dollars.
- 4
In 2013, 68 percent of India’s total population of 1.252 billion was rural.
- 5
In a traditional CEA framework, priority setting is based on the health benefits of an intervention, measured by the cost per DALY averted. DALYs put greater emphasis on early life by discounting future life years. Therefore, a neonatal care package will avert a very large number of DALYs and be highly cost-effective. However, when the financial benefits of an intervention are considered (as in the ECEA) in a priority-setting analysis, they may shift the policy makers’ focus away from early life to future life years. Although an HBNC will be very attractive on the basis of DALYs, other health interventions may significantly outweigh it based on economic benefits.
- 6
The Janani Suraksha Yojana is a conditional cash transfer scheme introduced in 2005 to encourage demand for institutional deliveries and provide mothers with incentives to give birth at health facilities.
World Bank Income Classifications as of July 2014 are as follows, based on estimates of gross national income (GNI) per capita for 2013:
Low-income countries (LICs) = US$1,045 or less
Middle-income countries (MICs) are subdivided:
a) lower-middle-income = US$1,046–US$4,125
b) upper-middle-income (UMICs) = US$4,126–US$12,745
High-income countries (HICs) = US$12,746 or more.