Dutch Breast Implant Registry Annual Report 2018 is licensed under a Creative Commons Attribution 4.0 International License.
In 2018, a total of 3,727 operations (3,166 unique patients) were performed for a reconstructive indication, of which 1,880 insertion only procedures (1,601 unique patients), 1,552 replacement surgeries (1,336 unique patients), and 295 explantation only procedures (229 unique patients).
Laterality (Table 4 & Figure 5)

Figure 5
Laterality of reconstructive procedures (2018). * n is the total number of procedures per year.
The majority of the reconstructive procedures were unilateral (72%). This is best explained by the vast majority of reconstructive procedures being performed after a mastectomy for breast cancer, which occurred mostly unilaterally (80%). When looking at table 4 in more detail, it is clear that the other indications were more often performed bilaterally.
Table 4
Laterality of reconstructive procedures (2018).
Age (Figure 6)

Figure 6
Distribution of patient age at time of reconstructive surgery (2018).
The mean age of patients undergoing an insertion only procedure was 50 years (SD 12), the mean age of patients undergoing a replacement procedure was 52 years (SD 12), and the mean age of patients undergoing an explantation only procedure was 54 years (SD 11).
Smoking (Table 5)
Table 5
Percentage of patients smoking at time of reconstructive surgery (2018).
The percentage of smokers at the time of reconstructive surgery was between 10% and 16%. In 13% to 18% of the cases, the variable “Smoking” was not registered. The reasons for these missing values are unclear, but they are higher compared to other variables.
Body Mass Index (BMI) (Figure 7)

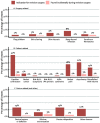
Figure 7
Patient BMI at time of reconstructive surgery (2018).
For insertion only, replacement, and explantation only procedures, most of the patients had a BMI between 18.5 and 24.9 (54%, 53%, and 41%, respectively) or 25.0 – 29.9 (27%, 28%, and 36%, respectively), followed by a BMI >30 (11%, 11%, and 15%, respectively), and <18.5 (2%, 2%, and 1%, respectively). In respectively 5%, 6%, and 7% of the records BMI was missing.
Intraoperative techniques (Table 6)
Table 6
Intraoperative techniques in reconstructive procedures, per breast (2018).
To improve the quality of care of breast implant surgery in the Netherlands, DBIR provides benchmark information on several topics, among which the use of infection control measures (ICM’s) and technical operation details. For some techniques and ICM’s, there is scientific evidence it has a positive effect on surgical outcomes, such as the preoperative use of prophylactic systemic antibiotics. For other techniques, however, no consensus has been reached yet. Therefore, DBIR aims to identify best practices by collecting nationwide, patient-based data and surgical outcomes.
The number of records with missing information on the intraoperative techniques was low (±3%), except for the manufacturer (brand) of each ADM/Mesh, which only was registered in 75% of the cases in which an ADM/Mesh was used (Table 2).
Infection control measures (Figure 8)
Most of these variables were only registered for the insertion of an implant. Therefore, only the insertion only and replacement procedures are included in figure 8. Results are presented per breast. The use of infection control measures (ICM’s) slightly increased over the years (2015–2018). However, the percentage of records with information on the use of ICM’s also increased over the years from ±93% in 2016 to ±99% in 2018 (Table 2). This has to be kept in mind when interpreting these results. The most frequently used ICM’s for reconstructive indications in 2018, were the use of preoperative systemic antibiotics, glove change before implant insertion, and antiseptic and/or antibiotic rinse of the implant. Since 2015, the use of these three ICM’s has increased from 93% to 97%, from 79% to 92%, and from 76% to 80%, respectively.
Postoperative systemic antibiotics were provided in ±47% of the procedures between 2015 and 2018. Nipple guards were administered more frequently over the years, increasing from 10% to 25%. A sleeve/Keller funnel was used in less than 10% of the procedures.
Revision surgery (Figure 9)
Indications for revision surgery were categorized as unplanned or planned. The numbers presented in Figure 9 are composed of new implants as well as breast implants inserted (and/or explanted) prior to and after the start of the registry. The increasing trend of more replacement and explantation procedures being registered in DBIR that was seen in the previous annual report, was continued in 2018.

Figure 9
Distribution of registered reconstructive procedures per year, per breast (2016 – 2018). * TE: tissue expander. * 2015 was not a full registration year and is therefore not included in the trend line.
Percentage of revisions (Figure 10)
The cumulative percentage of revisions was calculated per device type. These analyses included all devices of which the insertion surgery was registered in DBIR since the start in April 2015. All indications for revision were included, except a replacement of a tissue expander for a permanent breast implant. These procedures were censored. Additionally, only devices with a correct manufacturer and serial number registered at insertion surgery could be traced over time and could, therefore, be included in the calculations. For these analyses, revision was defined as reinsertion of a new device, reinsertion of the same device, replacement with autologous tissue, or explantation without replacement with any device or autologous tissue. The presented cumulative percentages were not adjusted for confounding factors.
Of the 7,305 inserted permanent breast implants which could be traced over time since April 2015, 3% had been revised after 6 months, 4% after 12 months, and 6% after 24 months. Of the 5,613 inserted tissue expanders which could be traced over time since April 2015, 2% had been revised (unplanned) after 6 months, 3% after 12 months, and 4% after 24 months.
Indications for revision surgery & Incidental findings (Figure 11 – next page)

Figure 11
Indications for replacement or explantation after reconstructive surgery, per breast (2018). * Multiple indications could be reported per revision procedure. * This figure includes devices that were inserted before and after the start of the DBIR.
Of the women with an unplanned replacement or explantation procedure, the indication for revision was stated in 85% of the records. Of these, most revisions were performed due to patient-related indications (0%–32%), followed by device-related indications (6%–13%), and surgery-related indications (2%–8%).
An “Other” reason for revision was registered in 11% of the cases. Most of the time, this appeared to be a revision due to a planned replacement for autologous tissue. Therefore, this indication was added as a separate option in the next DBIR update, to be able to better distinguish between the indications for revision.
All reported issues could also have been found incidentally during a revision procedure, not being the primary indication for revision. Nevertheless, these incidentally found issues were hardly reported. It is not known, however, whether they were less often encountered or that surgeons less frequently registered these issues.
Device characteristics (Table 7 & Figure 12)
Table 7
Characteristics of inserted devices for reconstructive indications, per year (2015–2018).

Figure 12
Number of inserted devices for reconstructive indications per manufacturer, per year (2015–2018).
The majority of devices inserted for reconstructive indications were permanent breast implants. Most of the permanent breast implants were anatomically shaped, textured, silicone coated, and silicone filled. The mean volume was between 420cc and 430cc. The inserted tissue expanders were predominantly anatomically shaped, textured, silicone coated, and filled with saline. The mean maximum volume of the tissue expanders was between 470cc and 480cc, and the mean intraoperative filling volume was between 118cc and 132cc.
- Laterality (Table 4 & Figure 5)
- Age (Figure 6)
- Smoking (Table 5)
- Body Mass Index (BMI) (Figure 7)
- Intraoperative techniques (Table 6)
- Infection control measures (Figure 8)
- Revision surgery (Figure 9)
- Percentage of revisions (Figure 10)
- Indications for revision surgery & Incidental findings (Figure 11 – next page)
- Device characteristics (Table 7 & Figure 12)
- RECONSTRUCTIVE INDICATIONS - Dutch Breast Implant Registry (DBIR) Annual Report ...RECONSTRUCTIVE INDICATIONS - Dutch Breast Implant Registry (DBIR) Annual Report 2018
- RecName: Full=Leucine-rich repeat and calponin homology domain-containing protei...RecName: Full=Leucine-rich repeat and calponin homology domain-containing protein 4gi|49036090|sp|Q921G6.1|LRCH4_MOUSEProtein
Your browsing activity is empty.
Activity recording is turned off.
See more...


