

NCBI Bookshelf. A service of the National Library of Medicine, National Institutes of Health.
Kiel JW. The Ocular Circulation. San Rafael (CA): Morgan & Claypool Life Sciences; 2010.
The “local control” mechanisms operating in the ocular circulations are difficult to define. Based on more accessible circulations in other tissues, probable local control mechanisms in the eye include vascular responses linked to nearby tissue metabolism (e.g., reactive hyperemia, functional hyperemia and autoregulation), transmural pressure (e.g., myogenic response, reactive hyperemia and autoregulation), shear stress (flow-dependent vasodilation) and intercellular conduction. The relative roles of these mechanisms are difficult to define because the eye’s complex vascular organization makes discrete perturbations that elicit unambiguous responses characteristic of a particular mechanism in a single vascular bed hard to achieve. Eliminating confounding neurohumoral inputs is an additional challenge. Consequently, it is often possible to infer that a response in an ocular circulation is locally mediated, but the relative contributions of the underlying local control mechanisms are ill defined. Notwithstanding these caveats, there is evidence of local control in the prelaminar optic nerve, choroid retina, ciliary body and iris.
6.1. Types of local control
Be definition, local control of blood flow refers to mechanisms intrinsic to the blood vessels and nearby parenchymal cells. These mechanisms include myogenic local control, metabolic local control, flow-mediated vasodilation and flow control by intercellular conduction.
6.2. Myogenic local control
“The muscular coat of the arteries reacts, like smooth muscle in other situations, to a stretching force by contraction. It also reacts to a diminution of tension by relaxation, shown, of course, only when in a state of tone. These reactions are independent of the central nervous system, and are of a myogenic nature.” “The peripheral powers of reaction possessed by the arteries is of such a nature as to provide as far as possible for the maintenance of a constant flow of blood through the tissues supplied by them, whatever may be the height of the general blood-pressure, except in so far as they are directly overruled by impulses from the central nervous system.” Baylis, 190229.
As Baylis observed over a century ago, vascular smooth muscle contracts in response to stretch and relaxes when imposed stretch is released, and this intrinsic behavior tends to promote constant blood flow despite changing arterial pressure. The myogenic mechanism, or myogenic response, occurs in vessels from diverse tissues and organs, including the eye (Fig 6.1). In vitro experiments indicate that the myogenic response requires extracellular calcium, but it does not require an intact endothelium (Fig 6.2). The myogenic response is also fast, occurring within seconds to minutes (Fig 6.3).
Figure 6.1
In vitro cannulated human retinal arteriole. (A) The vessel was allowed to develop resting basal tone (35 μm internal diameter) at 55 cm H2O intraluminal pressure. (B) Maximum diameter (55 μm internal diameter) of the vessel was established (more...)
Figure 6.2
Vessel diameter responses to increasing intraluminal pressure. Left: hamster cheek pouch arterioles fail to constrict in response to increasing intraluminal pressure without extracellular calcium. Right: rat cremaster muscle arterioles constrict in response (more...)
Figure 6.3
Speed of myogenic response. (A) Rapid afferent arteriole contractile responses of in vitro perfused hydronephrotic rat kidney preparation to a 1 sec arterial pressure spike and (B) to 20 sec sustained or pulsatile step-increases in arterial pressure. (more...)
In many organs and tissues, blood flow is relatively stable over a range of arterial pressure in the absence of any neurohumoral input – a flow behavior known as autoregulation. As noted by Baylis, the myogenic mechanism has the potential to help maintain blood flow if arterial pressure changes, and there is considerable evidence supporting a myogenic role in autoregulation35. However, the myogenic mechanism responds to stretch, or more specifically vascular wall tension, and consequently, it can also exacerbate the flow response to a pressure change in some situations. For example, if venous pressure increases, the pressures upstream also increase and elicit an arterial myogenic response so that the fall in blood flow due to the decreased perfusion pressure is worsened by the myogenic vasoconstriction36. Figure 6.4 shows an example of myogenic non-autoregulatory behavior in a rat cremaster arteriole using the pressurized box preparation37. In this preparation, the animal is placed inside an airtight box and the cremaster muscle is exteriorized for viewing on an inverted microscope stage. When the box pressure is raised, there is an equal increase in arterial and venous pressures, so that the transmural pressure increases without altering the perfusion pressure gradient. This causes a robust myogenic response and fall in blood flow.
Figure 6.4
Myogenic response to increased transmural pressure at constant perfusion pressure in rat cremaster arteriole. Reproduced with permission from Circulation Research, Wolters Kluwer Health.
As Figure 6.4 demonstrates, the myogenic mechanism is dynamic, but it does not deliberately maintain constant blood flow. For the specific case of changing arterial pressure, Johnson proposed that myogenic autoregulation can occur when arterial smooth muscle incorporates a sensor responsive to changing wall tension coupled in series with the contractile elements and moderate feedback gain (Fig 6.5)35,38. This regulatory loop would permit the vessel radius adjustments necessary to maintain flow when pressure changes (e.g., if arterial pressure increases, the arterial contraction must decrease the radius below control to maintain blood flow constant). Johnson observed that in terms of homeostasis, the myogenic mechanism is better suited to regulating capillary hydrostatic pressure than blood flow (e.g., if arterial or venous pressure rise, the arterial myogenic vasoconstriction would act to preserve capillary hydrostatic pressure).
Figure 6.5
Model of myogenic autoregulation. Model assumes that resistance vessels have a sensor in series with the contractile element that responds to changes in wall tension as defined by the Law of LaPlace (tension equals the transmural pressure times the radius, (more...)
6.3. Metabolic local control
The basic assumption of metabolic local control is that tissues regulate their blood flow to maintain nutrient delivery and waste removal consistent with metabolic demand (Fig 6.6)39. The underlying assumption is that communication occurs between parenchymal cells and the smooth muscle cells controlling the vascular resistance (arterioles) and capillary flow distribution (pre-capillary sphincters and pericytes)40,41. Because most tissues use aerobic metabolism, the oxygen delivery by blood flow to the tissue is often considered the regulated variable. If oxygen delivery decreases (e.g., due to a fall in arterial pressure) or oxygen demand increases (e.g., increased neuronal activity), the parenchymal cells produce a vasodilatory signal that increases tissue blood flow and capillary perfusion such that oxygen delivery is again matched to oxygen demand. Conversely, if oxygen delivery exceeds demand, the parenchymal cells decrease production of the vaosdilatory signal until delivery and demand are again matched. There are numerous vasodilator candidates linked to metabolism that can act as the feedback signal (e.g., adenosine, CO2, H+, lactate, etc.), and it is likely that all participate to a variable extent depending on the tissue.
Figure 6.6
Model of metabolic local control. Arterial resistance and capillary perfusion are modulated by a feedback signal linked to parenchymal metabolism and oxygen consumption (VO2). (Pa: arterial pressure; Pv: venous pressure; arrows: direction of blood flow). (more...)
Several pieces of evidence support the metabolic local control hypothesis: reactive hyperemia (Fig 6.7), functional hyperemia (Fig 6.8), modulation of pressure-flow autoregulation by metabolic stimulation (Fig 6.9), and hypoxic hyperemia (Fig 6.10).
Figure 6.7
Reactive hyperemia. Blood flow response in canine circumflex artery upon release of 15 sec (top) and 30 sec (bottom) arterial occlusions before (left) and after (right) giving a non-selective adenosine antagonist (theophylline). Extent of post-occlusion (more...)
Figure 6.8
Functional hyperemia. Blood flow (Qb) response in an isolated segment of feline ileum before, during and after filling the lumen with a glucose solution. Oxygen consumption (VO2) increased during glucose absorption. The increased VO2 was achieved by increased (more...)
Figure 6.9
Metabolic activity and autoregulation. Effect perfusion pressure on oxygen consumption and mucosal blood flow in an isolated canine stomach preparation before and during pentagastrin-stimulated acid secretion. Increased oxygen consumption paralleled by (more...)
Figure 6.10
Hypoxic vasodilation. Effect of systemic hypoxia on canine skeletal muscle blood flow in an areflexic dog preparation. Reproduced with permission from Circulation Research, Wolters Kluwer Health.
6.4. Flow-mediated vasodilation
In vitro and in vivo studies of large and small arteries indicate that increasing blood flow elicits an endothelium-dependent vasodilation (Fig 6.11)46–50. The data indicate that the response is mediated by shear stress exerted on the endothelial cells by the velocity and viscosity of blood moving within the vessel lumen (Fig 6.12). The response is inhibited by indomethacin (Fig 6.12) and nitric oxide synthase inhibitors, indicating that endothelial release of vasoactive prostaglandins and nitric oxide participate in the response51,52. The contribution of flow-mediated vasodilation in local control is complex since it has the potential to be inherently unstable (i.e., an increase in flow elicits a vasodilation that causes a further increase in flow). However, the response varies with location in the arterial tree and is likely counterbalanced by metabolic and myogenic local control.
Figure 6.11
Flow-mediated vasodilation. In vitro porcine coronary arterioles dilate in response to flow achieved by step-increases in perfusion pressure (ΔP) without changing the mid-point intraluminal pressure (A). Flow-induced dilation is endothelium-dependent (more...)
Figure 6.12
Shear stress and flow-mediated vasodilation. In vitro rat cremaster arterioles dilate in response to shear stress increased by raising flow (top) or viscosity (bottom). Shear stress response is abolished by endothelial removal (left) or indomethacin (right) (more...)
6.5. Flow control by intercellular conduction
One potential integrating mechanism for the various local control mechanisms is intercellular communication along the arterial tree53. The evidence for this mechanism is the rapid propagation of a focal vasodilation elicited by iontophoretic application of acetylcholine (Fig 6.13)54. The vasodilation spreads from one region of an artery or arteriole to another. The fact that the vasodilation spreads past an upstream occlusion indicates that flow-mediated vasodilation is not involved. The propagated vasodilation is associated with a hyperpolarization of the endothelial cells (Fig 6.14)55.
Figure 6.13
Propagated vasodilation. In hamster cheek pouch arterioles, a focal acetylcholine induced vasodilation propagates upstream past a double occlusion indicating intercellular communication along the arterial tree.
Figure 6.14
Propagated vasodilation associated with hyperpolarization of endothelial membrane potential. Reproduced with permission from American Physiological Society.
6.6. Ocular local control
The study of local control mechanisms in the ocular circulations is difficult because of the eye’s unique anatomy and the limitations of current blood flow measuring technology. Nonetheless, there are clear examples of local control phenomena in each of the ocular circulations.
6.6.1. Optic Nerve Head (ONH)
Numerous studies provide evidence of autoregulation in the prelaminar ONH in different species with blood flow measured with different techniques and perfusion pressure varied by changing IOP or blood pressure (Fig 6.15)56–59. However, the underlying mechanisms responsible for this behavior are unclear, though metabolic and myogenic mechanisms seem most likely.
Figure 6.15
Optic nerve head autoregulation observed in different species with different blood flow measuring technique and difference perfusion pressure perturbations. Reproduced with permission from Investigative Ophthalmology & Visual Science.
Several pieces of evidence indicate metabolic control in ONH autoregulation. First, the ONH has a strong functional hyperemic response during retinal illumination with a flickering light stimulus (Fig 6.16)60. The functional hyperemia is linked to metabolism since it is associated with a decrease in ONH PO2 indicative of increased oxygen consumption and increased interstitial potassium concentration consistent with increased nerve activity61. Local NO production also increases and may contribute, although the functional hyperemia persists despite nitric oxide synthase inhibition62. The response is also altered by exogenous adenosine, but it is unclear whether endogenous adenosine is involved62. Second, the pressure-flow relationship is shifted upwards during metabolic stimulation (Fig 6.17)63. Interestingly, the break-point in the pressure-flow relationship occurs at a higher perfusion pressure than in control. This may be due to fewer action potentials arriving from the retina due to insufficient retinal perfusion or the vasodilatory reserve may be exhausted sooner at the higher metabolic rate (i.e., the ONH arterioles have a maximum achievable diameter all of which is available to respond to decreased perfusion pressure under control conditions, but less is available when doubly challenged by increased metabolism and decreased perfusion pressure). Third, ONH blood flow decreases during hyperoxia and increases during hypoxia (Fig 6.18)64. Lastly, the ONH appears to undergo a reactive hyperemia following brief periods of ischemia, at least in some species (Fig 6.19)63. Reactive hyperemia seems to occur in cats, monkeys and humans65, but the experiments were not designed specifically to study reactive hyperemia (i.e., the ischemia duration was not varied systematically or done at different levels of metabolic activity). Taken together, these lines of evidence support the involvement of metabolic local control in the ONH.
Figure 6.16
ONH functional hyperemia. (Top, left) Flickering light stimulation of the retina in the anesthetized cat elicits an increase in ONH nitric oxide (NO) and ONH blood flow measured by LDF. (Top, right) Retinal flicker in the cat also increases ONH potassium (more...)
Figure 6.17
Metabolic stimulation and ONH autoregulation. The cat ONH pressure-flow relationship obtained by raising IOP during flicker (closed circles) and without (open circles) flicker. (RFonh: ONH blood flow response measured by LDF). Reproduced with permission (more...)
Figure 6.18
Cat ONH responses to hyperoxia (left) and hypoxia (right) measured by LDF (F: blood flow: Vol: index of number of moving blood cells; V: mean velocity of moving blood cells). Reproduced with permission from Experimental Eye Research, Elsevier.
Figure 6.19
Reactive hyperemia measured by LDF in the optic nerve head of cat (left) and monkey (right). Reproduced with permission from Microvascular Research, Elsevier.
There is also evidence against metabolic involvement in ONH local control, at least in the rabbit (Fig 6.20). In that species, a 10 min period of relative ischemia did not elicit a reactive hyperemic response, although there was clear evidence of autoregulation (i.e., the relative decrease in ONH velocity was much smaller than the relative decrease in perfusion pressure)68. Moreover, the speed of the autoregulatory response in the rabbit to a step-decrease in perfusion pressure was quite rapid (<5 sec), which seems fast for the accumulation of vasoactive metabolites and perhaps more in keeping with a myogenic response (though the flicker response, which is clearly metabolic, is also quite fast)69. The difference in the reactive hyperemic responses in the rabbit versus the cat and monkey may reflect species differences, but more studies designed specifically to identify the local control mechanisms responsible for ONH autoregulation are clearly needed.
Figure 6.20
Evidence against ONH metabolic local control. (Left) Rabbit ONH blood velocity (by laser speckle flowgraphy) response to decreasing ocular perfusion pressure (OPP) by raising IOP shows autoregulation but no reactive hyperemia upon restoration of OPP to (more...)
6.6.2. Choroid
The evidence regarding choroidal autoregulation has varied over the years. The advent of the microsphere technique for use in the eye70 in the early 1970’s stimulated studies of choroidal responses to changing perfusion pressure, typically by raising IOP. In some cases, the results indicated no choroidal autoregulation, as in a cat study by Alm and Bill, while another cat study by Weiter et al. showed the choroid has autoregulatory ability (Fig 6.21)71,72. In another study by Alm and Bill, the results in primates were ambiguous (Fig 6.22)73.
Figure 6.21
Early evidence against (left) and for (right) choroidal autoregulation based on binocular microsphere measurements in cats with IOP elevated in one eye. (Perfusion Pressure = MAP – IOP; Pressure = IOP). Reproduced with permission from Acta Phisiology, (more...)
Figure 6.22
Ambiguous evidence for and against choroidal autoregulation based on binocular microsphere measurements in primates with IOP elevated in one eye. Lines connect the data points for the eyes of each monkey. Threshold for autoregulation occurs at perfusion (more...)
Because they used femoral arterial pressure as an index of ophthalmic artery pressure, the authors noted “If the line connecting the values for the two eyes is extrapolated and then intercepts either the positive flow axis or the positive pressure axis below 25 cm H20 [18.4 mmHg] this suggests a vasodilation in the eye with reduced perfusion pressure.… Although some lines point towards the positive flow axis the mean result does not indicate any marked reduction in vascular resistance in response to a reduction in perfusion pressure.” Using the authors’ definition, roughly half the animals autoregulated and the other half did not (Fig 6.22). Given the lack of clear evidence of autoregulation, the authors concluded that the choroid was passive. Other studies came to a similar conclusion.
Clearer evidence of autoregulation in the choroid came later from rabbit studies using a fiber optic-based laser Doppler flowmeter (Fig 6.23)17,74,75. In those studies, the efficacy of choroidal autoregulation depended on the method used to vary the perfusion pressure, i.e., autoregulation occurred over a wider perfusion pressure range when arterial pressure was manipulated without controlling IOP than when MAP was raised at a constant IOP or IOP was raised at a constant MAP. It was also noted that the efficacy of choroidal autoregulation depended on the method of anesthesia, i.e., autoregulation occurred under pentobarbital anesthesia but was largely abolished by Nembutal, which contains 40% propylene glycol and 10% alcohol76. Methodological issues such as these and others may account for the discrepant evidence for choroidal autoregulation.
Figure 6.23
Efficacy of choroidal autoregulation in the rabbit depends on method used to manipulate perfusion pressure (left) and method of anesthesia (right). Reproduced with permission from Investigative Ophthalmology & Visual Science.
In contrast to the optic nerve and retina, the choroid is richly innervated, and so an interaction of local and neural control mechanisms is inherent in the choroidal response to changing perfusion pressure. Consequently, designating a choroidal blood flow response to changing perfusion pressure as autoregulation (i.e., due solely to local control) may not be appropriate. For that reason, some authors prefer the term “baroregulation” when all regulatory mechanisms are intact and choroidal blood flow does not change with perfusion pressure. However, in animals it is possible to minimize the neural control contribution by systemic ganglionic blockade (Fig 6.24). In rabbits, this causes a slight downward shift in the choroidal pressure-flow relationship, but choroidal blood flow still remains pressure-independent until perfusion pressure falls below approximately 40 mmHg75. This result indicates that the choroid is capable of autoregulation. However, the downward shift in the pressure-flow relation with ganglionic blockade also indicates a degree of tonic neural vasodilator tone. Some of that tone may be nitridergic, since inhibition of nitric oxide synthase (NOS) with L-NAME also causes a downward shift in the pressure-flow relationship (Fig 6.24); however, L-NAME is a non-selective NOS inhibitor and much of the downward shift is likely due to the loss of endothelial NOS vasodilatory tone. The underlying vasoconstrictor tone revealed by NOS inhibition seems to be due to endothelin, since the L-NAME induced downward shift is largely reversed by the non-selective endothelin antagonist, A-18208675,77.
Figure 6.24
Inhibition of neural control by ganglionic blockade with hexamethonium causes a modest downward shift in the pressure-flow relationship but flow remains pressure-independent over a wide pressure range, indicating the autoregulatory behavior is locally (more...)
Metabolic local control does not seem to play a role in choroidal autoregulation since the choroid does not respond markedly to retinal metabolic stimulation by flicker or to hyperoxia, though it does respond to hypocapnia (Fig 6.25)78,79. Other studies report a hyperemic response to hypercapnia71,80. The choroid also does not exhibit a reactive hyperemic response to brief (Fig 6.26) or long periods of ischemia81. Choroidal blood flow also does not increase (and may even decrease) when retinal oxygen consumption increases in the dark such that the inner photoreceptor layer becomes nearly anoxic (see below). The apparent absence of choroidal metabolic local control may be due to the high flow rate in the choroid and its anatomical organization. Metabolic local control is thought to depend on metabolic vasodilators reaching the resistance vessels. The choroid itself has little parenchymal metabolism, so the source of metabolic vasodilators would be the RPE and photoreceptors. The sheet-like choriocapillaris design is thought to optimize oxygen delivery and waste removal for the RPE and photoreceptors. If efficient, the waste removal function of the choriocapillaris would preclude vasodilators from the RPE and photoreceptors from reaching the choroidal arterioles. This is one plausible explanation for the lack of choroidal metabolic local control.
Figure 6.25
Minimal choroidal blood flow responses to retinal flickering light stimulation (left), hyperoxia (middle) or hypercapnia (right) indicate little metabolic local control. Reproduced with permission from Experimental Eye Research, Elsevier.
Figure 6.26
Lack of choroidal reactive hyperemia indicates little metabolic local control. (Author’s unpublished observations. MAP: mean arterial pressure; IOP: intraocular pressure; Flux: blood flow by LDF).
There is some evidence for choroidal myogenic local control, at least in the rabbit24,74. To explore whether a myogenic mechanism could account for choroidal autoregulatory-like behavior in the rabbit, Kiel and Shepherd74 created a mathematical model incorporating myogenic control of choroidal arterial resistance and passive (Starling resistor) control of choroidal venous resistance. The model simulated pressure-flow relationship was similar to that found in vivo, suggesting that a myogenic mechanism could account for the autoregulatory-like behavior. Moreover, the model predicted decreased choroidal blood flow in response to increased perfusion pressure in conditions conducive to heightened wall tension, and similar responses were found in vivo (Fig 6.27). Thus, it appears myogenic local control may be operative in the choroid.
Figure 6.27
Model simulations and confirmatory evidence of choroidal myogenic local control. Reproduced with permission from Investigative Ophthalmology & Visual Science.
As noted earlier, from a functional perspective, the myogenic mechanism is better suited to regulating capillary hydrostatic pressure than blood flow. If so, a myogenic mechanism in the choroid could help to stabilize blood volume during arterial pressure fluctuations and so minimize fluctuations in IOP. Consistent with this idea, the IOP normally rises a few mmHg in response to a 30–40 mmHg mechanically induced increase in arterial pressure, but if vascular control is blocked with a systemic vasodilator, the IOP response to a similar arterial pressure increase is much greater (Fig 6.28)24. This IOP protective response occurs during autonomic blockade, so it has a local mechanism. If the arterial hypertension is neurally or humorally mediated, the local mechanism may augment the choroidal vasoconstriction relative to that occurring throughout the systemic circulation82.
Figure 6.28
Protection of the eye from arterial pressure-dependent changes in IOP is a possible function of choroidal myogenic local control. (Left, top) IOP responses to acute ramp increase in MAP before and after systemic vasodilation with hydralazine. (Left, bottom) (more...)
A function proposed for the choroidal circulation that may have a local component is retinal temperature regulation. Given the small amount of metabolically active tissue (i.e., heat generating) relative to the size of the globe, the temperatures of the retina and the eye are primarily determined by the blood-borne convective heat delivery from the core and heat dissipation from the exposed ocular surface. As the largest of the ocular circulations, the choroid provides most of the convective heat delivery to the eye. In an environment cooler than core body temperature, the thermal gradient favors ocular heat loss; conversely, in a hot environment, the thermal gradient favors ocular heat gain. An additional source of heat gain is light absorption in the pigmented RPE and choroid. Given these thermodynamic parameters, it follows that eye temperature will fall if ocular blood flow is reduced in a cold environment, or rise if the environment is hot. If the temperature outside the eye is the same as core body temperature, stopping ocular blood flow will not change retinal temperature.
Parver et al. reported results from two monkeys in which raising IOP above systolic blood pressure decreased the temperature of a thermistor inside a 23 gauge needle inserted in the retina-choroid by 1° – 1.2° C83. The temperatures of the environment, the saline drip on the cornea, and the infusate used to raise IOP were not provided so the thermal gradients are unclear. Given that the retina-choroid temperatures were measured at the macula where the thermal gradient should be dominated by the temperature of the orbit, the magnitude and speed (i.e., “not less than one minute after alteration of the pressure”) of the retina-choroid temperature decreases suggest that the thermal gradient to the exposed anterior eye surface must have been quite large. In the same two monkeys, exposure of the cornea to 1.09 mW/cm2 of light caused an increase in retina-choroid temperature of ≈0.9 C when the IOP was set at 20 mmHg, which increased another ≈0.8 C when IOP was raised above systolic blood pressure.
Based on these results, the authors suggested “that the high flow choroidal circulation normally functions to stabilize the temperature environment of the retinal pigment epithelium and outer retinal layers.”83 A problem with this suggestion is that the temperature of choroidal blood is set by the core body temperature, which can vary significantly. For example, walking for 30 min in a cool environment followed by walking for 1 hr in a hot environment can raise core body temperature by 3.5 C (Fig 6.29)84. Thus, in addition to the thermal gradient mentioned earlier, the ability of the choroid to stabilize retinal temperature depends greatly on whole body thermoregulation. Moreover, the 0.9 C increase in retina-choroid temperature upon light exposure with IOP at 20 mmHg, suggests that choroidal blood flow does a poor job of stabilizing retinal temperature. Indeed, some of that increase in temperature may have been a light-induced reflex since Parver et al. found that light applied to the contralateral eye increased ipsilateral retina-choroid and scleral temperature as well as an index of choroidal blood flow; the reflex, presumably, also works when the ipsilateral eye is light exposed85. Such a reflex suggests that choroidal blood flow is not regulated to maintain retinal temperature.
Figure 6.29
Choroidal blood flow and retinal temperature. (Top) effect of light (lamp powered with 7.5V) and darkness (0.0 V) on retinal temperature as choroidal blood flow is reduced by raising IOP in two monkey eyes. (Bottom) changes in core body temperature ( (more...)
6.6.3. Retina
Evidence for autoregulation of retinal blood flow is found in various species with different blood flow measuring techniques and methods of perfusion pressure manipulation (Fig 6.30). Given its lack of autonomic innervation and high metabolic needs, autoregulation of retinal blood flow is not surprising. However, local control in the retina is complex. In many species, retinal nutrient delivery and waste removal are provided by both retinal and choroidal circulations, but some species subsist with a negligible retinal circulation (e.g., rabbits), others have none (e.g., guinea pigs), and the primate foveal region is devoid of retinal vessels despite its high density of metabolically active photoreceptors. Obviously, the link between retinal perfusion and metabolism is complicated, and varies by species and location, which makes understanding metabolic local control difficult. The negative visual consequences of retinal edema underscore the likely importance of myogenic local control, but this mechanism is difficult to study in the in vivo retina though it is evident under in vitro conditions (Fig 6.1). The contributions of flow mediated vasodilation and intercellular conduction are even harder to study and less well understood. Thus, while the evidence for retinal metabolic local control predominates, the other forms of local control may contribute as well.
Figure 6.30
Autoregulation of retinal blood flow in monkey (top left), piglet before (circles) and after (triangles) ibuprofen (top right), rabbit (bottom left) and cat before and after L-NAME. Reproduced with permission from Acta Phisiology, Wiley Blackwell.
A counterintuitive phenomenon in the retina is that oxygen consumption rises in the dark due to increased Na/K ATPase activity89,90. In species with a dual retinal blood supply (i.e., retinal and choroidal circulations), the dark stimulated increase in oxygen consumption is sufficient to lower the PO2 of the photoreceptor inner segments to near zero (Fig 6.31)91,92. There is a corresponding increase in glucose consumption in approximately the same location in the dark, and retinal blood flow is also higher in the dark93. This behavior appears to be an example of functional hyperemia, even though the metabolic activation occurs in the outer retina while the blood flow response occurs in the inner retina.
Figure 6.31
Effect of light on retinal metabolism and blood flow (data for lower right graph from Table 1). Reproduced with permission from Eye, Nature.
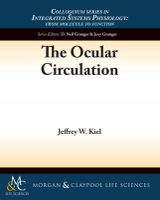
A clearer example of functional hyperemia is the retinal response to flickering light stimulation (Fig 6.32). In this case, the increase in retinal blood flow is associated with increased oxygen consumption indicated by the arteriovenous oxygen difference in paired retinal arteries and veins as well as increased glucose consumption in the inner retina93–95. Interestingly, there appears to be the greatest increase in retinal blood flow in the area with the highest density of ganglion cells, consistent with a link between metabolic demand and perfusion95. Additional evidence indicating significant retinal metabolic local control include the increase in retinal blood flow in response to hypoxia96 and hypercapnia97 as well as the decrease in blood flow in response to hyperoxia98,99 (Fig 6.33) and the reactive hyperemia after brief (Fig 6.26) and long periods of ischemia (Fig 6.34)81. Surprisingly, the retinal pressure-flow relationships under light and dark-adapted conditions have not been determined, but it seems likely that the dark-adapted curve would be shifted upwards due to the heightened oxygen consumption. Similarly, reactive hyperemic responses to brief ischemic periods would be expected to be larger in the dark.
![Figure 6.32. Retinal stimulation with flickering light increases retinal metabolism, as indicated by increased aterio-venous oxygen difference (top left) and increased inner retinal glucose uptake (bottom left), which elicits a retinal functional hyperemia (right top and bottom) (data for upper right graph from Table 1[93]).](/books/NBK53327/bin/fig6.32.gif)
Figure 6.32
Retinal stimulation with flickering light increases retinal metabolism, as indicated by increased aterio-venous oxygen difference (top left) and increased inner retinal glucose uptake (bottom left), which elicits a retinal functional hyperemia (right (more...)
Figure 6.33
Retinal blood flow responses in cats consistent with metabolic local control. Retinal blood flow decreases in response to hyperoxia (top left and right) and increases in response to hypoxia (bottom left) and hypercapnia (bottom right). Reproduced with (more...)
Figure 6.34
Retinal reactive hyperemia response after 1 hr of ischemia attenuated by adenosine receptor blockade with 8-sulfophenyltheophylline (8-SPT). Reproduced with permission from Current Eye Research, Taylor and Francis.
6.6.4. Ciliary body
While the retina has basically one function (converting light information for the central nervous system) and a dual blood supply, the ciliary body has two functions (accommodation and aqueous secretion) with a single blood supply. Differentiating ciliary muscle and secretory tissue is fairly simple by histology, but complicated in vivo, and measuring the blood flow to the two tissue types is even harder. Microsphere measurements at normal and elevated IOP indicate that ciliary muscle and ciliary processes both autoregulate, but the flow readings vary significantly, possibly because of the small number of spheres that can be trapped in such a small amount of tissue (Fig 6.35).
Figure 6.35
Evidence of autoregulation of ciliary blood flow in the cat. Reproduced with permission from Experimental Eye Research, Elsevier.
LDF measurements in the rabbit also provide evidence of ciliary autoregulation, although it is also clear that the ciliary circulation is under neural control, since ganglionic blockade caused an upward and leftward shift in the pressure-flow relationship indicating tonic neuroconstrictor tone (Fig 6.36). This is an interesting example of the interplay between neural and local control. Ciliary blood flow provides the oxygen and nutrient delivery to support aqueous production, and ciliary blood flow can decrease approximately 30% before aqueous production is compromised under control conditions. It may be this perfusion reserve that makes possible the constrained autoregulatory range seen when both neural and local control are operative. The local mechanisms involved in ciliary autoregulation have not been investigated systematically, but the author has rarely seen flow behavior suggestive of metabolic local control. For example, ciliary blood flow does not undergo a reactive hyperemic response following periods of ischemia (Fig 6.37).
Figure 6.36
Rabbit ciliary pressure-flow relationship is shifted up and to the left by ganglionic blockade with hexamethonium, but the relationship between ciliary blood flow and aqueous flow is unaffected. Reproduced with permission from Progress in Retinal and (more...)
Figure 6.37
Absence of ciliary reactive hyperemia after ischemia in rabbit suggest little metabolic local control (author’s unpublished observation).
6.6.5. Iris
There are only a few published studies of iris blood flow in animals or humans. Microsphere measurements in primates indicate the iris autoregulates, but the measurements were quite variable (Fig 6.38). Laser speckle flowgraphy measurements in pigmented rabbits suggest little iris autoregulatory ability (Fig 6.38). Human iris blood flow also does not appear to autoregulate, but oddly there is evidence of iridial reactive hyperemia101. Given the limited number of studies, definitive comments on iris local control require addition data.
Figure 6.38
Iris blood flow responses to decreasing perfusion pressure by raising IOP in the monkey (left) and rabbit (right). Reproduced with permission from Experimental Eye Research, Elsevier.
Defining local control behavior and identifying the underlying mechanisms and their interactions is challenging even in more accessible vascular beds, but it is particularly hard in the ocular circulations. Local control clearly occurs in the eye, and further study will broaden our knowledge of its role in normal ocular function and disease.
- Local control of ocular blood flow - The Ocular CirculationLocal control of ocular blood flow - The Ocular Circulation
- E3 ubiquitin-protein ligase TRIM9 isoform 6 [Mus musculus]E3 ubiquitin-protein ligase TRIM9 isoform 6 [Mus musculus]gi|556522611|ref|NP_001273317.1|Protein
Your browsing activity is empty.
Activity recording is turned off.
See more...