This section provides measures of the allocation of physicians who are in active practice to the populations living in the Middle Atlantic States’ hospital service areas. A physician in active practice is defined as one who reported that he or she spent at least 20 hours a week in patient care.
The estimates for the physician workforce per 100,000 take into account patient migration across the boundaries of hospital service areas and have been adjusted for differences in age and sex of the local populations. Part Nine of the national volume of the Dartmouth Atlas of Health Care explains how these adjustments were made.
The data, which come from the American Medical Association, the American Osteopathic Association, and the Medicare program, are for 1993. The population count is based on the 1990 United States census. The data used for the health maintenance organization benchmark is from a large staff model health maintenance organization. It has been adjusted to account for differences in age and sex according to methods described in Part Nine of the national Atlas. Additional adjustments were made to account for out-of-plan use, as described in the note to Table 4.
The Physician Workforce Active in Patient Care
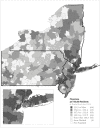
The number of physicians in active practice per hundred thousand residents varied substantially from the national average of 189, and was particularly high in many areas close to metropolitan New York. Among the region’s larger hospital service areas, the numbers of physicians were far above the national average in Manhattan (327.8); and Philadelphia (292.4). Camden, New Jersey (242.1); Pittsburgh (227.9); Trenton, New Jersey (225.4); Albany, New York (223.2); New Brunswick, New Jersey (207.3); Rochester, New York (203.7); Buffalo, New York (203.0); and Allentown, Pennsylvania (196.5) were all above the national average. Syracuse, New York (179.4); and Newark, New Jersey (156.8) were below it.
Physicians Allocated to Hospital Service Areas in the Middle Atlantic States (1993).
The number of physicians in active practice per hundred thousand residents, after adjusting for differences in age and sex of the local population, varied by a factor (more...)
Physicians per 100,000 Residents.
Specialist Physicians
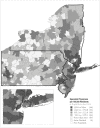
The number of specialist physicians in active practice per hundred thousand residents varied substantially among the Middle Atlantic States, with particularly high numbers in the metropolitan New York region. The numbers of specialists were almost twice as high as the national average of 122 per hundred thousand residents in Manhattan (225.0). Among the region’s larger hospital service areas, the numbers of specialists were also above the national average in Philadelphia (192.4); Camden, New Jersey (154.3); Pittsburgh (152.6); Albany, New York (150.2); and Trenton, New Jersey (143.9). New Brunswick, New Jersey (127.9); Rochester, New York (125.7); Allentown, Pennsylvania (122.7); and Syracuse, New York (119.3) were near the national average. Newark, New Jersey (96.6) was substantially below it.
Specialists Allocated to Hospital Service Areas in the Middle Atlantic States (1993).
The number of specialist physicians in active practice per hundred thousand residents, after adjusting for differences in age and sex of the local population, varied (more...)
Specialist Physicians per 100,000 Residents.
Physicians in Primary Care
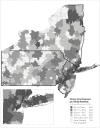
The numbers of primary care physicians in active practice per hundred thousand residents varied by almost as much as the numbers of specialists, and in much the same pattern. Among the region’s larger hospital service areas, the numbers of allocated primary care physicians in excess of the national average of 66.0 were Manhattan (100.8); Philadelphia (98.1); Camden, New Jersey (86.7), and Trenton, New Jersey (80.4). New Brunswick, New Jersey (78.3); Rochester, New York (76.8); Pittsburgh (74.0); Allentown, Pennsylvania (73.1); Albany, New York (71.6); and Buffalo, New York (66.2) were close to the national average. Newark, New Jersey (59.2); and Syracuse, New York (59.1) were below it.
Primary Care Physicians Allocated to Hospital Service Areas in the Middle Atlantic States(1993).
The number of primary care physicians in active practice per hundred thousand residents, after adjusting for differences in age and sex of the local population, (more...)
Primary Care Physicians per 100,000 Residents.
Benchmarking: The Physician Workforce Active in Patient Care
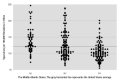
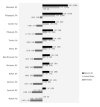
The Total Physician Workforce Allocated to Selected Hospital Service Areas in the Middle Atlantic States Compared to the Highest and Lowest Ranked Selected Areas (1993).
The figure gives the ratio of total physicians in selected hospital service areas (more...)
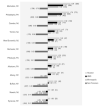
The Total Physician Workforce Allocated to Selected Hospital Service Areas in the Middle Atlantic States Compared to Selected Hospital Service Areas Elsewhere in the U.S. and to a Large HMO (1993).
The figure gives the ratio of total physicians in selected (more...)
Benchmarking: Specialists
Specialist Physicians Allocated to Selected Hospital Service Areas in the Middle Atlantic States Compared to the Highest and Lowest Ranked Selected Areas (1993).
The figure gives the ratio of specialist physicians in selected hospital service areas to (more...)
Specialist Physicians Allocated to Selected Hospital Service Areas in the Middle Atlantic States Compared to Selected Hospital Service Areas Elsewhere in the U.S. and to a Large HMO (1993).
The figure gives the ratio of specialist physicians in selected (more...)
Benchmarking: Primary Care Physicians
Primary Care Physicians Allocated to Selected Hospital Service Areas in the Middle Atlantic States Compared to the Highest and Lowest Ranked Selected Areas (1993).
The figure gives the ratio of primary care physicians in selected hospital service areas (more...)
Primary Care Physicians Allocated to Selected Hospital Service Areas in the Middle Atlantic States Compared to Selected Hospital Service Areas Elsewhere in the U.S. and to a Large HMO (1993).
The figure gives the ratio of primary care physicians in selected (more...)
Table 4
All rates are age and sex adjusted and corrected for out of area use. See Part Nine of the national volume of the Dartmouth Atlas of Health Care for details.
The count of primary physicians added to the count of specialists does not equal the count for all physicians; the difference (about 1% nationally) is attributable to the count of those in the “All Physician” category whose specialty areas were “unspecified.”
Hospital service areas with populations of 5,000 or fewer residents are omitted from the figures and maps. In the table, the data for these areas are in parentheses.
The estimates for the staffing patterns of the large health maintenance organization have been adjusted using a .10 adjustment for out-of-plan use and .04 for low Medicaid numbers; i.e., multiplied by a factor of 1.14. (Weiner JP. Forecasting the Effects of Health Reform on U.S. Physician Workforce Requirement. JAMA. 1994;272:222-239)
Physicians in Active Practice Serving Residents of Hospital Service Areas (Physicians per 100,000 population, 1993).