

NCBI Bookshelf. A service of the National Library of Medicine, National Institutes of Health.
FSRG Dietary Data Briefs [Internet]. Beltsville (MD): United States Department of Agriculture (USDA); 2010-.

Dietary guidance recommends consuming a variety of fruit and vegetables (FV) for the wide range of nutrients and bioactive components they provide1. Variety is associated with greater FV intake2. This report presents results on intake of fruit by adults 20 years and older in What We Eat in America, NHANES 2017-2018. In this analysis, fruit was discrete fruits including fresh, frozen, canned and dried fruits as reported by survey respondents, and did not include 100% fruit juices, fruit beverages, fruit in desserts or other foods.
Highlights
- ➢
On a given day, less than half of adults reported fruit, and the majority had only one fruit (28%).
- ➢
Bananas were reported most frequently, followed by apples, grapes, oranges, strawberries and mixed fruit.
- ➢
Non-Hispanic Asians and Hispanics reported fruit more frequently, whereas Non-Hispanic blacks followed by Non-Hispanic whites had fruit less frequently.
- ➢
Percentages who had fruit tended to be higher as income increased.
- ➢
At each eating occasion, fruit was reported by less than one-quarter of adults. It was most consumed at snacks followed by breakfast.
What percentage of adults report consuming discrete fruit on a given day?
Less than half of adults reported fruit on any given day. While overall more females consumed fruit than males, differences were not significant. Percentages of adults reporting fruit increased with age, particularly among females and older males. Significantly more males 60+ years reported fruit compared to males 20-39 years (P<0.001).

Figure 1
Percentage of adults who report consuming discrete fruit on a given day by gender and age, What We Eat in America, NHANES 2017-2018. a,b Percentages with different superscripts are significantly different by age, P<0.001.
How many different fruits do adults report on a given day?
Just over one-quarter of adults reported only one fruit on a given day. There were no significant differences between males and females. Two different fruits were reported by 10% of adults, and less than 5% had 3 or more.

Figure 2
Distribution of the number of different fruits reported by adults.
What fruits are reported most frequently by adults?
Bananas were reported most frequently, followed by apples, grapes, oranges, then strawberries and fruit salad, respectively. Several fruits were each reported by about 2% of adults, including cherries, raspberries, mango, grapefruit, and plums (data not shown). Blackberries, apricots, papaya, and kiwi were rarely reported (data not shown).
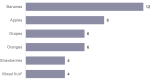
Figure 3
Percentages of adults reporting discrete fruit by kind on a given day. * Mixed fruit includes any combination of two or more fruits, such as fruit cocktail.
What is the consumption among adults of fruit by race/ethnicity?
Fruit was reported most frequently by Hispanics and Non-Hispanic Asians, and less frequently by Non-Hispanic whites and Non-Hispanic blacks. Percentages reporting different fruits reflected these patterns of consumption by race/ethnicity. Additionally, Non-Hispanic Asians and Hispanics reported mango more frequently, and more Non-Hispanic Asians reported cherries and pears (data not shown). Non-Hispanic whites also reported melons more frequently (data not shown).

Figure 4
Percentages of adults reporting discrete fruit by race/ethnicity. a,b,c,d Percentages with different superscripts are significantly different, P<0.001.
What is the consumption of fruit among adults by income level?
The frequency of consuming fruit was higher among those at the highest income level (>350% Poverty Income Ratio) compared to those at lower income levels, though differences were not significant. Of the top five reported fruits, those at higher income levels reported bananas, grapes, and strawberries more than their lower income counterparts but the difference was also not significant.
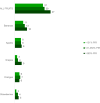
Figure 5
Percentages of adults reporting discrete fruit by income level.
What is the consumption of fruit among adults at eating occasions?
At each eating occasion, less than one-quarter of adults included fruit. It was most frequently reported at snacks followed by breakfast. More females than males included fruit at lunch (P<0.001).
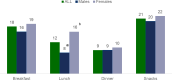
Figure 6
Percentages of adults reporting discrete fruit at eating occasions. a,b Percentages with different superscripts are significantly different, P<0.001.
What proportion of adults who report fruit on day 1 also report fruit intake on day 2?
About two-thirds of adults who had fruit on day 1 (see definitions) also consumed fruit on day 2 (see definitions). There were no differences in percentages reporting fruit on day 2 by gender or age. Of those who did not report fruit on day 1, around one-quarter had fruit on day 2 except for females and older adults. There were no significant differences by gender or age. Results were similar by race/ethnicity and income level (data not shown).
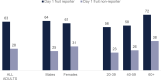
Figure 7
Percentage of day 1 discrete fruit reporters and non-reporters who consumed fruit on day 2.
Definitions
- Fruit:
Includes all discrete fruits - fresh, frozen, canned and dried forms - as defined by the What We Eat in America food categories 6002-60243; does not include 100% fruit juices, fruit beverages, or fruit in desserts such as pies.
- Day 1
Intake reported by participant on the Day 1 of dietary intake data collection, which was conducted by an in-person interview.
- Day 2
Intake reported by participants on the Day 2 of dietary intake data collections, was conducted by phone interview.
- Eating occasion
A distinct eating/drinking occurrence reported during the 24-hour dietary interview that consists of one or more food/beverage items (excluding plain water). The name of the eating occasion was selected from a fixed list provided during the interview. English and Spanish eating occasion names were grouped as follows:
- Breakfast: breakfast, desayuno, and almuerzo
- Lunch: brunch, lunch, and comida
- Dinner: dinner, supper, and cena
- Snack: snack, drink, extended consumption (items consumed over a long period of time), merienda, entre comidas, botana, bocadillo, tentempie, and bebida (excluding plain water)
Data source
Estimates in this report are based on one day of dietary intake data collected in What We Eat in America (WWEIA), the dietary intake interview component of the National Health and Nutrition Examination Survey (NHANES), in 2017-2018. Using the 5-step USDA Automated Multiple-Pass Method (AMPM) for the 24-hour recall, day 1 dietary data were collected in-person and day 2 data were collected by phone. A total of 4,742 individuals age 20+ years (2,307 males and 2,435 females) provided complete and reliable dietary intake data on day 1 and 4,139 (1,977 males and 2,162 females) on day 2 in 2017-2018. Sample weights were applied in all analyses to produce nationally representative estimates. USDA’s What We Eat in America food categories were used to describe fruit intake.
- 1.
- USDA My Plate. Available at https://www
.choosemyplate .gov/eathealthy /start-simple-myplate - 2.
- Hoy MK, Clemens JC, Martin CL, Moshfegh AJ. Fruit and Vegetable Consumption of US Adults by Level of Variety, What We Eat in America, NHANES 2013-2016. Curr Dev Nutr. 2020 Feb 4;4(3):nzaa014. doi: 10.1093/cdn/nzaa014. eCollection 2020 Mar [PMC free article: PMC7042609] [PubMed: 32110770] [CrossRef]
- 3.
- What We Eat in America Food Categories 2017-2018. Available at https://www
.ars.usda .gov/ARSUserFiles/80400530 /pdf/1718/Food _categories_2017-2018.pdf
- Hoy MK, Clemens JC, Moshfegh AJ. Intake of fruit by adults in the U.S.: What We Eat in America, NHANES 2017-2018. Food Surveys Research Group Dietary Data Brief No. 37, June 2021.
- What percentage of adults report consuming discrete fruit on a given day?
- How many different fruits do adults report on a given day?
- What fruits are reported most frequently by adults?
- What is the consumption among adults of fruit by race/ethnicity?
- What is the consumption of fruit among adults by income level?
- What is the consumption of fruit among adults at eating occasions?
- What proportion of adults who report fruit on day 1 also report fruit intake on day 2?
- Definitions
- Data source
- Review Intake of Fruit by Children and Adolescents: What We Eat in America, NHANES 2017-2018.[FSRG Dietary Data Briefs. 2010]Review Intake of Fruit by Children and Adolescents: What We Eat in America, NHANES 2017-2018.Hoy MK, Clemens JC, Moshfegh AJ. FSRG Dietary Data Briefs. 2010
- Review Intake of Vegetables by Adults: What We Eat in America, NHANES 2017-2018.[FSRG Dietary Data Briefs. 2010]Review Intake of Vegetables by Adults: What We Eat in America, NHANES 2017-2018.Hoy MK, Clemens JC, Moshfegh AJ. FSRG Dietary Data Briefs. 2010
- Review Intake of Vegetables by Children and Adolescents: What We Eat in America, NHANES 2017-2018.[FSRG Dietary Data Briefs. 2010]Review Intake of Vegetables by Children and Adolescents: What We Eat in America, NHANES 2017-2018.Hoy MK, Clemens JC, Moshfegh AJ. FSRG Dietary Data Briefs. 2010
- Fruit and Vegetable Consumption of US Adults by Level of Variety, What We Eat in America, NHANES 2013-2016.[Curr Dev Nutr. 2020]Fruit and Vegetable Consumption of US Adults by Level of Variety, What We Eat in America, NHANES 2013-2016.Hoy MK, Clemens JC, Martin CL, Moshfegh AJ. Curr Dev Nutr. 2020 Mar; 4(3):nzaa014. Epub 2020 Feb 4.
- Total fruit and vegetable consumption increases among consumers of frozen fruit and vegetables.[Nutrition. 2018]Total fruit and vegetable consumption increases among consumers of frozen fruit and vegetables.Storey M, Anderson P. Nutrition. 2018 Feb; 46:115-121. Epub 2017 Sep 19.
- Intake of Fruit by Adults - FSRG Dietary Data BriefsIntake of Fruit by Adults - FSRG Dietary Data Briefs
- Known Physical Carcinogens - Holland-Frei Cancer MedicineKnown Physical Carcinogens - Holland-Frei Cancer Medicine
- Concise Conserved Domain Links for Protein (Select 1206876209) (0)Conserved Domains
Your browsing activity is empty.
Activity recording is turned off.
See more...