Except where otherwise noted, this work is licensed under a Creative Commons Attribution-NonCommercial-NoDerivatives 4.0 International License. To view a copy of this license, visit https://creativecommons.org/licenses/by-nc-nd/4.0/
NCBI Bookshelf. A service of the National Library of Medicine, National Institutes of Health.
Cardiac Surgery
Since the publication of the first edition of the Dartmouth Atlas of Health Care in 1996, information about population-based, age-, sex-, and race-adjusted rates of particular surgical procedures among U.S. hospital referral regions (HRRs) has been available to the public. Hospital referral regions represent regional health care markets for tertiary medical care. Each HRR contains at least one hospital that performs major cardiovascular procedures and neurosurgery. More information on how hospital referral regions were defined is available in the Methods section of this document, and in the Appendix on the Geography of Health Care, located on our web site.
Coronary Revascularization: Coronary Artery Bypass Grafting and Percutaneous Coronary Interventions
National Trends in Utilization and Spending
Rates of coronary artery bypass grafting (CABG) surgery for the treatment of coronary artery disease rose and then fell during the decade 1992-2003. In 1992, the U.S. average rate of CABG was 5.3 per 1,000 Medicare enrollees. The rate peaked at 6.4 per 1,000 enrollees in 1997, and then decreased to 5.2 per 1,000 in 2003. By contrast, rates of percutaneous coronary interventions (PCI) rose steadily. In 1992, the U.S. average rate of PCI was 4.9 per 1,000 Medicare enrollees. The rate increased over the following decade, to 7.5 per 1,000 enrollees in 1997, reaching 11.3 per 1,000 in 2003.

Figure 1.
Trends in Rates of CABG and PCI, 1992-2003.
Medicare spending for inpatient stays for coronary revascularization showed a similar pattern (Figure 2). Inflation-adjusted spending for CABG rose and then fell during the decade; by 2003 the rate had decreased by 2.4%, from $4.43 billion in 1992 to $4.32 billion in 2003. Spending for PCI, by contrast, increased more than 150% during the same period, from $1.55 billion to $4.03 billion. In 1992, PCI represented 26% of total spending for coronary revascularization procedures; by 2003, PCI accounted for 48.2% of spending for coronary revascularization.

Figure 2.
Inpatient Medicare Reimbursements (in billions of dollars) for Coronary Revascularization Procedures, 1992-2003.
PCI is often considered a substitute for more invasive bypass surgery; however, rates of the two procedures were in fact positively correlated among hospital referral regions in 2003 (R2 = .14) (Figure 3). There was also a positive correlation between the changes in CABG and PCI rates from 1992 to 2003 (Figure 4). While in some regions a decline in CABG was associated with an increase in PCI, the overall relationship was positive (R2 = .04). Rates of CABG increased in about half of the 306 HRRs in the U.S., while rates of PCI rose in almost every region, declining slightly in only two.

Figure 3.
The Relationship Between Rates of CABG and PCI, 2003.

Figure 4.
The Relationship Between Changes in Rates of CABG and PCI, 1992-2003.
Though PCI increased much more sharply than CABG, rates of both procedures in 1992 were predictive of rates in 2003 (Figures 5 and 6). 29% of the variation in CABG rates among HRRs in 2003 was predicted by the variation in 1992, while 18% of the variation in PCI rates in 2003 was associated with the variation in 1992.
Rates of CABG were weakly correlated with the per-capita supply of cardiovascular surgeons in hospital referral regions in 1999 (the latest year for which workforce data are available). Regions with more than 2.5 cardiovascular surgeons per 100,000 residents did not have higher rates of CABG than areas with fewer than 1.5 surgeons per 100,000 (Figure 7). PCI rates were not correlated with the per-capita supply of cardiologists in 1999 (Figure 8).

Figure 7.
The Relationship Between Cardiovascular Surgeons per 100,000 Residents and Rates of CABG, 1999.

Figure 8.
The Relationship Between Cardiologists per 100,000 Residents and Rates of PCI, 1999.
However, rates of coronary angiography, the primary diagnostic test for determining the severity of coronary artery disease, were strongly correlated with rates of coronary revascularization in 2003 (R2 = .78), indicating that the more physicians looked for surgically treatable coronary artery disease, the more invasive treatment was provided (Figure 9).

Figure 9.
The Relationship Between Rates of Coronary Angiography and Coronary Revascularization, 2003.
Regional Variations in Rates of Coronary Artery Bypass Grafting
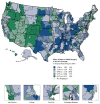
There was substantial regional variation in rates of CABG among Medicare enrollees in 2003 (Figure 10). Rates varied by a factor of five, from 1.9 per 1,000 enrollees to 9.5. Among the hospital referral regions where rates of CABG were highest were Mobile, Alabama (9.5); McAllen, Texas (9.1); Alexandria, Louisiana (8.4); Lincoln, Nebraska (8.2); and Flint, Michigan (8.2). Regions with rates lower than the national average of 5.2 CABG procedures per 1,000 enrollees included Grand Junction, Colorado (1.9); Honolulu (2.3); San Francisco (3.0); Boise, Idaho (3.1); and St. Cloud, Minnesota (3.1).

Figure 10.
Rates of CABG Among Hospital Referral Regions, 2003. Each point represents the rate in one of the 306 HRRs in the United States.
Regional Variations in Rates of Percutaneous Coronary Interventions
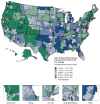
Rates of percutaneous coronary interventions varied more than tenfold among Medicare enrollees in 2003 (Figure 11). Among the hospital referral regions where rates of PCI were highest were Elyria, Ohio (42.0); Lafayette, Louisiana (27.5); St. Joseph, Michigan (23.4); Grand Forks, North Dakota (23.0); and Rome, Georgia (21.0). Regions with rates lower than the national average of 11.3 procedures per 1,000 enrollees included Honolulu (3.7); Asheville, North Carolina (4.9); Reno, Nevada (5.1); Danville, Pennsylvania (5.4); and Buffalo, New York (5.8).

Figure 11.
Rates of PCI Among Hospital Referral Regions, 2003. Each point represents the rate in one of the 306 HRRs in the United States.
Areas of Interest
Coronary Artery Bypass Grafting Surgery in Redding, California
In 1996, we reported that the rate of coronary artery bypass grafting among residents of the Redding, California HRR in 1992-93 was 7.4 per 1,000 Medicare enrollees. That rate was 42% higher than the national average of 5.2 procedures per 1,000 enrollees. When the next edition of the Atlas was published in 1998 (reporting 1994-95 data), the rate of bypass surgery in the Redding HRR had increased to 9.0 per 1,000 enrollees. At that time, the national average rate was 5.7 per 1,000 enrollees, and rates of the procedure in other California HRRs ranged from 3.7 in the Santa Rosa HRR to 6.8 in the Napa HRR.
The 1999 edition of the Dartmouth Atlas reported that the rate of CABG surgery in the Redding HRR in 1995-96 had climbed to 11.5 per 1,000 Medicare enrollees (a 55% increase over the rate in 1992-93), while the national average rate had grown by only 19%, to 6.2 per 1,000 enrollees. Rates of CABG in other California HRRs in 1995-96 ranged from 3.6 per 1,000 enrollees in the Santa Rosa HRR to 7.0 per 1,000 in the Salinas HRR. The 1999 edition of the Atlas pointed out that the Redding HRR had had the highest rate of bypass grafting surgery in the United States in 1995-96.
The table beneath the graph gives the rates of coronary artery bypass grafting surgery per 1,000 Medicare enrollees in the Redding HRR and in California from 1992 to 2003. The rate remained essentially constant throughout the state between 1992 and 2003, rising from 4.9 procedures per 1,000 in 1992 to 5.6 procedures in 1996, and then declining to 4.0 procedures in 2003. In the Redding HRR, however, rates of CABG surgery, which were about 40% higher than the state average in 1992, rose sharply between 1994 and 1996, to 12.1 per 1,000 Medicare enrollees, or more than twice the California average. After declining slightly in 1997 and 1998, rates in the Redding HRR rose again between 1998 and 2001, when the rate in Redding was 12.8 per 1,000 Medicare enrollees, or two and a half times higher than the state average. The national average rate of CABG per 1,000 Medicare enrollees in 2001 was 5.9, and in 2003 it declined to 5.2.

Figure 12.
Trends in Rates of Bypass Surgery in the Redding HRR and in California.
The table also gives the Redding HRR’s national ranking in rates of coronary artery bypass grafting during the decade 1992-2003 and estimates the number of procedures in excess of the California state average during the time period. In 1992, Redding’s rate of CABG ranked 27th among 306 HRRs in the United States. By 1995, Redding ranked 1st; and remained the highest-rate or second-highest-rate HRR in the country until 2002. In 2003, the Redding HRR ranked 227th among the 306 HRRs.
Had the rate of CABG in the rest of California prevailed in the Redding HRR, 81 fewer procedures would have been done in 1992. In 1994, had the state rate prevailed, 111 fewer procedures would have been done; and in 2001, 349 fewer procedures would have been done had the rate in Redding been the same as the rate in the rest of California. Between 1992 and 2003, there would have been 2,450 fewer CABG procedures among residents of the Redding HRR had the California average rate prevailed during the entire period.
Percutaneous Coronary Interventions in Elyria, Ohio
We reported in 1996 that the rate of percutaneous coronary interventions among residents of the Elyria, OH HRR in 1992-93 was 9.1 per 1,000 Medicare enrollees. That rate was 86% higher than the national average of 4.9 procedures per 1,000 enrollees. The 1999 edition of the Dartmouth Atlas reported that the rate of PCI in the Elyria HRR in 1995-96 had climbed to 16.9 per 1,000 Medicare enrollees (an 86% increase over the rate in 1992-93), while the national average rate had grown by 35%, to 6.6 per 1,000 enrollees.
Rates of the procedure in other Ohio HRRs ranged from 5.7 in the Cleveland HRR to 8.3 in the Dayton HRR in 1995-96. The 1999 edition of the Atlas pointed out that the Elyria HRR had the highest rate of PCI in the United States in 1995-96.
The table beneath the graph gives the rates of PCI per 1,000 Medicare enrollees in the Elyria HRR and in Ohio from 1992 to 2003. The rate rose steadily throughout the state between 1992 and 2003, rising from 5.0 procedures per 1,000 in 1992 to 9.0 procedures in 1998, and reaching 13.5 procedures per 1,000 by 2003. In the Elyria HRR, rates of PCI, which were about 80% higher than the state average in 1992, rose much more sharply between 1993 and 1998, from 9.1 to 23.8 procedures per 1,000 Medicare enrollees, or more than two and a half times the Ohio average. After declining slightly in 1999, rates in the Elyria HRR rose again between 1999 and 2003, when the rate in Elyria reached 42.0 per 1,000 Medicare enrollees, more than three times higher than the state average. The national average rate of PCI per 1,000 Medicare enrollees in 2003 was 11.3.

Figure 13.
Trends in Rates of PCI in the Elyria HRR and in Ohio.
The table also gives the Elyria HRR’s national ranking in rates of PCI during the decade 1992-2003 and estimates the number of procedures in excess of the Ohio state average during the time period. In 1992, Elyria’s rate of PCI ranked 11th among the 306 HRRs in the United States. By 1996, Elyria ranked 1st; and remained the highest-rate or second-highest-rate HRR in the country through 2003. Had the rate of PCI in the rest of Ohio prevailed in the Elyria HRR, 117 fewer procedures would have been done in 1992. In 1998, had the state rate prevailed, 388 fewer procedures would have been done; and in 2003, 810 fewer procedures would have been done had the rate in Elyria been the same as the rate in the rest of Ohio. Between 1992 and 2003, there would have been 4,388 fewer PCI procedures among residents of the Elyria HRR had the Ohio average rate prevailed during the entire period.
Aortic and Mitral Valve Replacement
National Trends in Utilization
Rates of aortic and mitral valve replacement increased about 33% from 1992 to 2003, from 1.05 procedures per 1,000 Medicare enrollees to 1.39 (Figure 14). Rates of valve replacement in 1992-93 were somewhat predictive of rates in 2002-03 (R2 = .23); 23% of the variation in rates in 2002-03 was predicted by the variation in 1992-93 (Figure 15). Rates of valve replacement were not correlated with the supply of cardiovascular surgeons per 100,000 residents in 1999 (R2 = .01) (figure not shown).

Figure 14.
Trends in Rates of Aortic and Mitral Valve Replacement, 1992-2003.

Figure 15.
The Relationship Between Rates of Valve Replacement in 1992-03 and 2002-03. The 45 degree line represents equality between rates; if the dot representing an HRR is located above the line, enrollees in that HRR experienced higher rates of utilization in (more...)
Regional Variations in Rates of Aortic and Mitral Valve Replacement
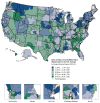
Rates of valve replacement varied more than fourfold among Medicare enrollees in 2002-03 (Figure 16), from 0.6 procedures per 1,000 Medicare enrollees to 2.5. Among the hospital referral regions where rates of valve replacement were highest were Stockton, California (2.5); Johnstown, Pennsylvania (2.4); Marshfield, Wisconsin (2.3); Hudson, Florida (2.1); and East Long Island, New York (2.1). Regions with rates lower than the national average of 1.4 procedures per 1,000 enrollees included Honolulu (0.6); Muncie, Indiana (0.7); Kingsport, Tennessee (0.7); Greensboro, North Carolina (0.8); and Fort Worth, Texas (0.9).

Figure 16.
Rates of Valve Replacement Among Hospital Referral Regions, 2002-03. Each point represents the rate in one of the 306 HRRs in the United States.
Areas of Interest
Aortic and Mitral Valve Replacement in Redding, California
In 1999, when the Dartmouth Atlas of Cardiovascular Health Care was published, we reported that rates of aortic valve replacement among Medicare patients had approximately doubled between 1988 and 1997, from 0.49 to 0.97 per 1,000 enrollees. Much of this increase was due to surgery rates in the very elderly. During this period, rates of aortic valve replacement among enrollees over age 75 increased 150% (from 0.20 to 0.50 per 1,000 enrollees). Rates among enrollees age 65 to 75 rose 57%, from 0.30 to 0.47 per 1,000 enrollees.
We also reported in 1999 that the rate of valve replacement surgery among residents of the Redding, California HRR in 1996-97 was 1.5 per 1,000 Medicare enrollees. That rate was about 66% higher than the national average of 0.9 procedures per 1,000 enrollees.
The rate of valve replacement surgery per 1,000 Medicare enrollees rose slightly throughout California between 1992 and 2003, rising from 1.2 procedures in 1992 to 1.5 procedures in 1998, and then declining to 1.3 per 1,000 enrollees in 2003. In the Redding HRR, however, rates of valve replacement surgery, which were slightly higher than the state average in 1992, rose sharply from 1995 to 1996, to 2.2 procedures per 1,000 Medicare enrollees. The rate of valve replacement surgery in the Redding HRR reached a high of 2.8 per 1,000 Medicare enrollees in 2000. This rate was twice the California average of 1.4 procedures per 1,000 enrollees in that year. The national average rate in 2000 was 1.4 per 1,000 Medicare enrollees, or about half the rate in the Redding HRR.

Figure 17.
Trends in Rates of Valve Replacement in the Redding HRR and in California.
The table beneath the graph gives the Redding HRR’s national ranking in rates of valve replacement surgery during the decade 1992-2003 and estimates the number of procedures in excess of the California state average during the time period. In 1992, the Redding HRR’s rate of valve replacement surgery ranked 19th among 306 HRRs in the United States. In 1994, it ranked 102nd. In 1996, Redding ranked 1st in the United States; it was 2nd in 1997 and 1998; 1st in 1999 and 2000; 3rd in the country in 2001, 8th in 2002, and 236th in 2003.
Had the rate of valve replacement surgery in the rest of California prevailed in the Redding HRR, seven fewer procedures would have been done in 1992. In 1994, had the state rate prevailed, four more procedures would have been done; and in 2000, 59 fewer procedures would have been done had the rate in Redding been the same as the rate in the rest of California. Between 1992 and 2003, there would have been 311 fewer valve replacement procedures in the Redding HRR had the California average rate prevailed during the entire period.
Methods
Hospital referral regions (HRRs) are aggregations of hospital service areas (HSAs). A hospital service area is a collection of Zip codes whose residents receive most of their hospitalizations from the hospitals within that area. Hospital referral regions represent regional health care markets for tertiary medical care; each HRR contains at least one hospital that performs major cardiovascular procedures and neurosurgery.
The Medicare population in an area that was used as the denominator for the rates in these studies included those alive, age 65 to 99, and not enrolled in a risk bearing HMO. The numerator for the surgical rates presented was based on all individuals meeting these eligibility criteria who underwent the specified procedure during an inpatient stay within the given year, based on the ICD-9-CM procedure codes shown in the table.
Rates based on a count of fewer than 11 observed counts are not displayed for reasons of patient confidentiality. Rates with fewer than 26 expected events are reported in parentheses to indicate lack of statistical precision; the margin of error is greater than 20%. In the case of aortic and mitral valve replacement, two-year rates are shown to increase the sample size. Rates were adjusted to the age, sex and race distribution of the national Medicare population as follows. The national event rate for each age-sex-race category was computed. These rates were then applied to the HSA and HRR populations to produce the expected number of events in the HSA or HRR; that is, the number of events that would have occurred in the HSA if its rate had been the same as the national event rate.
Appendix Table
Age-Sex-Race Adjusted Rates of Cardiac Surgery Among Medicare Enrollees by U.S. Hospital Referral Region
- NLM CatalogRelated NLM Catalog Entries
- Cardiac SurgeryCardiac Surgery
- Noonan syndrome 14Noonan syndrome 14MedGen
- Netherton syndromeNetherton syndromeMedGen
- Naxos diseaseNaxos diseaseMedGen
- Barber-Say syndromeBarber-Say syndromeMedGen
Your browsing activity is empty.
Activity recording is turned off.
See more...


