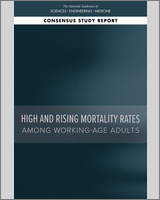
NOTE: The decomposition of the total change in cause-specific mortality rates between 1990 and 2017 is shown for three periods corresponding roughly to the changes in mortality within the 1990s (1990–1993 to 2000–2002), 2000s (2000–2002 to 2009–2011), and 2010s (2009–2011 to 2015–2017) for females ages 25–64. Each decomposition is shown separately for White (panels a, b, c), Black (panels d, e, f), and Hispanic (panels g, h, i) females in each of three age groups (25–44 [panels a, d, g], 45–54 [panels b, e, h], and 55–64 [panels c, f, i]). The green bars represent declines in mortality (dark green = decline in the 1990s, medium green = decline in the 2000s, and light green = decline in the 2010s), while the red bars represent increases in mortality (dark red = increase in the 1990s, medium red = increase in the 2000s, pink = increase in the 2010s). Readers should be mindful that the x-axis differs across panels. The causes of death shown are exhaustive of all underlying cause-of-death codes and are based on the International Classification of Diseases (ICD)-9 (1990–1998) and ICD-10 (1999–2017) codes. Mortality rates within each age group are age-adjusted by single-year of age to match the age distribution of the U.S. population in 2000 in order to improve comparability over time. More information about the classification of causes of death can be found in Chapter 5. ENM = endocrine, nutritional, and metabolic diseases
SOURCE: Data from https://www.cdc.gov/nchs/nvss/nvss-restricted-data.htm.