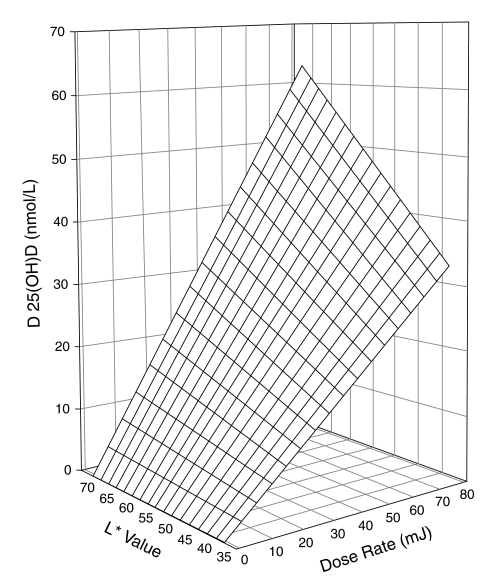
Scatterplot showing that serum 25OHD concentration in lighter skinned individuals was twice that of darker skinned individuals given the same UVB dose.

FIGURE 3-5Three-dimensional scatter-plot of 4-week change in serum 25OHD concentration above baseline expressed as a function of both basic skin lightness (L*) and UVB dose rate. Surface is hyperboloid, plotting equation 1, and was fitted to data using least squares regression methods

NOTE: Equation 1 is z = b * x * y, where z is the induced increase in serum 25OHD level from baseline (in nmol/L); x is UVB dose (in mJ/cm2 per session); y is skin lightness (expressed as the L* score value from the reflective meter); and b is the sole parameter to be fitted.

SOURCE: Reprinted with permission from Robert Heaney.

From: 3, Overview of Vitamin D

Cover of Dietary Reference Intakes for Calcium and Vitamin D
Dietary Reference Intakes for Calcium and Vitamin D.
Institute of Medicine (US) Committee to Review Dietary Reference Intakes for Vitamin D and Calcium; Ross AC, Taylor CL, Yaktine AL, et al., editors.
Washington (DC): National Academies Press (US); 2011.
Copyright © 2011, National Academy of Sciences.

NCBI Bookshelf. A service of the National Library of Medicine, National Institutes of Health.