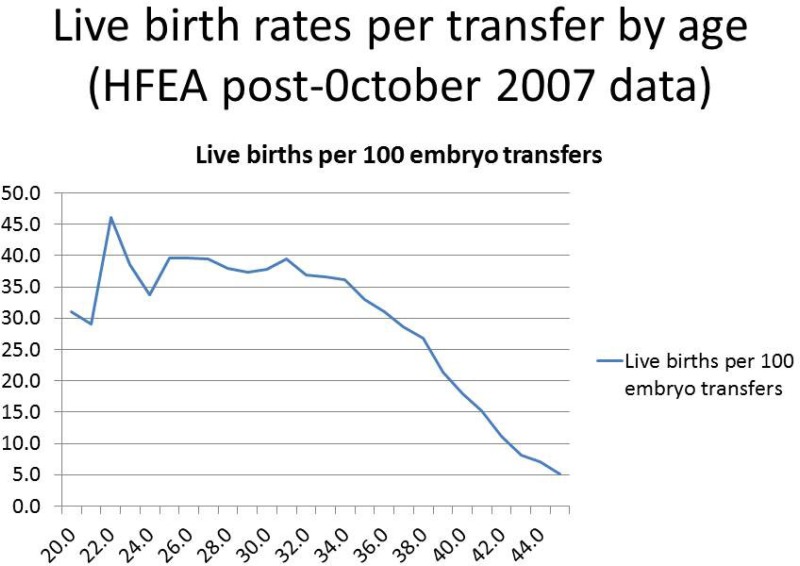
Figure 2. IVF success in terms of live births per 100 embryo transfers.

Figure 2IVF success in terms of live births per 100 embryo transfers

The vertical axis shows embryo transfers; the horizontal axis shows age of woman (based on all 52,996 embryo transfers using the woman’s own eggs undertaken in the UK between 1 October 2007 and 30 June 2009) [HFEA, personal communication] (note: small numbers of women aged under 24 years in the HFEA database).

From: Fertility problems: assessment and treatment

Cover of Fertility problems: assessment and treatment
Fertility problems: assessment and treatment.
NICE Clinical Guidelines, No. 156.
Copyright © NICE 2020.

NCBI Bookshelf. A service of the National Library of Medicine, National Institutes of Health.