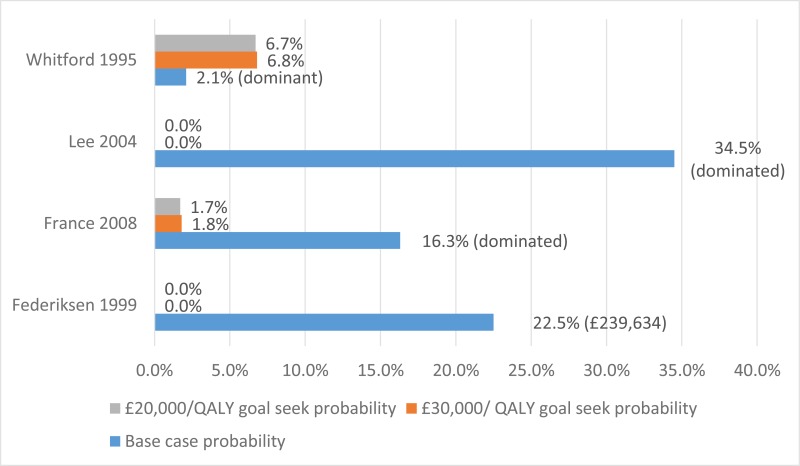
From: Appendix K, Health Economics

Cystic Fibrosis: Diagnosis and management.
NICE Guideline, No. 78.
National Guideline Alliance (UK).
London: National Institute for Health and Care Excellence (NICE); 2017 Oct 25.
Copyright © NICE 2017.
NCBI Bookshelf. A service of the National Library of Medicine, National Institutes of Health.
