

NCBI Bookshelf. A service of the National Library of Medicine, National Institutes of Health.
Kvietys PR. The Gastrointestinal Circulation. San Rafael (CA): Morgan & Claypool Life Sciences; 2010.
The exchange of fluid between the blood and interstitium is dependent on the hydrostatic and colloid osmotic pressure gradients exerted across the microvasculature and by the permeability and hydraulic conductance characteristics of the capillary barrier. Accordingly, the net transcapillary fluid movement can be described by the Starling relationship
Jv,c = Kf,c [(Pc – Pt ) – σd(πc – πt )]
where Jv,c is the rate of net transcapillary fluid movement (capillary filtration when positive and capillary absorption when negative), Kf,c is the capillary filtration coefficient (hydraulic conductance), Pc is the capillary hydrostatic pressure, Pt is the interstitial fluid pressure, σd is the osmotic reflection coefficient, πc is the plasma oncotic pressure, and πt is the interstitial fluid oncotic pressure.
7.1. NET TRANSCAPILLARY FLUID MOVEMENT ( Jv,c)
It is generally assumed that, under resting (nontransporting) conditions, the rate of lymph flow from a tissue provides an estimate of net transcapillary filtration rate or Jv,c [28,42,197]. Since lymph formation is dependent on interstitial to lymphatic pressure gradients, and the terminal lymphatics offer virtually no resistance to fluid movement, interstitial fluid pressure is the primary determinant of lymph flow [244]. Lymph flow is also facilitated by contractile activity of the lymphatics as well as interstitial compression of lymph vessels (e.g., villus contractions) [244,245].
The gastrointestinal tract is a transporting organ, and thus, lymph flow could vary with alterations in epithelial absorptive or secretory activity. For example, in the small intestine, net fluid absorption will increase interstitial volume (and pressure) and will drive interstitial fluid into both the capillaries and lymphatics [42,246]. Thus, the increase in lymph flow will not reflect the net transcapillary fluid movement. Conversely, net fluid secretion will result in a decrease in interstitial volume and pressure as well as an increase in capillary filtration [42]. However, a portion of the capillary filtrate will be removed from the interstitium by the secretory epithelium rather than the lymphatics. In this case, lymph flow will underestimate the net capillary filtration rate. Even if lymph flow is not affected by epithelial solute and fluid transport, as is the case in the colon [16], the rate of lymph flow will not be an accurate estimate of transcapillary filtration or absorption rate.
Under nontransporting conditions, lymph flow (in ml /min /100 g) draining the small intestine ranges from 0.005 to 0.018 in dogs [30,247], from 0.02 to 0.08 in cats [226,227,248–250], and from 0.13 to 0.38 in rats [29,251]. Thus, substantial species differences appear to exist in resting small intestinal lymph flow. A few estimates of gastric and colonic lymph flow are available. Canine colonic lymph flow is approximately 0.015 ml /min /100 g [16,218]. Direct measurements of gastric lymph flow are not available, but a rate of 0.04 ml /min /100 g has been calculated for the feline stomach from other parameters of the Starling relationship [28]. Based on the large size of the lacteals in the villi compared to the smaller, sparsely distributed initial lymphatics of the stomach and colon, one would predict that the rate of lymph flow would be greater in the small intestine than in the stomach or colon. However, the paucity of data in the stomach and colon and the degree of variability in measured resting lymph flows even within the small intestine, precludes any firm conclusions regarding a relationship between the rate of gastrointestinal lymph flow and intraorgan density/distribution of lymphatic channels.
In general, any condition or agent that increases capillary hydrostatic pressure will increase capillary fluid filtration and lymph flow [28,42]. Acute venous hypertension increases lymph flow in the stomach [212], small intestine [215], and colon [218]. Conversely, acute arterial hypotension decreases small intestinal lymph flow [60]. Under transporting conditions, changes in interstitial volume (and interstitial pressure) also produce predictable effects on small intestinal lymph flow. Net mucosal fluid absorption increases lymph flow, while net fluid secretion decreases lymph flow [28,42]. Colonic lymph flow is not affected by net mucosal fluid transport, presumably due to the remoteness of the meager initial lymphatics from the transporting epithelia [16].
7.2. CAPILLARY FILTRATION COEFFICIENT (Kf,c)
The Kf,c is a measure of transcapillary hydraulic conductance and, as such, is influenced by both the capillary surface area available for exchange as well as the capillary permeability to solutes and fluid [27]. Kf,c relates net transcapillary fluid movement (filtration or absorption) to the net pressure gradient established by the transcapillary hydrostatic and oncotic pressure gradients. Capillary filtration coefficients have been assessed in the stomach, small intestine, and colon using volumetric or gravimetric techniques. As mentioned above, resting values of Kf,c range from 0.03 to 0.30 ml /min /100 g for the small intestine of cats, dogs, and rats [28–30]. A similar range of Kf,c values have been reported for the stomach and colon [31–34].
7.3. CAPILLARY PRESSURE (Pc)
Capillary pressure, as measured by gravimetric or venous occlusion techniques, ranges from 12 to 17 mmHg in the small intestine of rats, cats, and dogs [28,42]. Capillary pressure has not been measured in gastric or colonic capillaries; however, calculated capillary pressure (from the balance of Starling forces) in the stomach is around 11 mmHg. Direct measurements of small intestinal capillary pressure by micropuncture indicate that the capillary pressure in the mucosa is lower (≈15 mmHg) than that of the muscularis (≈20 mmHg) [252]. The capillary pressures and relative blood flows in the two regions of the gut were used to calculate a weighted average capillary pressure of 16.8 mmHg, which agrees well with those measured with gravimetric and venous occlusion techniques.
Capillary pressure is readily altered by changes in arterial and venous pressures. Since the precapillary resistance is greater than the postcapillary resistance (pre- to postcapillary resistance ratio of 15:1), a greater increment in pressure is transmitted to the capillaries by acute venous hypertension (65–75%) than by acute arterial hypertension (5–10%) [74,250]. The increase in capillary pressure due to venous hypertension is less than predicted due to the accompanying increase in arteriolar resistance and decrease in venular resistance (increase in pre- to postcapillary resistance ratio). While this “buffering capacity” is present in the cat microcirculation, it is virtually absent in the rat, where 97% of the increment in venous pressure is transmitted back to the capillaries [29].
Vasoactive agents have predictable effects on capillary hydrostatic pressure in the gastrointestinal tract, i.e., vasodilators increase, while vasoconstrictors decrease capillary pressure. This general pattern of capillary pressure modulation by vasoactive agents is presumably due to their effect on precapillary resistance vessels [197].
7.4. INTERSTITIAL FLUID PRESSURE (Pt)
Interstitial fluid pressure in the small intestine has been assessed by (1) measurement of fluid pressure in implanted capsules, [253] (2) measurement of pressure in lacteals of the mucosal villi by micropuncture [254,255], and (3) by calculation of Pt from the balance of Starling forces [28,171,227,250]. There are limitations with all of these approaches. Implantation of capsules between the external muscle layers and the submucosa would represent submucosal /muscle interstitial fluid pressure, rather than mucosal. Lacteal pressures are assumed to equal that of the surrounding interstitial fluid due to the noncontinuous endothelial lining of the lymphatic vessels. Calculations of whole organ Pt are dependent on accurate measurements of each of the other factors of the Starling equation. Despite the different limitations of these three methods, they have yielded comparable values of Pt; under resting conditions, Pt near 0 mmHg (ranging from –2 to + 2 mmHg).
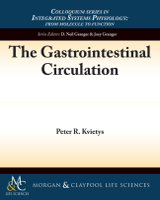
Pt is dependent on interstitial fluid volume, e.g., as gastric interstitial volume increases capsular estimates of interstitial pressure also increase [256]. The relation between intestinal interstitial fluid volume and pressure (compliance) is shown in Figure 7.1. The interstitial compliance curve indicates that, at normal tissue hydration, small changes in volume cause large changes in pressure (low compliance). However, when the tissue becomes overhydrated (edematous), a considerable volume of interstitial fluid can be accommodated with relatively small increments in pressure (high compliance). This phenomenon has been attributed to the collagen–glycosaminoglycan interactions (i.e., cross-linking), which form a compact gel-like matrix within the interstitium [28]. Thus, under resting conditions (low hydration state), this matrix immobilizes interstitial fluid such that the hydraulic conductivity of the interstitium is very low (Figure 7.1). Increases in interstitial hydration separates the matrix components (disruption of cross-linkages) and greatly increases its hydraulic conductivity [249].
FIGURE 7.1
Relationships among interstitial fluid pressure, hydraulic conductance, and volume. Used with permission from Handbook of Physiology, The Gastrointestinal System I, Chapter 39, 1989, pp. 1405–1474.
Several factors have been shown to alter intestinal interstitial fluid pressure. Increases in Pt are elicited by acute venous hypertension [253], intestinal absorption [254], and local infusions of bradykinin [257], histamine [253], or glucagon [258]. Decreases in Pt are associated with acute arterial hypotension [253,259], sympathetic stimulation [248], and active secretion [260].
In the stomach, interstitial fluid pressure, as measured by capsules implanted between the submucosa and muscularis compartments [256,261], was found to be near atmospheric (0.5 ± 0.3 mmHg). Predictably, increases in venous pressure and motor activity increased interstitial fluid pressure. However, the capsule fluid pressure was not affected by transmucosal fluid secretion across the gastric mucosa induced by intraluminal hypertonic solutions [261]. The fluid removed from the interstitium should have reduced mucosal interstitial fluid volume and, thereby, pressure (Figure 7.1). The lack of any changes in tissue pressure by the capsule method indicates that the submucosal /muscularis compartment (location of capsule) is situated too far from the mucosal epithelium to be impacted by transepithelial fluid movement.
7.5. OSMOTIC REFLECTION COEFFICIENT (σd)
Since gastrointestinal capillaries are permeable to most plasma proteins, only part of the oncotic pressure generated by plasma proteins is exerted across the capillary wall. The osmotic reflection coefficient (σd) describes the fraction of the total oncotic pressure generated across a capillary membrane. Impermeant proteins generate 100% of their maximum oncotic pressure (σd = 1), whereas freely permeable proteins do not generate an oncotic pressure (σd = 0). Estimates of σd for total plasma proteins have been obtained for all of the organ systems of the gastrointestinal tract using lymph protein flux (Table 6.1). σd values for total plasma proteins in the small intestine of the cat, rat, and dog range from 0.83 to 0.92 [29,30,215,230,231,247,262]. The values for σd in the canine colon and feline stomach are 0.085 and 0.78, respectively [212,218]. The lack of sufficient information in the stomach and colon and the variability of the estimates for σd in the small intestine preclude intraorgan comparisons. Various physiologic and pathologic conditions which affect σd are listed in Table 6.3.
7.6. TRANSCAPILLARY ONCOTIC PRESSURE GRADIENT (πc − πt)
Under the assumption that lymph protein concentration provides a valid estimate of interstitial protein concentration [216,217], the transcapillary oncotic pressure can be estimated from lymph and plasma protein concentrations using an oncometer or equations that relate protein concentration to oncotic pressure. The transcapillary oncotic pressure gradient ranges from 11.5 to 13.0 in the stomach, small intestine, and colon, with no appreciable differences among species or regions of the gastrointestinal tract [28].
Since σd > 0 for total plasma proteins, any condition that increases capillary filtration (in the absence of any changes in σd) would increase tissue volume and dilute interstitial proteins, thereby, increasing the transcapillary oncotic pressure gradient. Thus, acute venous hypertension (increased capillary pressure) increases the gradient in the stomach [212], small intestine [250], and colon [218]. Conversely, any condition that decreases capillary filtration or decrease interstitial volume would tend to decrease the transcapillary oncotic pressure gradient (e.g., arterial hypotension) [28].
In the small intestine, epithelial transport predictably effects the transcapillary oncotic pressure gradient as measured by lymphatic protein flux analysis, i.e., an increase in the gradient during fluid absorption and a decrease during fluid secretion [28,42]. However, in the colon, an analyses of lymph protein flux suggests that the transcapillary oncotic pressure gradient is not affected by either active epithelial absorption or secretion [16]. Since the lymphatic vessels are farther removed from the transporting epithelium in the colon than their counterparts in the small intestine, alterations in juxtacapillary protein concentrations may be altered and corrected (adjustments of juxtacapillary Starling forces) without concomitant detectable changes at the level of the initial lymphatics in the basal mucosal layer (crypt region) [263].
- Transcapillary Fluid Exchange - The Gastrointestinal CirculationTranscapillary Fluid Exchange - The Gastrointestinal Circulation
Your browsing activity is empty.
Activity recording is turned off.
See more...