

Bookshelf ID: NBK525003PMID: 30183221
NCBI Bookshelf. A service of the National Library of Medicine, National Institutes of Health.

Rapid Evidence Review: Measures for Patients with Chronic Musculoskeletal Pain
Investigators: Elizabeth S. Goldsmith, MD, Maureen Murdoch, MD, MPH, Brent Taylor, PhD, Nancy Greer, PhD, Roderick MacDonald, MS, Lauren G. McKenzie, MPH, and Christina Rosebush, MPH.
Washington (DC): Department of Veterans Affairs (US); 2017 Aug.
Preface
The VA Evidence-based Synthesis Program (ESP) was established in 2007 to provide timely and accurate syntheses of targeted healthcare topics of particular importance to clinicians, managers, and policymakers as they work to improve the health and healthcare of Veterans. QUERI provides funding for four ESP Centers, and each Center has an active University affiliation. Center Directors are recognized leaders in the field of evidence synthesis with close ties to the AHRQ Evidence-based Practice Centers. The ESP is governed by a Steering Committee comprised of participants from VHA Policy, Program, and Operations Offices, VISN leadership, field-based investigators, and others as designated appropriate by QUERI/HSR&D.
The ESP Centers generate evidence syntheses on important clinical practice topics. These reports help:
- Develop clinical policies informed by evidence;
- Implement effective services to improve patient outcomes and to support VA clinical practice guidelines and performance measures; and
- Set the direction for future research to address gaps in clinical knowledge.
The ESP disseminates these reports throughout VA and in the published literature; some evidence syntheses have informed the clinical guidelines of large professional organizations.
The ESP Coordinating Center (ESP CC), located in Portland, Oregon, was created in 2009 to expand the capacity of QUERI/HSR&D and is charged with oversight of national ESP program operations, program development and evaluation, and dissemination efforts. The ESP CC establishes standard operating procedures for the production of evidence synthesis reports; facilitates a national topic nomination, prioritization, and selection process; manages the research portfolio of each Center; facilitates editorial review processes; ensures methodological consistency and quality of products; produces “rapid response evidence briefs” at the request of VHA senior leadership; collaborates with HSR&D Center for Information Dissemination and Education Resources (CIDER) to develop a national dissemination strategy for all ESP products; and interfaces with stakeholders to effectively engage the program.
Comments on this evidence report are welcome and can be sent to Nicole Floyd, ESP CC Program Manager, at vog.av@dyolF.elociN.
Abstract
Objective
Developing successful interventions for chronic musculoskeletal pain requires valid, responsive, and reliable outcome measures. By request of the 2016 State of the Art Conference on nonpharmacological approaches to chronic musculoskeletal pain, the Minneapolis VA Evidence-based Synthesis Program completed a rapid evidence review. We addressed a key question regarding psychometric properties of selected self-report pain measures to assist in adoption of these measures as core outcomes in clinical trials and other research of nonpharmacological approaches to chronic musculoskeletal pain.
Methods
With input from operational partners, we identified 17 English-language candidate measures. All measures assessed pain severity or intensity or pain-related functional impairment. Our primary outcome was the measure’s minimally important difference (MID); secondary outcomes included the measure’s reliability, validity, and responsiveness to change. We searched MEDLINE (Ovid) from January 2000 to January 2017 for English language publications. We also searched reference lists of relevant studies and systematic reviews and websites specific to pain measures of interest, with no publication date restrictions for these searches. We included studies that 1) evaluated at least one of the 17 pain measures; 2) included adults with chronic musculoskeletal pain of at least 3 months duration or adults with musculoskeletal pain described as “chronic” by the study authors; and 3) reported on at least one of the 4 psychometric outcomes listed above. We excluded 1) studies that used non-English language versions of the pain measures; 2) studies of acute musculoskeletal pain or studies of musculoskeletal conditions often associated with chronic pain that did not specify the presence or duration of their participants’ pain; 3) intervention trials, unless the trial also assessed the psychometric properties of their measures and noted this in the abstract; and 4) studies of patients with rheumatoid arthritis, orofacial pain other than temporomandibular disorder, or headache. Abstracts and full text of articles meeting inclusion criteria were reviewed by trained staff, who extracted study/population characteristics and psychometric outcomes. Results were qualitatively synthesized. Our protocol was registered in PROSPERO (CRD42017056610).
Results
Of 1635 abstracts identified, 318 articles underwent full-text review, and 43 met inclusion criteria. Six of the 43 studies included Veteran populations. Eight studies provided MID estimates for 8 of the 17 measures. MIDs for individual measures differed considerably based on study design and analysis methods. Four measures – Oswestry Disability Index (ODI), Roland-Morris Disability Questionnaire (RMDQ), Numeric Rating Scale (NRS), and Visual Analog Scale (VAS) – had data reported on all 4 psychometric outcomes. However, the NRS and VAS, both single-item measures, were often modified across different studies; results from one study might therefore not apply to others using a different version. MIDs, responsiveness, and validity were reported for the Brief Pain Inventory (BPI), Global Chronic Pain Scale (GCPS), PEG, and Short Form 36 Bodily Pain Scale (SF-36 BPS). Responsiveness, validity, and test-retest reliability estimates were reported for the McGill Pain Questionnaire (MPQ), PROMIS Pain Interference (PROMIS-PI), West Haven-Yale Multidimensional Pain Inventory (WHYMPI), and Western Ontario and McMaster Universities Osteoarthritis Index (WOMAC).
Conclusions
Among the multi-item pain measures we assessed, the ODI, RMDQ, and SF-36 BPS had the most complete psychometric evidence within chronic musculoskeletal pain populations. Several additional measures had at least some evidence for psychometric reliability, validity, and responsiveness. Research into pain measurement would be considerably strengthened if future investigators use consistent definitions of chronic musculoskeletal pain, standardized methods for assessing psychometric outcomes, and comprehensive descriptions of their patient populations.
Impacts
Findings from this review can inform recommendations on specific core outcome measures for clinical research on chronic musculoskeletal pain interventions. Further methods research is needed to validate patient-reported pain outcome measures in populations with chronic musculoskeletal pain and develop a framework for determining outcome measurement selection that incorporates feasibility and applicability.
Evidence Report
Introduction
Chronic musculoskeletal pain is a major source of disability and morbidity for Veterans in the US, affecting approximately 60% of Veterans with chronic health conditions in Veterans Health Administration (VHA) primary care.1 Management of chronic musculoskeletal pain remains challenging, and groups ranging from pain expert coalitions to the National Institutes of Health and the Institute of Medicine have recently called for more focused and strategic pain therapy research.2,3 As these groups note, successful development and testing of interventions to improve chronic musculoskeletal pain depends on the use of valid, reliable, and responsive measures of pain and pain-related outcomes domains.
Pain-related measures span multiple physical, emotional, and social domains that are affected by chronic musculoskeletal pain. To guide development and use of these measures, experts and stakeholders have formed such initiatives as Outcome Measures in Rheumatology (OMERACT), the Analgesic, Anesthetic, and Addiction Clinical Trial Translations, Innovations, Opportunities, and Networks (ACTTION), public-private partnership with the United States Food and Drug Administration (FDA), and the associated Initiative on Methods, Measurement and Pain Assessment in Clinical Trials (IMMPACT). These groups have published several reviews and compiled recommendations suggesting that pain outcome studies measure multiple domains via multiple modes of assessment.4–8
Such expert groups have identified both pain intensity or severity (hereafter “severity”) and pain-related impairment of physical function (hereafter “functional impairment”) as key domains for study, as these reflect both pain symptoms and pain’s impact on people’s daily lives.4,6 Functional impairment in particular has been identified as a priority concern for patients,9 and is an increasingly common primary outcome domain alongside pain severity. Self-report measures remain the gold-standard mode of assessing core pain outcomes, as they reflect the subjective pain experience, and as existing observer- and laboratory-based pain measures do not consistently reflect clinically meaningful changes in key pain domains.4,5,10
Researchers who wish to select appropriate self-report pain outcome measures for these key domains still face challenging evidence limitations. There is particular need for measures appropriate for non-pharmacological interventions. While available measures have been developed and adapted for multiple pain conditions and bodily locations, and have been studied in populations with a wide range of demographic traits, existing psychometric property and feasibility evidence is difficult to locate and compare across measures. Additionally, a consensus on ideal measures has not yet been achieved.
Therefore, it would be advantageous to have a core set of measures across intervention studies. This would make it easier to synthesize, disseminate, and provide recommendations to the VHA about the effectiveness and harms of different interventions. Even if evidence does not clearly demonstrate a single best measure or core set, identification of existing evidence would be informative.
As such, the 2016 State of the Art (SOTA) Conference on non-pharmacological approaches to chronic musculoskeletal pain management recognized the potential value of adopting a core set of measures and recommended that VA Health Services Research and Development (HSR&D) convene a small group of researchers to develop a short set of core outcome measures for prospective pain research. The set of measures should cover 2 core patient-reported outcomes: pain intensity and pain-related functioning. The group plans to consider many factors in selecting the core measures, choosing from among measures that have demonstrated suitable psychometric properties in the target population. The group requested a rapid evidence review to describe and compare the key psychometric qualities of commonly used measures, particularly those that might be suitable for clinical trials of nonpharmacological approaches to chronic pain management. These qualities would not be the only criterion for selecting core measures, but could serve as a basic requirement of measures considered candidates for wide implementation.
In conjunction with the topic nominators we identified the population of interest, pain measures to be reviewed, study inclusion and exclusion criteria, and primary and secondary outcomes and developed a protocol (registered in PROSPERO - CRD42017056610).
Key Question
We addressed the following key question:
What specific self-report measures of pain (intensity, severity) and pain-related functional impairment (activity limitations, participation, physical functioning, social role functioning, pain impact, pain interference, pain-related disability) have sufficient information on psychometric properties (eg, minimally important differences, validity, responsiveness, reliability) to consider their adoption for use as core outcome measures in prospective observational research and clinical trials of nonpharmacological approaches to care for persons (including Veterans) with chronic (≥ 3 months) musculoskeletal pain (eg, low back pain, osteoarthritis, and non-traumatic joint pain)?
Included Pain Measures
Our review focused on the following measures of pain intensity/severity, pain-related interference, or pain global change for persons with chronic musculoskeletal pain (as identified by the Operational Partners for the review and the SOTA Planning Committee):
- Brief Pain Inventory (BPI)
- Defense & Veterans Pain Rating Scale (DVPRS)
- Graded Chronic Pain Scale (GCPS)
- Hip Osteoarthritis Outcomes Scale (HOOS)
- Knee Osteoarthritis Outcomes Scale (KOOS)
- McGill Pain Questionnaire (MPQ)
- Multidimensional Pain Inventory (MPI, WHYMPI)
- Numeric Rating Scale (NRS)
- Oswestry Disability Index (ODI)
- Patient Global Impression of Change (PGIC)
- PEG (assesses [P] pain intensity, [E] enjoyment of life, and [G] general activity)
- Patient-Reported Outcomes Measurement Information System - Pain Interference (PROMIS-PI)
- Roland-Morris Disability Questionnaire (RMDQ)
- SF-36 Bodily Pain Scale (SF-36 BPS)
- Visual Analogue Scale (VAS)
- Western Ontario and McMaster Universities Arthritis Index (WOMAC)
- Wong Faces Scale
Methods
We searched MEDLINE (Ovid) for English-language articles published from 2000 to January 2017. Our search strategy, developed with input from a medical librarian, included Medical Subject Heading (MeSH) terms for Pain Measurement and specific locations/types of pain (eg, Low Back, Shoulder, Chronic) along with title and abstract words. The search was designed to include all study designs, including systematic reviews. The full search strategy is presented in Supplemental Content, Table 1. At the request of peer reviewers, we repeated the search with MeSH and title/abstract terms for fibromyalgia.
We used Google Scholar, the National Center for Biotechnology Information (NCBI), and PubMed to search for Web sites associated with each pain measure and publications not retrieved by our MEDLINE search. Additional articles were obtained by reviewing reference lists of relevant systematic reviews identified in our MEDLINE search and reference lists of included studies. We also reviewed studies suggested by content experts. For these sources, there were no limits on publication date.
Study Selection
Abstracts of studies identified in our MEDLINE search were reviewed by a single investigator or research associate. The full text of potentially eligible articles from the abstract review and all articles identified from reference list searching or suggested by content experts were reviewed by 2 investigators or research associates.
At the abstract and full-text review levels, we included studies that:
- 1)
Evaluated pain measures in adults with chronic musculoskeletal pain of at least 3 months duration (or was described as “chronic pain” by the study authors); if the study included multiple types of pain, at least 75% of the population must have had chronic musculoskeletal pain unless results were reported separately for the chronic musculoskeletal pain group,
- 2)
Reported on self-reported measures of pain or pain-related functioning (17 measures as determined by Operational Partners and SOTA Planning Committee),
- 3)
Reported outcomes of interest: minimally important difference (MID) (primary outcome), test-retest reliability, validity, feasibility (ie, number of items, public domain vs proprietary, self-report vs interviewer-administered), responsiveness, and generalizability.
Our exclusion criteria were as follows:
- 1)
Studies that specified that they used non-English-language versions of the pain measures,
- 2)
Studies of patients with chronic musculoskeletal conditions commonly associated with pain but without specifying that enrolled patients had chronic musculoskeletal pain (eg, osteoarthritis),
- 3)
Trials of interventions for pain that did not note assessment of psychometric properties in the abstract,
- 4)
Studies of patients with rheumatoid arthritis, orofacial pain (other than temporomandibular joint pain – a musculoskeletal condition), or headache.
Data Abstraction
From each eligible study, we abstracted the following:
- 1)
Study/population characteristics: location of study, funding source, pain measures evaluated, time period of assessment (eg, reporting pain over past week, past month, etc), mode of administration, setting, chronic pain condition, study inclusion/exclusion criteria, baseline pain characteristics, sample size, age, gender, and race/ethnicity,
- 2)
Outcomes: MID, reliability, validity, responsiveness, and other psychometric properties.
Quality Assessment
We included only studies that discussed psychometric properties of the pain measures. Trials that used the measures but did not comment on how well the measures performed were not included.
Data Synthesis
We narratively summarized included studies by pain measure to provide an overview of the populations and pain conditions for which the psychometric properties of the measure have been evaluated. We narratively summarized outcomes by psychometric properties. We focused on MID, responsiveness, validity, and test-retest reliability and highlighted comparative effectiveness when reported.
Rating the Body of Evidence
We did not rate the overall body of evidence.
Peer Review
A draft version of this report was reviewed by content experts and clinical leadership, and the report was modified in response to reviewers’ input. Reviewer comments and our responses are presented in Supplemental Content, Table 2.
Results
Literature Flow
After removing duplicate citations, we reviewed 1,635 abstracts and excluded 1,317. Of 318 articles reviewed at the full text level, 275 were excluded (Figure 1). Over 60% were excluded because they did not report outcomes of interest. Other reasons for exclusion were not including a pain measure of interest, using a non-English version of the pain measure, and not defining the study population as having chronic musculoskeletal pain.
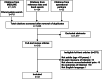
Figure 1
Literature Flow Chart.
Overview of Pain Measures and Included Studies
Table 1 below summarizes the characteristics of the pain measures included in the review. Additional information about each pain measure is included in Supplemental Content, Table 3.
Table 1
Overview of Pain Measures.
Overview of Included Studies
We included 43 studies: 23 from the US,17,20,27–47 3 from Canada,48–50 one from South America,51 5 from Australia,52–56 and 11 from Europe.57–67 Of the US studies, 4 enrolled exclusively Veterans17,35,39,44 and 2 enrolled both Veterans and non-Veterans.20,37 Study characteristics are presented on Table 2 with additional detail in Supplemental Content, Table 4.
Table 2
Overview of Included Studies.
Study enrollments ranged from 3062 to 998,43 with 29 enrolling more than 100 and 3 enrolling more than 500.29,34,43 The most common chronic musculoskeletal pain condition was low back pain (LBP) with 16 studies enrolling only LBP patients.28,29,33,34,36,39,41,45,52,55,57–59,61,63,66 Another 13 studies included patients with any chronic musculoskeletal pain.27 17,30,35,38,43,44,47,49,51,53,62,65 One study reported that 62% of participants were over age 50 years.28 In the remaining 40 studies that reported mean age, values ranged from 32 years67 to 80 years.33 The mean age was less than 50 years in 18 studies, 50 to 59 years in 15 studies, and 60 years and older in 7 studies. In the studies that enrolled exclusively US Veterans, the percentage of women ranged from 8% to 19%. In the remaining studies, 5 studies enrolled fewer than 50% women,32,42,52,62,64 29 enrolled 50% or more, and 5 did not report the percentage of women enrolled. Race/ethnicity was reported in 18 of the studies, all but one from the US. The percentage of white enrollees was 75% or higher for 11 of the 18 studies.
No studies meeting eligibility criteria evaluated psychometric properties of the DVPRS or KOOS. DVPRS studies intermixed patients with chronic and acute pain and either had fewer than 75% of patients with chronic pain68 or did not specify the percentage with chronic pain.12 Studies of the KOOS used non-English versions.15,69
Characteristics of Included Studies for Each Pain Measure
Brief Pain Inventory (BPI)
The BPI is a Likert-type scale (range 0–10) originally designed to measure cancer pain intensity and pain interference.11 Pain intensity is measured by 4 items: current pain, and pain at its least, worst, and average over a time of interest (often the past 24 hours or week). Pain interference is measured for 7 domains: physical functioning, work, mood, walking, social activity, relations with others, and sleep. Scores for each BPI measure range from 0 “no pain/interference” to 10 “pain as bad as you can imagine/complete interference.”
We included 6 studies that evaluated the BPI’s psychometric properties (details of study and participant characteristics are provided in Supplemental Content, Table 4).20,35–37,44,53 One study53 assessed only the BPI’s pain severity subscale.
The BPI was administered by interview in 3 studies20,35,37 and by self-report in another 3 studies.36,44,53
Defense and Veterans Pain Rating Scale (DVPRS)
The DVPRS was developed to provide a standardized pain screening and assessment tool for the Department of Defense and VHA health systems.12 It includes numeric rating scales for one question about pain intensity and 4 questions about pain interference. The numeric scale for pain intensity ranges from 0 to 10 and is enhanced with descriptors for each of the 11 levels, color-coded bars using traffic light colors where green indicates mild pain and red indicates severe pain, and facial expressions. The pain interference questions address activity, sleep, mood, and stress. We found no studies meeting eligibility criteria for the DVPRS.
Graded Chronic Pain Scale (GCPS)
The Graded Chronic Pain Scale (GCPS), also known as Chronic Pain Grade Questionnaire (CPG) is an interview or self-administered measure used to assess pain intensity and interference related to disability.13 It was designed in 1992 for use with chronic pain conditions including musculoskeletal and low back pain. Pain intensity is measured on an 11-point Likert scale from 0-10 anchored by “no pain” (0) and “pain as bad as can be” (10). The disability score is based on the number of days of disability and a numeric rating of pain disability.
We included 3 studies that evaluated psychometric properties of the GCPS (details of study and participant characteristics are provided in Supplemental Content, Table 4).20,36,37 Each of the studies assessed both the severity and disability components.
Hip Osteoarthritis Outcomes Scale (HOOS)
The Hip Osteoarthritis Outcomes Scale (HOOS) was developed in 2002 as an extension of the WOMAC scale for hip disability among people with or without osteoarthritis.14 The self-administered HOOS evaluates pain intensity and interference related to physical functioning. The HOOS consist of 5 subscales: pain, symptoms, daily living limitations, sport and recreation limitations, and hip related quality of life. The HOOS uses a 5-point Likert type scale with anchors of “no problems” (0) to “extreme problems” (4).
One study of the HOOS was included in our review (details of the study and participant characteristics are provided Supplemental Content, Table 4).64 We report outcomes from the pain and activities of daily living limitations subscales.
Knee Osteoarthritis Outcomes Scale (KOOS)
The KOOS is an extension of the WOMAC scale. It was designed to assess patient-relevant outcomes following a knee injury or post-traumatic osteoarthritis.15 Responses to the 42 items are on a 5 point scale ranging from “none” or “never” to “extreme” or “always.” The 42 items are grouped into pain intensity, symptoms, activities of daily living, sport and recreation, and quality of life subcategories. We found no studies meeting eligibility criteria for the KOOS.
McGill Pain Questionnaire (MPQ)
The MPQ measures general chronic pain using 78 items in 20 subscales. It is used to evaluate pain intensity.16 Respondents are asked to respond to sensory, affective, and evaluative word descriptors of their pain. Responses are used to create a Pain Rating Index (PRI) and/or a Total Number of Words Chosen score. There is also a single item, the Present Pain Intensity (PPI), with pain rated from 0 to 5. Two revised forms of the MPQ exist: the short-form MPQ (SFMPQ) and a revised and extended short-form MPQ (SF-MPQ-2).
We included 4 studies that assessed the psychometric properties of the MPQ (details of study and participant characteristics are provided in Supplemental Content, Table 4).17,39,48,59 Each of the studies assessed pain intensity using the Present Pain Intensity17,59; Total Number of Words Chosen59; Total Pain Rating Index17; total score over the continuous, intermittent, neuropathic, and affective domains39; or Adjective Checklist.48 The MPQ was self-administered in all of the studies. One study administered a short-form version 39; the others used the original version.
Multidimensional Pain Inventory (MPI/WHYMPI)
The 52-item MPI, also known as the West Haven-Yale Multidimensional Pain Inventory (WHYMPI) was designed to measure chronic pain, including lower back pain and temporomandibular disorders.17 It uses a Likert-type scale of 0-6 to measure pain intensity and pain interference. Pain interference is measured for daily activities including vocational, social, and familial functioning.
We included 4 studies that evaluated properties of the MPI (details of study and participant characteristics are provided in Supplemental Content, Table 4).17,39,47,49 Each of the studies assess both pain intensity and pain interference.
Numeric Rating Scale (NRS) for Pain
Numerical Rating Scales (NRS) were developed to measure pain intensity for general chronic pain conditions.16 The NRS studied for this report was typically an 11-point Likert type scale ranging from 0 (no pain) to 10 (severe pain), with subcategories of mild (1-3) and moderate (4-6). This self-administered NRS can be written or verbal. Of the 11 included studies, 2 administered the NRS by mail or by phone.32,50
We included 11 studies for psychometric properties of the NRS (details of study and participant characteristics are provided in Supplemental Content, Table 4).32,38,42,46,50,51,54,56,58,63,66 All of the studies used the NRS to assess pain intensity. One study also assessed pain “bothersomeness” – a measure of interference or functional impairment.56
The timeframe over which patients were asked to rate pain intensity differed across the studies, such that some asked patients to rate their “current pain,”38,50 their average pain over the last 24 hours,54,56 their pain on the day prior to their study visit,51 their pain in the past week,46,50 or their pain in the past month.50 Several did not specify or report a timeframe,32,58,66 and one study asked patients to rate their pain intensity before and after a hand grip test.42
Oswestry Disability Index (ODI)
The ODI was developed to assess disability from acute and chronic lower back pain.18 It measures a combination of pain intensity and interference, referred to as disability, using a Likert-type scale. Scores range from 0 “no pain/interference/disability” to 5 “worst scenario of pain/interference/disability.” The ODI includes 10 items, one for pain or need for pain medications and 9 for interference in daily activities.
Ten studies that evaluated the psychometric properties of the ODI met our criteria for inclusion in this review (details of study and participant characteristics are provided in Supplemental Content, Table 4).27,33,41,47–49,57,59,61,63 All studies reported using self-administered questionnaires with one administered through the mail.33
Patient Global Impression of Change (PGIC)
The Patient Global Impression of Change (PGIC) is a Likert-type scale used to assess the respondent’s overall impression of change in pain, often following an intervention.19 Two studies that reported on the PGIC were included in our review (details of study and participant characteristics are provided in Supplemental Content, Table 4).20,65 In one study, pain and function were assessed.65 The other study used the scores on the PGIC to categorize whether pain intensity was improved, unchanged, or worse over a 6 month period.20
PEG
The PEG is a 3-item pain questionnaire designed to quickly assess chronic pain in primary care settings. Respondents are asked about pain intensity (P), interference with enjoyment of life (E), and interference with general activity (G) in the past week. Each item is assessed on a Likert-type scale 0-10, and individual item scores are averaged. Questions on the PEG are derived from the longer, more comprehensive BPI.
Three studies included in our review evaluated the psychometric properties of the PEG (details of study and participant characteristics are provided in Supplemental Content, Table 4).20,35,37 In all 3 studies, the PEG was administered by an interviewer.
Patient-Reported Outcomes Measurement Information System - Pain Interference (PROMIS-PI)
The PROMIS-PI was developed in 2004 and is used for general chronic pain conditions to examine interference related to physical functioning.21 PROMIS-PI consists of a 5-point Likert type scale corresponding to 1 (not at all) and 5 (very much). This PROMIS-PI can be self-administered, interview-administered, or administered through a proxy.
Five studies were included that examined the psychometric properties of the PROMIS-PI (details of study and participant characteristics are provided in Supplemental Content, Table 4).28,30,31,35,40
Roland Morris Disability Questionnaire (RMDQ)
The Roland Morris Disability Questionnaire (RMDQ) was developed in 1983 to evaluate disability and physical functioning interference from low back pain.22 The RMDQ is self-administered with 24 items scored from 0 (no disability) to 24 (severe disability). Since its origination, 11-item, 12-item, and 18-item versions have been developed.
Psychometric properties were assessed in 9 studies (details of study and participant characteristics are provided in Supplemental Content, Table 4).20,29,36,37,43,44,52,55,63 All but 2 studies29,52 administered the 24-item version of the RMDQ. Three studies assessed multiple versions.29,43,55
SF-36 Bodily Pain Scale (SF-36 BPS)
The SF-36 Bodily Pain Scale (SF-36 BPS) uses 2 items to assess pain intensity and interference in daily activities over the past 4 weeks.23 The Bodily Pain Scale is one of 8 scaled scores in the SF-36, a measure of overall health status.
We included 10 studies that evaluated the psychometric properties of the SF-36 BPS in our review (details of study and participant characteristics are provided in Supplemental Content, Table 4).20,31,33,35–37,47,54,56,64 Four studies asked participants to complete the SF-36 in its entirety and reported results specific to the bodily pain scale.31,33,47,64 One study used only the pain intensity question from the bodily pain scale.54
One study used an interviewer-administered SF-36.35 The remaining studies used a self-administered questionnaire (SAQ). One of these studies specified that the questionnaire was mailed.33
Visual Analogue Scale (VAS) for Pain
Development of the Visual Analogue Scale (VAS) dates to 1952. It is used to measure pain intensity and interference related to disability.24 The VAS is composed of an incrementally measured vertical line anchored with 2 opposing descriptors, such as “no pain” and “pain as bad as can be” when measuring pain intensity. The participant then places a perpendicular line at the point that best describes their pain. A ruler is then used to indicate the score.
Ten studies were included that assessed the psychometric properties of the Visual Analogue Scale (details of study and participant characteristics are provided in Supplemental Content, Table 4).34,41,42,45,51,57,60–62,67 One study did not specify whether the VAS was used to assess pain severity or interference.57 In the other 9 studies, pain intensity was assessed.
Patients were asked to rate pain during the week after physical activity in one study.60 One study asked patients to rate their pain in the last week.45 A third study required patients to keep a VAS log of their pain for 14 days.67 Another study asked participants to rate their pain level on the previous day.51 One study asked patients to rate their change in pain from baseline (3 month study period)34 while another asked patients to rate pain prior to surgery and at 2-year follow-up.41 One study asked patients to rate pain before and after performing grip exercises.42 One study assessed present pain.61 Two studies did not specify a timeframe.57,62
Western Ontario and McMaster Universities Osteoarthritis Index (WOMAC)
The WOMAC was developed in 1982 for assessing pain severity and function in individuals with knee and hip pain associated with osteoarthritis.25 Another domain, stiffness, is not addressed in this review. The index includes 24 items and can be self-administered or completed by interview. Different response formats have been used including a 5-point Likert scale, 11-point numerical rating scale, and a 100-mm visual analog scale.
We included 5 studies of the WOMAC (details of study and participant characteristics are provided in Supplemental Content, Table 4).31,46,50,60,64 One study assessed pain severity46 while 4 studies used the WOMAC to assess both pain and function.
In all studies, the WOMAC was self-administered. One used a postal survey.50 Two studies specified that participants were asked to recall pain over the past 48 hours.31,46 The others did not specify a timeframe.
Wong Faces Scale/Wong-Baker Faces Scale
Wong Faces Scale (also known as Wong-Baker Faces Scale) is an interview-administered, 6-point Likert-type scale ranging from 0 to 5 with corresponding faces.26 Higher numbers represent greater pain. It was originally developed in 1985 to assess general pain intensity among children.26
We included one study that measured the psychometric properties of the Wong-Baker Faces Scale (details of study and participant characteristics are provided in Supplemental Content, Table 4).51
Outcomes
Table 3 provides an overview of included pain measures and studies reporting each outcome. Of the measures that include assessment of both pain severity and pain interference, we found the greatest reporting of psychometric properties for the BPI, GCPS, MPI/WHYMPI, PEG, SF-36 BPS, and WOMAC. Of the measures that primarily assessed pain severity, we found the greatest reporting of psychometric properties for the NRS and VAS followed by the MPQ. Of the measures of pain interference, we found the greatest reporting of psychometric properties for the ODI, PROMIS-PI, and RMDQ. There was little or no reporting of psychometric properties for the DVPRS, HOOS, KOOS, PGIC, or Wong Faces Scale. Detailed psychometric data are reported in Supplemental Content, Table 5 and summarized below.
Table 3
Summary of Results: Studies Assessing Psychometric Properties of Self-Report Measures of Pain Severity (S) and Functional Interference (I) in Chronic Musculoskeletal Pain Populations.
Minimally Important Difference
We identified 8 studies that estimated MIDs of 8 separate pain measures: BPI, GCPS, NRS, ODI, PEG, RMSQ, SF-36 BPS, and VAS (Table 3, Supplemental Content, Tables 5 and 6).33,37,41,52,58,63,66,67 Six of the 8 measures assess pain intensity and interference/function (BPI, GCPS, PEG, SF-36 BPS, ODI, VAS), one (RMDQ) interference/function, and one (NRS) focused on intensity. Several methods for estimating MIDs were reported, including both distribution-based and anchor-based approaches. Distribution-based methods involve estimation of MID based on the distribution of the observed scores. Anchor-based methods use an external indicator (eg, patient rating of change) to put patients into positive change, no change, and negative change groups.70 For each pain measure, MID estimates differed considerably depending on the estimation method used, the type of pain being studied, and the interval between evaluations. We broadly describe this outcome as minimally important difference, but note where studies describe the outcome differently.
Three studies calculated MID values for more than one pain measure.37,41,63 One US study (n=427) estimated minimal clinically important change (MCIC) for BPI, GCPS (labeled the Chronic Pain Grade [CPG] in this study), PEG, RMDQ, and SF-36 BPS over 12 months.37 A distribution-based standard error of measurement (SEM) was used to estimate MCIC. The SEM was then used to categorize patients as better, the same, or worse for each measure. “Better” indicated that the score improved at least one SEM from baseline and “worse” indicated that the score worsened at least one SEM from baseline. Kappa statistics for agreement between one-SEM and an anchor of patient’s global rating classifications were fair. The measures with the best agreement were the BPI (Kappas = 0.29 and 0.34 for trial and cohort data, respectively), the GCPS intensity (Kappas = 0.35 and 0.27), and the PEG (Kappas = 0.33 and 0.23).
Another retrospective cohort study from the US estimated minimum clinically important differences (MCID) based on 4 anchor-based approaches for 47 participants undergoing surgical treatment for pseudoarthrosis-related back pain.41 MCIDs were calculated for the ODI and VAS 2 years postoperatively. The anchors were 1) patient rated global assessment with choices of ‘‘worse,’’ ‘‘unchanged,” ‘‘slightly better,” or ‘‘markedly better’’ and 2) patient rating of satisfaction with the results of their surgery (yes indicating responders, no indicating nonresponders). The 4 MCID approaches included 1) average change (average change score seen in the group defined to be responders); 2) minimum detectable change (MDC) (equal to the upper value of the 95% confidence interval for average change score seen in the cohort defined to be non-responders); 3) change difference (difference of the average change score for responders and non-responders); and 4) ROC approach (the change value that provides the greatest sensitivity and/or specificity for a positive response). For the ODI, the calculated MCIDs differed by the approach used and ranged from 2.0 points for MDC up to 8.3 points for change difference. Fewer differences were seen for the VAS, where MCIDs ranged from 2.0 to 3.2 points.
One small study from the UK (n=48) estimated MCID for the ODI, NRS, and RMDQ after a 5-week class of exercise and education among patients with low back pain.63 The PGIC was used to categorize patients into groups of “improved,” “unchanged,” and “deteriorated.” An anchor-based ROC approach estimated the MCID was 4 points for the NRS and RMDQ and 8 points for the ODI.
Test-retest Reliability
Test-retest reliability, the extent to which a measure achieves the same result on 2 or more occasions when the condition is stable, was reported in 10 studies (Table 3, Supplemental Content, Table 5).17,30,33,42,48,50–52,61,62 Several studies reported test-retest reliability for multiple pain measures. However, measure and timeframe comparisons differed across studies, making comparative evaluation of test-retest reliability difficult.
Test-retest reliabilities, assessed with Pearson correlations or intraclass correlations, were 0.90 or higher in many studies.33,42,50,51 Pain measures evaluated in these studies included the Faces Scale, VAS, NRS, ODI, and WOMAC. There were few reports of test-retest reliabilities less than 0.80. One study evaluated test-retest reliability of the RMDQ (ICC=0.68) with approximately 3 months between assessments in patients who reported no change in work status.52 Another study reported test-retest using the PROMIS-PI at baseline and 3 months apart (ICC=0.58).30
Inter-rater Reliability
None of the included studies reported inter-rater reliability (ie, agreement between raters).
Internal Consistency
The extent to which items in a measure are correlated and thus can be said to be measuring the same construct (ie, internal consistency) was reported in 8 studies.17,20,36,39,40,50,53,59 In 7 studies, Cronbach’s alpha was calculated; one calculated Spearman correlation coefficients.53
In studies reporting Cronbach’s alpha, results were generally greater than 0.70, indicating good to excellent internal consistency. Pain measures evaluated include the BPI, GCPS, MPQ, ODI, PEG, PROMIS-PI, RMDQ, SF-36 BPS, WHYMPI, and WOMAC. In the study reporting Spearman correlation coefficients between elements of the BPI, values ranged from 0.38 to 0.84.53
Concurrent and/or Criterion Validity
Concurrent validity is a measure of the extent to which scores on one measure relate to another measuring the same or a similar construct, while criterion validity measures a measure’s correspondence to a gold standard or another measure. Nineteen studies reported concurrent/criterion validity.17,20,29,31,33,36,39,42–44,47,49,50,54,57–59,61,64 Pain measures assessed for concurrent/criterion validity include the BPI, CGPS, HOOS, MPQ, NRS, ODI, PEG, PROMISPI, RMDQ, SF-36 BPS, VAS, WHYMPI/MPI, and WOMAC. Table 3 provides an overview of studies reporting this outcome; more details are presented in Supplemental Content, Table 5.
Reported correlations indicate fair to excellent concurrent and criterion validity across pain measures. Four studies provided results from multiple comparisons.20,31,36,47 Krebs et al reported correlations between the PEG and other measures ranging from 0.60 (RMDQ) to 0.89 (BPI Interference component) with similar values for correlations of the BPI Severity and BPI Interference components with other measures.20 Wittink et al computed R2 values; values above 0.4 were considered high overlap between measures.47 Observed R2 values ranged from 0.37 to 0.58 among the MPI pain severity and interference components, the ODI, and the SF-36 BPS. Correlations between the PROMIS-PI and the SF-36 BPS (−0.73) and the WOMAC pain subscale (0.47) were reported in one study.31 Keller et al reported correlations between the BPI, SF-36 BPS, RMDQ, and GCPS, with values ranging from 0.47 to 0.81.36
One study reported intercorrelations (Kendall’s tau) between components of the ODI and behavioral assessments of the components.59 The correlation of the ODI Lifting Subscale with observed lifting was −0.38. The correlation of the ODI Walking Subscale with observed walking was −0.54. The correlation of the ODI Sitting Subscale with observed sitting was −0.40.
Two studies assessed correlations between different versions of the RMDQ.29,43 In one study, Computer Adaptive Test versions with 5, 7, 9, and 11 items were evaluated with respect to a 23-item version of the RMDQ. The correlations were 0.93, 0.95, 0.97, and 0.98 for the 5-, 7-, 9-, and 11-item versions, respectively.29 In the other study intercorrelations were reported for the 24-, 18-, and 11-item versions, with all values greater than 0.95.43
Discriminant Validity
Discriminant validity is the ability of a measure to discriminate between groups. Four studies reported discriminant validity (Table 3, Supplemental Content, Table 5).30,33,38,39 One study evaluated the ability of the MPQ Short Form to discriminate between number of pain diagnoses and between none/mild, moderate, and severe pain as determined with the MPI Pain Severity component.39 No significant difference in total MPQ Short Form score was observed between study participants with one or with 2-3 pain diagnoses. However, scores were significantly higher in the group with 4 or more diagnoses. MPQ Short Form scores were significantly different across the 3 pain severity levels.
Krebs et al evaluated the accuracy of the NRS for predicting level of pain that interferes with function (defined in the study as BPI of 5 or higher) and level of pain that motivates a physician visit.38 For both outcomes, the area under the ROC curve was 0.75-0.78 (indicating “fair” accuracy) and NRS scores of 4 and above increase the probability of interference with function or a physician visit as indicated by likelihood ratios substantially greater than 1.0.
A third study reported that ODI scores differed significantly (P<.001) between groups with and without 1) high pain severity and high functional limitations and 2) chronic pain and high functional limitation.33 Another study reported that PROMIS-PI scores differed significantly (P<.001) between those seeking worker’s compensation or not and those who had a fall in the past 3 months or not.30
Responsiveness
We identified 22 studies that reported responsiveness, the ability of a measure to detect change in an outcome over time, in 14 of the 17 pain measures of interest. Details of study and population characteristics are provided in Table 3, Supplemental Content, Tables 5 and 7.20,27,28,30,32,35–37,42,44,46–48,52,53,55–57,60,63–65
Two common approaches to estimating responsiveness are external and internal. Internal responsiveness reflects the ability of a measure to change over a pre-specified time interval. External responsiveness relies on an anchor or external standard which is considered independent of the pain measure (eg, patient global rating of change) to assess the agreement between change in the measure and change in the external standard. Responsiveness was calculated by a variety of metrics across studies including standardized response means (SRM) and standardized effect sizes (SES). The SRM is an effect size measure of within-group change and is calculated by taking the change of scores from time 1 to time 2 divided by the standard deviation of the change score. The studies also reported standardized effect sizes (SES), an effect size measure of between-group change which is calculated by taking the change-score means of 2 independent groups divided by the pooled the standard deviation of change. Magnitude of effect for SRM and SES are interpreted by the guidelines suggested by Cohen (0.2 is considered a small and 0.8 or greater is a large).71 Area under the curve (AUC) values estimated from ROC analyses were used by several studies to also assess probability of correctly measuring discrimination between patients who improved and those who did not. A value of 0.5 can be interpreted to be the same as chance and a value of 1.0 indicates perfect discrimination. Thirteen studies estimated external (“anchored”) responsiveness.20,28,30,32,35–37,52,53,55–57,63
Comparative Studies
Six studies compared external responsiveness across multiple pain measures (Supplemental Content, Table 7).35–38,56,63 Studies that determined responsiveness based on AUC values are summarized on Table 4. The remaining 2 studies calculated SRMs for responsiveness for the BPI,20,36 PEG,20 GCPS,36 and SF-36 BPS.36
Table 4
Comparative External Responsiveness based on (AUC) Values for Detecting Any Improvement.
Seven studies reported internal responsiveness for multiple pain measures (Supplemental Content, Tables 5 and 7).42,46–48,60,64 Measures evaluated included the HOOS,64 MPI,47 MPQ,48 NRS,46 ODI,47,48 SF-36 BPS,47 VAS,60 and WOMAC.46,60,64
Measure-specific
Eleven studies reported responsiveness for one pain measure only (Supplemental Content, Tables 5 and 7).27,28,30,32,44,52,53,55,57,60,65 Responsiveness varied within the individual measures, the populations, time intervals, and methods used to calculate. Pain measures included the BPI,44,53 NRS,32 ODI,27,57 PGIC,65 PROMIS-PI,28,30 and RMDQ.52,55
Feasibility
Number of Items
Among the 17 pain measures reviewed, the number of items used to assess pain ranged from 1 (NRS, PGIC, VAS, Wong-Baker Faces Scale) to 78 (MPQ). The 4 single-item measures assessed different dimensions of pain including pain intensity (Faces), pain intensity and/or interference (NRS and VAS), and changes in pain (PGIC). The phrasing of questions used to elicit pain scores was not consistent across the studies included in this review, and therefore in some cases it was not clear if multiple dimensions of pain were being assessed. These single-item measures also varied in how they were administered, as both the VAS and Faces involve visual cues.
Other low-item measures include the SF-36 BPS (2 items), the PEG (3 items), the DVPRS (5 items), and the GCPS (7 items). While still brief, these measures have the advantage of measuring both pain intensity and pain interference related to function. Mid-item measures include the ODI (10 items), the BPI (17 items), the WOMAC (24 items), and the RMDQ (24 items). The ODI includes one item related to pain severity (need for analgesic medications) and the RMDQ specifically measures disability related to pain.
The pain measures with the most items are the HOOS (40 items), KOOS (42 items), PROMIS-PI (41 items), MPI (52 items), and MPQ (78 items). Though lengthy, the HOOS and KOOS are the only measures that directly assess pain of the hip and knee, respectively. The PROMIS-PI is specific to pain interference in physical functioning and has 4 short form versions that are commonly used. The MPI queries pain intensity and interference in multiple domains, including social and family functioning. The highest-item measure, the MPQ, presents the patient with a list of adjectives from which to select descriptors for their subjective pain experience rather than asking them to answer questions on a Likert-type scale. In determining which measure provides sufficient items for a given research study, the intended use of the measure and the research setting will largely determine the appropriate choice.
Mode of Administration
Desired mode of administration may also inform the appropriate choice of pain measure for research. Many of the pain measures can be self-administered or administered by an interviewer. Measures such as the KOOS and HOOS have been administered through the mail, while computer-based surveys have also been developed for the WOMAC, SF-36 BPS, PROMIS-PI, ODI, NRS, MPI, and HOOS. Four measures have been assessed for telephone administration, including the WOMAC, SF-36 BPS, ODI, and NRS.
Availability
Pain measures readily available without restrictions on use include the DVPRS, GCPS, HOOS, KOOS, NRS, PGIC, PEG, RMDQ, and VAS. The MPI and MPQ can be obtained freely and directly from the developer. Free use of the ODI is permitted for non-funded academic research and individual clinical practice. Additionally, the PROMIS-PI is freely available after registering with an assessment center and endorsing terms and conditions. Measures that require purchase or permission to use are the BPI, SF-36 BPS, Wong-Baker Faces Scale, and WOMAC.
Summary and Discussion
Key Messages
- Among 17 multi-item pain measures assessed, the most complete evidence on psychometric properties in chronic musculoskeletal pain populations was found for the ODI, RMDQ, and SF-36 BPS. Several key psychometric properties were available for the BPI, GCPS, MPI/WHYMPI, MPQ, PEG, PROMIS-PI, and WOMAC. Most of these measures include both pain severity/intensity and functional impairment.
- Of the measures focused primarily on pain severity, we found the greatest reporting of psychometric properties for the NRS and VAS, followed by the MPQ.
- Of the measures of pain interference, we found the greatest reporting of psychometric properties for the ODI, PROMIS-PI, and RMDQ.
- MID assessment methods differed and were often based on statistical rather than patient-noticeable differences.
- Reliability, internal consistency, concurrent or criterion validity, discriminate validity, and responsiveness differed widely but generally were in the fair to excellent range.
- Feasibility, measured by number of items, delivery mode, and public availability differed widely. The choice of measure may depend on population/condition of interest, research questions and settings, and resources available.
- Our review supplements earlier IMMPACT guidance on core outcome measures by providing recent findings on psychometric properties of measures specifically targeted for chronic musculoskeletal pain, using English language versions of measures, and including recently developed measures of pain severity and/or pain interference.
- Primary psychometric research on key measures in chronic musculoskeletal pain populations was limited overall. Future research should use consistent chronic musculoskeletal pain definitions, standardized psychometric outcomes assessment, and comprehensive descriptions of patient populations.
- Findings from this review can inform recommendations on specific core outcome measures for clinical research on chronic musculoskeletal pain interventions. Researchers’ final choice of measures should consider population characteristics, pain site and type, recall period of interest and intervention length, analytic goals, and study resources.
Discussion
This rapid evidence review identified published research on psychometric properties of English-language versions of 17 key patient-reported pain outcome measures assessed in chronic musculoskeletal pain populations. The ODI, RMDQ, and SF-36 BPS were the most frequently studied multi-item pain measures and had reported data for all 4 main psychometric outcomes of interest: MID, responsiveness, validity, and test-retest reliability. Each of these measures assesses interference; the SF-36 BPS, and ODI include a question about pain severity but no study reported separate outcomes for severity and interference. The BPI, GCPS, and PEG had data on MID, responsiveness, and validity. Each of these measures assess both pain severity and interference with all but one study reporting separate results for the 2 subscales of the BPI and GCPS; severity and interference are combined in the PEG. MPI/WHYMPI, MPQ, PROMIS-PI; and WOMAC had data on responsiveness, validity, and test-retest reliability. The MPQ is a measure of pain severity and the PROMIS-PI is a measure of pain interference. The MPI/WHYMPI and WOMAC include severity and interference subscales. All but one study reported separate results for those subscales.
Findings from our review supplement the work of IMMPACT4 and IMMPACT/OMERACT.6 The 2005 IMMPACT guidance on core outcome measures for chronic pain clinical trials was based on studies of any chronic pain, including cancer, dental, and neuropathic pain. The literature reviews to support the guidance included studies published through early 2003.4 The 2016 IMMPACT/OMERACT guidance on assessment of physical function and participation in chronic pain clinical trials identified patient-reported outcome measures of physical functioning, including 8 addressed in our review, but did not perform detailed assessments of the measures and did not make recommendations for use of specific measures.6
While IMMPACT provides recommendations for measures that can be used to assess pain severity and/or pain interference across a broad range of pain types,4 there have since been many new studies in the area of chronic musculoskeletal pain. Of 43 studies included in our review, 38 were published from 2003 to January 2017. In addition, new pain measures have been developed, notably the DVPRS, PEG, and PROMIS-PI. Therefore, our report provides updated information and a broader look at psychometric properties of measures for assessment of both pain severity and pain interference for chronic musculoskeletal pain.
Further, our findings are consistent with pain outcome measurement reviews focused on specific pain-related diagnoses or pain measures. Three reviews focused on patient-reported health outcome measures for LBP found the ODI and RMDQ to be the most comprehensively studied both for responsiveness72 and for other psychometric properties.73,74 There were few data on psychometric properties of pain severity measures (ie, NRS, VAS, BPI, MPQ) commonly used in RCTs of interventions for LBP.73 Another review of back-specific functional status questionnaires for LBP found the ODI and RMDQ to have been most frequently studied, with good measurement properties in their original forms as retested in multiple settings.75 A review of studies that had evaluation of psychometric properties as a main purpose found 2 of our measures of interest, the HOOS and WOMAC, to be adequately assessed for use in patients with hip and groin disability.76 A review of 6 studies that used the KOOS to evaluate patients undergoing total knee arthroplasty found acceptable psychometric properties.77 None of the studies included in that review were eligible for our review due to language of publication, use of a non-English language version of the KOOS, or inadequate definition of pain duration. A review of 76 studies assessing the measurement properties of the WOMAC, predominantly in patients with hip and/or knee osteoarthritis, found acceptable reliability.78 Few studies assessed responsiveness and MID was not an outcome of interest for that review.
For purposes of measure selection, psychometric properties must be considered alongside conceptual and practical concerns.79 The ODI and RMDQ were developed for and most often tested in low back pain, and the WOMAC was developed for and most often tested in knee and hip pain. The BPI, GCPS, MPI/WHYMPI, MPQ, PEG, PROMIS-PI, and SF-36 BPS were designed to assess more broadly defined pain, and were tested in populations with varying chronic pain-related diagnoses. Most of these measures assess severity and functional impairment; exceptions are the MPQ (severity only) and the RMDQ and PROMIS-PI (interference only). Researchers’ choice of measures should include their research goals, such as pain site, pain type, recall period of interest and length of intervention (with respect to measure responsiveness data), analytic goals (with respect to measure range and scale), and study resources (with respect to measure feasibility, including available time and mode of administration).
Versions of the NRS and the VAS were also frequently studied with respect to the 4 key psychometric outcomes of interest. However, NRS and VAS are single-item response measures, and the associated questions to which study participants responded varied with respect to phrasing, recall periods, and score ranges. For the NRS and VAS, our evidence review was thus less a review of psychometric research on 2 clearly defined pain measures and more a cataloging of multiple single-item numeric rating-based or visual analog scale-based approaches to assessing primarily pain severity.
Challenges in Assessment of Psychometric Properties
Minimally Important Different (MID)
The range of assessment methods reflects variation in current MID-related research (Supplemental Content, Table 6). Assessments of minimum clinically important difference (MCID) for a patient-reported outcome measure should ideally involve anchoring the measure to an indicator of meaningful patient-reported change in a clinical outcome.70,80,81 While some MID estimates reported here constitute MCIDs anchored to patient-reported clinical improvement via adaptations of the Patient Global Impression of Change (PGIC),37,41,58,63,66 others are purely estimates of statistical minimum detectable change (MDC) based on study population distribution characteristics33,52,67 without reference to clinical import of that change. Comparing anchor-based MCID findings with distribution-based MDC findings can be useful in MID estimation, as this allows researchers to consider both an external benchmark of clinical change and a measure of change detectable despite variation.58,70,80 Reviewed studies, however, contained relatively few estimates via any method, precluding comparison and generalization of measure-specific MIDs. MIDs for patient-reported measures are likely to vary based on the constructs assessed by each measure, as well as by patient population, study design, and baseline measure value. It is possible that widespread application of a 30% change from baseline as an MID, originally assessed using an NRS for pain severity19 and ultimately recommended for a range of patient-reported pain outcome measures,82 has discouraged measure-specific MID development. Further research could explore whether the broadly adopted figure of a 30% change from baseline is empirically generalizable across patient-reported outcome measures in chronic musculoskeletal pain studies and populations. Consensus is needed on optimal approaches to developing and reporting MID for patient-reported measures in chronic musculoskeletal pain.
Validity
There is no gold standard comparator for assessment of pain measure validity in the domains assessed. Most included studies’ methods of assessing concurrent/criterion validity involved finding correlations between a measure of interest and another measure or subscale of interest. Perhaps unsurprisingly, therefore, our review identified a self-referential network of patient-reported outcome measures validated against one another. Other assessments arguably relevant to construct validity, such as relationships of self-reported pain-related functioning measures to objective physical performance measures, were less commonly identified, consistent with the state of current physical function research in pain.6 Estimates of measure validity are difficult to compare within or across measures in this review. Future research could further investigate the network of validity comparisons between measures of interest, to clarify underlying assumptions that support the validity of these measures and to identify gaps requiring conceptual research.
Responsiveness
Responsiveness findings in reviewed studies are challenging to compare both within and across measures (Supplemental Content, Table 7). Some methods of comparing pain measure changes within clinical trials of pain interventions cannot separate the effectiveness of a pain intervention from the responsiveness of the pain measure used to assess it. Few methods recognize the inherent challenge that short-term fluctuations in pain, which commonly occur in chronic musculoskeletal pain conditions, pose to the capacity of pre-post assessments to track pain trajectory over time. Further, included pain measures have a wide range of recall periods (from 24 hours for the RMDQ to 4 weeks for the SF-36 BPS), and reviewed studies have a range of time periods between assessment points. Clinical researchers interested in comparing measures’ responsiveness should consider available psychometric evidence in the context of their own work, including the recall period of interest, the expected amount and timeframe of change in the pain domains they plan to assess, and their desired study design (eg, pre-post assessment vs longitudinal repeated-measures assessment).
Test-retest Reliability
Interpreting test-retest reliability estimates has conceptual challenges similar to those of responsiveness: it can be difficult to separate undesirable variability in a measure from variability that reflects actual fluctuations in subjective pain constructs, and can thus be difficult to determine the optimal test-retest reliability interval for a given measure. A short-term fluctuation in a measure may not indicate a lack of test/retest reliability, and may in fact be evidence of responsiveness to true changes in pain course. As with responsiveness, we recommend that researchers interested in specific measures’ reliability consider reliability-related timeframes and design features in the context of their own work.
Limitations and Future Research
Limitations of a Rapid Evidence Review
Rapid evidence review development requires streamlining the scope of literature search and eligibility criteria, and language and date restrictions are among current best practice recommendations.83–85 Our review was limited to studies that assessed measures or published results in English. However, this decision was also influenced and supported by evidence on the limited generalizability of self-report measures’ psychometric properties derived in languages other than that of the intended population,86,87 and highlights the need for linguistic and cultural validation of pain measures. With respect to search strategy, our primary abstract search was limited to dates from 2000 onward. We complemented this, however, by hand-searching reference lists of included studies and relevant reviews, searching websites of each specific pain measure, and by querying experts for supplementary suggestions. We included identified eligible articles regardless of date, though we acknowledge that we may have missed a relevant publication. Our criteria may have excluded some studies of psychometric properties of measures developed and validated prior to the popularization of specifying chronicity and duration of pain. Researchers considering such pain measures will need to consider the relevance of past psychometric work in the context of current conceptual pain research, and of their planned studies’ objectives and target populations. We excluded studies that enrolled patients with chronic musculoskeletal conditions commonly associated with pain but did not specify that enrolled patients had chronic pain (eg, radiologically defined osteoarthritis). In addition to a decision based on scope we believe this is justifiable scientifically as it is not clear if individuals in these studies had chronic pain, and some of these studies specifically noted that patients either did not have pain or had acute or subacute pain. We also excluded trials of interventions for pain that did not note assessment of psychometric properties in the abstract. Our focus was on primary psychometric research on the pain measures of interest, and accordingly our search required psychometric properties to be mentioned in the abstract. It is possible that this search approach did not identify some psychometric assessments embedded in studies that used the measures of interest as primary clinical outcomes. However, we believe it is unlikely that this decision excluded a large body of relevant information and took steps to address this concern within the scope of a rapid review. For example, our search of included studies from other similar evidence reviews and query of specific measures websites failed to identify trials that did not describe psychometric properties in the abstract.
Chronic Musculoskeletal Pain Definition and Reporting
Chronic musculoskeletal pain definition and reporting differed widely across reviewed studies. The required duration for pain to be considered “chronic” was inconsistent, and was not always reported. Pain type (eg, musculoskeletal), primary diagnostic cause (eg, osteoarthritis), and primary bodily site(s) (eg, low back) were inconsistently reported. In some studies, pain-related diagnoses or bodily pain sites were reported without reference to the existence of pain duration or chronicity (eg, radiologically defined osteoarthritis); these studies did not meet inclusion criteria for this review. We also found inconsistent reporting of pain-relevant participant characteristics such as pain duration at baseline, baseline level of relevant pain domains, current use of pharmacological and/or non-pharmacological treatments, and co-existing physical or mental health conditions. Such differences in chronic musculoskeletal pain definition and reporting reflect active discussion in current pain research: when and how duration affects key pain qualities, when and how causal diagnoses and bodily site affect key pain qualities, and when and how intermittent pain differs meaningfully from chronic continuous pain.10,88 These conceptual uncertainties underlie the wide range of approaches to defining target populations for pain studies. Research is needed to define target populations for psychometric research on measures for use in chronic musculoskeletal pain, as well as standards for reporting of pain duration, relevant diagnoses, and bodily sites. Additional work is needed to define target populations for psychometric research on measures for use in chronic musculoskeletal pain, as well as standards for reporting of chronic musculoskeletal pain duration, relevant diagnoses, and pain sites.
Study Populations
Most studies were conducted in populations with over 50% women and mean ages 40-59. Most studies did not report race or ethnicity; of those that did, all included more than 50% white participants, and most included more than 75% white participants. No studies reported outcomes stratified by sex or gender, age range, or race/ethnicity. Generalizability of psychometric findings is thus limited by both demographic underreporting and population homogeneity. Given substantial evidence of the influence of age and psychosocial factors on individuals’ experiences and reporting of both pain-related functional impairment and pain severity,87,89–91 there is a need for consensus on key study population demographic and clinical characteristics, more consistent reporting of these population characteristics within studies, and further research on how measures’ psychometric properties generalize or change across age ranges and psychosocial categories.
Applicability to VHA Research
Our findings are highly applicable to research on chronic musculoskeletal pain in the VA population. Four studies enrolled only Veterans17,35,39,44 and 2 included Veterans.20,37 These studies evaluated psychometric properties of several of the pain measures that overall had substantial evidence, including the BPI, MPI/WHYMPI, MPQ, PEG, PROMIS-PI, RMDQ, and SF-36 BPS.
The chronic musculoskeletal pain conditions are representative of conditions seen in a Veteran population, with measurement of back, knee, and hip pain most common. Mean ages of study participants ranged from 32 to 80 years. However, studies, other than those of Veterans, included a large percentage of women and studies reporting race/ethnicity, most from the US, enrolled a high percentage of white individuals. Additional methods work is needed in broader populations and for more consistent and complete demographic reporting.
Conclusions
Among multi-item pain measures assessed, the most complete evidence on psychometric properties of interest within chronic musculoskeletal pain populations was found for the ODI, RMDQ and SF-36 BPS, while several additional measures (BPI, GCPS, MPI/WHYMPI, MPQ, PEG, PROMIS-PI, and WOMAC) also had evidence for several of the key psychometric properties. Most of these measures include both pain severity/intensity and functional impairment. In addition to evidence on psychometric properties, choice of pain outcome measures for a specific research study must consider both conceptual elements (eg, pain domains of interest, pain sites and diagnoses, time course, and population characteristics) and practical concerns (eg, burden to complete, mode of assessment, cost). Limitations of current chronic musculoskeletal pain measurement research relate to variations in (1) definition and reporting of chronic musculoskeletal pain and pain-related diagnoses, (2) methods of assessing psychometric outcomes, and (3) reporting on demographics of patient populations. Findings from this review can inform recommendations on specific core outcome measures for clinical research on chronic musculoskeletal pain interventions. Further methods research is needed to validate patient-reported pain outcome measures in populations with chronic musculoskeletal pain and develop a framework for determining outcome measurement selection that incorporates feasibility and applicability.
References
- 1.
- Butchart A, Kerr EA, Heisler M, Piette JD, Krein SL. Experience and management of chronic pain among patients with other complex chronic conditions. Clin J Pain. 2009;25(4):293–298. [PMC free article: PMC2709743] [PubMed: 19590477]
- 2.
- Gereau RWt, Sluka KA, Maixner W, et al A pain research agenda for the 21st century. J Pain. 2014;15(12):1203–1214. [PMC free article: PMC4664454] [PubMed: 25419990]
- 3.
- Department of Health and Human Services. National pain strategy: a comprehensive population health-level strategy for pain. 2015. Available at: https://iprcc
.nih.gov /docs/HHSNational_Pain_Strategy.pdf. Accessed 1 August 2017. - 4.
- Dworkin RH, Turk DC, Farrar JT, et al Core outcome measures for chronic pain clinical trials: IMMPACT recommendations. Pain. 2005;113(1-2):9–19. [PubMed: 15621359]
- 5.
- Dworkin RH, Turk DC, McDermott MP, et al Interpreting the clinical importance of group differences in chronic pain clinical trials: IMMPACT recommendations. Pain. 2009;146(3):238–244. [PubMed: 19836888]
- 6.
- Taylor AM, Phillips K, Patel KV, et al Assessment of physical function and participation in chronic pain clinical trials: IMMPACT/OMERACT recommendations. Pain. 2016;157(9):1836–1850. [PMC free article: PMC7453823] [PubMed: 27058676]
- 7.
- Turk DC, Dworkin RH, Burke LB, et al Developing patient-reported outcome measures for pain clinical trials: IMMPACT recommendations. Pain. 2006;125(3):208–215. [PubMed: 17069973]
- 8.
- Turk DC, Dworkin RH, McDermott MP, et al Analyzing multiple endpoints in clinical trials of pain treatments: IMMPACT recommendations. Initiative on Methods, Measurement, and Pain Assessment in Clinical Trials. Pain. 2008;139(3):485–493. [PubMed: 18706763]
- 9.
- Turk DC, Dworkin RH, Revicki D, et al Identifying important outcome domains for chronic pain clinical trials: an IMMPACT survey of people with pain. Pain. 2008;137(2):276–285. [PubMed: 17937976]
- 10.
- Younger J, McCue R, Mackey S. Pain outcomes: a brief review of instruments and techniques. Curr Pain Headache Rep. 2009;13(1):39–43. [PMC free article: PMC2891384] [PubMed: 19126370]
- 11.
- Cleeland CS, Ryan KM. Pain assessment: global use of the Brief Pain Inventory. Ann Acad Med Singapore. 1994;23(2):129–138. [PubMed: 8080219]
- 12.
- Buckenmaier CC, 3rd, Galloway KT, Polomano RC, McDuffie M, Kwon N, Gallagher RM. Preliminary validation of the Defense and Veterans Pain Rating Scale (DVPRS) in a military population. Pain Med. 2013;14(1):110–123. [PubMed: 23137169]
- 13.
- Von Korff M, Ormel J, Keefe FJ, Dworkin SF. Grading the severity of chronic pain. Pain. 1992;50(2):133–149. [PubMed: 1408309]
- 14.
- Klassbo M, Larsson E, Mannevik E. Hip disability and osteoarthritis outcome score: An extension of the Western Ontario and McMaster Universities Osteoarthritis Index. Scand J Rheumatol. 2003;32:46–51. [PubMed: 12635946]
- 15.
- Roos EM, Lohmander LS. The Knee injury and Osteoarthritis Outcome Score (KOOS): from joint injury to osteoarthritis. Health Qual Life Outcomes. 2003;1:64. [PMC free article: PMC280702] [PubMed: 14613558]
- 16.
- McCaffery M, Beebe A. Pain: Clinical Manural for Nursing Practice. St. Louis, MO: Mosby, 1989.
- 17.
- Kerns RD, Turk DC, Rudy TE. The West Haven-Yale Multidimensional Pain Inventory (WHYMPI). Pain. 1985;23(4):345–356. [PubMed: 4088697]
- 18.
- Smeets R, Koke A, Lin CW, Ferreira M, Demoulin C. Measures of function in low back pain/disorders: Low Back Pain Rating Scale (LBPRS), Oswestry Disability Index (ODI), Progressive Isoinertial Lifting Evaluation (PILE), Quebec Back Pain Disability Scale (QBPDS), and Roland-Morris Disability Questionnaire (RDQ). Arthritis Care Res. 2011;63 Suppl 11:S158–173. [PubMed: 22588742]
- 19.
- Farrar JT, Young JP, Jr., LaMoreaux L, Werth JL, Poole RM. Clinical importance of changes in chronic pain intensity measured on an 11-point numerical pain rating scale. Pain. 2001;94(2):149–158. [PubMed: 11690728]
- 20.
- Krebs EE, Lorenz KA, Bair MJ, et al Development and initial validation of the PEG, a three-item scale assessing pain intensity and interference. J Gen Intern Med. 2009;24(6):733–738. [PMC free article: PMC2686775] [PubMed: 19418100]
- 21.
- Pain Interference: A brief guide to the PROMIS Pain Interference instruments. 2015. Available at: https://www
.assessmentcenter .net/documents /PROMIS%20Pain%20Interference %20Scoring%20Manual.pdf. Accessed 1 August 2017. - 22.
- Roland MO, Morris RW. A study of the natural history of back pain. Part 1: Development of a reliable and sensitive measure of disability in low back pain. Spine. 1983;8:141–144. [PubMed: 6222486]
- 23.
- Ware JE, Jr., Gandek B. Overview of the SF-36 Health Survey and the International Quality of Life Assessment (IQOLA) Project. J Clin Epidemiol. 1998;51(11):903–912. [PubMed: 9817107]
- 24.
- Wewers ME, Lowe NK. A critical review of visual analogue scales in the measurement of clinical phenomena. Res Nurs Health. 1990;13(4):227–236. [PubMed: 2197679]
- 25.
- American College of Rheumatology. Western Ontario and McMaster Universities Osteoarthritis Index (WOMAC). Available at: http://www
.rheumatology .org/I-Am-A/Rheumatologist /Research/Clinician-Researchers /Western-Ontario-McMaster-Universities-Osteoarthritis-Index-WOMAC. Accessed 1 August 2017. - 26.
- Wong-Baker FACES® History. Available at: http:
//wongbakerfaces .org/us/wong-baker-faces-history/. Accessed 1 August 2017. - 27.
- Anagnostis C, Gatchel RJ, Mayer TG. The pain disability questionnaire: a new psychometrically sound measure for chronic musculoskeletal disorders. Spine. 2004;29(20):2290–2302. [PubMed: 15480144]
- 28.
- Askew RL, Cook KF, Revicki DA, Cella D, Amtmann D. Evidence from diverse clinical populations supported clinical validity of PROMIS pain interference and pain behavior. J Clin Epidemiol. 2016;73:103–111. [PMC free article: PMC4957699] [PubMed: 26931296]
- 29.
- Cook KF, Choi SW, Crane PK, Deyo RA, Johnson KL, Amtmann D. Letting the CAT out of the bag: comparing computer adaptive tests and an 11-item short form of the Roland-Morris Disability Questionnaire. Spine. 2008;33(12):1378–1383. [PMC free article: PMC2671199] [PubMed: 18496352]
- 30.
- Deyo RA, Katrina R, Buckley DI, et al Performance of a Patient Reported Outcomes Measurement Information System (PROMIS) Short Form in older adults with chronic musculoskeletal pain. Pain Med. 2016;17(2):314–324. [PMC free article: PMC6281027] [PubMed: 26814279]
- 31.
- Driban JB, Morgan N, Price LL, Cook KF, Wang C. Patient-Reported Outcomes Measurement Information System (PROMIS) instruments among individuals with symptomatic knee osteoarthritis: a cross-sectional study of floor/ceiling effects and construct validity. BMC Musculoskelet Disord. 2015;16:253. [PMC free article: PMC4570513] [PubMed: 26369412]
- 32.
- Godil SS, Parker SL, Zuckerman SL, Mendenhall SK, McGirt MJ. Accurately measuring the quality and effectiveness of cervical spine surgery in registry efforts: determining the most valid and responsive instruments. Spine J. 2015;15(6):1203–1209. [PubMed: 24076442]
- 33.
- Hicks GE, Manal TJ. Psychometric properties of commonly used low back disability questionnaires: are they useful for older adults with low back pain? Pain Med. 2009;10(1):85–94. [PMC free article: PMC5323267] [PubMed: 19222773]
- 34.
- Jensen MP, Schnitzer TJ, Wang H, Smugar SS, Peloso PM, Gammaitoni A. Sensitivity of single-domain versus multiple-domain outcome measures to identify responders in chronic low-back pain: pooled analysis of 2 placebo-controlled trials of etoricoxib. Clin J Pain. 2012;28(1):1–7. [PubMed: 21705875]
- 35.
- Kean J, Monahan PO, Kroenke K, et al Comparative responsiveness of the PROMIS Pain Interference Short Forms, Brief Pain Inventory, PEG, and SF-36 Bodily Pain Subscale. MedCare. 2016;54(4):414–421. [PMC free article: PMC4792763] [PubMed: 26807536]
- 36.
- Keller S, Bann CM, Dodd SL, Schein J, Mendoza TR, Cleeland CS. Validity of the Brief Pain Inventory for use in documenting the outcomes of patients with noncancer pain. Clin J Pain. 2004;20:309–318. [PubMed: 15322437]
- 37.
- Krebs EE, Bair MJ, Damush TM, Tu W, Wu J, Kroenke K. Comparative responsiveness of pain outcome measures among primary care patients with musculoskeletal pain. Med Care. 2010;48(11):1007–1014. [PMC free article: PMC4876043] [PubMed: 20856144]
- 38.
- Krebs EE, Carey TS, Weinberger M. Accuracy of the pain numeric rating scale as a screening test in primary care. J Gen Intern Med. 2007;22(10):1453–1458. [PMC free article: PMC2305860] [PubMed: 17668269]
- 39.
- Lovejoy TI, Turk DC, Morasco BJ. Evaluation of the psychometric properties of the revised short-form McGill Pain Questionnaire. J Pain. 2012;13(12):1250–1257. [PMC free article: PMC3513374] [PubMed: 23182230]
- 40.
- Merriwether EN, Rakel BA, Zimmerman MB, et al Reliability and construct validity of the Patient-Reported Outcomes Measurement Information System (PROMIS) Instruments in women with fibromyalgia. Pain Med. 2016. [PMC free article: PMC6279305] [PubMed: 27561310]
- 41.
- Parker SL, Adogwa O, Mendenhall SK, et al Determination of minimum clinically important difference (MCID) in pain, disability, and quality of life after revision fusion for symptomatic pseudoarthrosis. Spine J. 2012;12(12):1122–1128. [PubMed: 23158968]
- 42.
- Sindhu BS, Shechtman O, Tuckey L. Validity, reliability, and responsiveness of a digital version of the visual analog scale. J Hand Ther. 2011;24(4):356–363; quiz 364. [PubMed: 21820864]
- 43.
- Stroud MW, McKnight PE, Jensen MP. Assessment of self-reported physical activity in patients with chronic pain: development of an abbreviated Roland-Morris disability scale. J Pain. 2004;5(5):257–263. [PubMed: 15219257]
- 44.
- Tan G, Jensen MP, Thornby JI, Shanti BF. Validation of the Brief Pain Inventory for chronic nonmalignant pain. J Pain. 2004;5(2):133–137. [PubMed: 15042521]
- 45.
- Tong HC, Geisser ME, Ignaczak AP. Ability of early response to predict discharge outcomes with physical therapy for chronic low back pain. Pain Pract. 2006;6(3):166–170. [PubMed: 17147593]
- 46.
- Trudeau J, Van Inwegen R, Eaton T, et al Assessment of pain and activity using an electronic pain diary and actigraphy device in a randomized, placebo-controlled crossover trial of celecoxib in osteoarthritis of the knee. Pain Pract. 2015;15(3):247–255. [PubMed: 24494935]
- 47.
- Wittink H, Turk DC, Carr DB, Sukiennik A, Rogers W. Comparison of the redundancy, reliability, and responsiveness to change among SF-36, Oswestry Disability Index, and Multidimensional Pain Inventory. Clini J Pain. 2004;20(3):133–142. [PubMed: 15100588]
- 48.
- Burnham R, Stanford G, Gray L. An assessment of a short composite questionnaire designed for use in an interventional spine pain management setting. PM R. 2012;4(6):413–418; quiz 418. [PubMed: 22732153]
- 49.
- Mikail SF, DuBreuil S, D’eon JL. A Comparative Analysis of Measures Used in the Assessment of Chronic Pain Patients. Psychol Assess. 1993;5(1):117–120.
- 50.
- Pinsker E, Inrig T, Daniels TR, Warmington K, Beaton DE. Reliability and validity of 6 measures of pain, function, and disability for ankle arthroplasty and arthrodesis. Foot Ankle Int. 2015;36(6):617–625. [PubMed: 25652665]
- 51.
- Gallasch CH, Alexandre NM. The measurement of musculoskeletal pain intensity: a comparison of four methods. Rev Gaucha Enfer. 2007;28(2):260–265. [PubMed: 17907648]
- 52.
- Chansirinukor W, Maher CG, Latimer J, Hush J. Comparison of the functional rating index and the 18-item Roland-Morris Disability Questionnaire: responsiveness and reliability. Spine. 2005;30(1):141–145. [PubMed: 15626994]
- 53.
- Chien CW, Bagraith KS, Khan A, Deen M, Strong J. Comparative responsiveness of verbal and numerical rating scales to measure pain intensity in patients with chronic pain. J Pain. 2013;14(12):1653–1662. [PubMed: 24290445]
- 54.
- Kamper SJ, Grootjans SJ, Michaleff ZA, Maher CG, McAuley JH, Sterling M. Measuring pain intensity in patients with neck pain: does it matter how you do it? Pain Pract. 2015;15(2):159–167. [PubMed: 24433369]
- 55.
- Macedo LG, Maher CG, Latimer J, Hancock MJ, Machado LA, McAuley JH. Responsiveness of the 24-, 18- and 11-item versions of the Roland Morris Disability Questionnaire. Eur Spine J. 2011;20(3):458–463. [PMC free article: PMC3048224] [PubMed: 21069545]
- 56.
- Stewart M, Maher CG, Refshauge KM, Bogduk N, Nicholas M. Responsiveness of pain and disability measures for chronic whiplash. Spine. 2007;32(5):580–585. [PubMed: 17334294]
- 57.
- Changulani M, Shaju A. Evaluation of responsiveness of Oswestry low back pain disability index. Arch Orthop Trauma Surg. 2009;129(5):691–694. [PubMed: 18521617]
- 58.
- de Vet HC, Ostelo RW, Terwee CB, et al Minimally important change determined by a visual method integrating an anchor-based and a distribution-based approach. Qual Life Res. 2007;16(1):131–142. [PMC free article: PMC2778628] [PubMed: 17033901]
- 59.
- Fisher K, Johnston M. Validation of the Oswestry Low Back Pain Disability Questionnaire, its sensitivity as a measure of change following treatment and its relationship with other aspects of the chronic pain experience. Physiother Theory Pract. 1997;13:67–80.
- 60.
- Gentelle-Bonnassies S, Le Claire P, Mezieres M, Ayral X, Dougados M. Comparison of the responsiveness of symptomatic outcome measures in knee osteoarthritis. Arthritis Care Res. 2000;13(5):280–285. [PubMed: 14635296]
- 61.
- Gronblad M, Hupli M, Wennerstrand P, et al Intercorrelation and test-retest reliability of the Pain Disability Index (PDI) and the Oswestry Disability Questionnaire (ODQ) and their correlation with pain intensity in low back pain patients. Clin J Pain. 1993;9:189–195. [PubMed: 8219519]
- 62.
- Lund I, Lundeberg T, Sandberg L, Budh CN, Kowalski J, Svensson E. Lack of interchangeability between visual analogue and verbal rating pain scales: a cross sectional description of pain etiology groups. BMC Med Res Methodol. 2005;5:31. [PMC free article: PMC1274324] [PubMed: 16202149]
- 63.
- Maughan EF, Lewis JS. Outcome measures in chronic low back pain. Eur Spine J. 2010;19:1484–1494. [PMC free article: PMC2989277] [PubMed: 20397032]
- 64.
- Nilsdotter AK, Lohmander LS, Klassbo M, Roos EM. Hip disability and osteoarthritis outcome score (HOOS)--validity and responsiveness in total hip replacement. BMC Musculoskelet Disord. 2003;4:10. [PMC free article: PMC161815] [PubMed: 12777182]
- 65.
- Scott W, McCracken LM. Patients’ impression of change following treatment for chronic pain: global, specific, a single dimension, or many? J Pain. 2015;16(6):518–526. [PubMed: 25746196]
- 66.
- van der Roer N, Ostelo RW, Bekkering GE, van Tulder MW, de Vet HC. Minimal clinically important change for pain intensity, functional status, and general health status in patients with nonspecific low back pain. Spine. 2006;31(5):578–582. [PubMed: 16508555]
- 67.
- van Grootel RJ, van der Bilt A, van der Glas HW. Long-term reliable change of pain scores in individual myogenous TMD patients. Eur J Pain. 2007;11(6):635–643. [PubMed: 17118682]
- 68.
- Polomano RC, Galloway KT, Kent ML, et al Psychometric testing of the defense and veterans pain rating scale (DVPRS): a new pain scale for military population. Pain Med. 2016;17:1505–1519. [PubMed: 27272528]
- 69.
- Ornetti P, Parratte S, Gossec L, et al Cross-cultural adaptation and validation of the French version of the Knee injury and Osteoarthritis Outcome Score (KOOS) in knee osteoarthritis patients. Osteoarthritis Cartilage. 2008;16:423–428. [PubMed: 17905602]
- 70.
- Revicki D, Hays RD, Cella D, Sloan J. Recommended methods for determining responsiveness and minimally important differences for patient-reported outcomes. J Clin Epidemiol. 2008;61(2):102–109. [PubMed: 18177782]
- 71.
- Cohen J. Statistical power analysis for the behavioral sciences (2nd ed.). Hillsdale, NJ: Lawrence Erlbaum Associates; 1988.
- 72.
- Cleland J, Gillani R, Bienen EJ, Sadosky A. Assessing dimensionality and responsiveness of outcomes measures for patients with low back pain. Pain Pract. 2011;11(1):57–69. [PubMed: 20602714]
- 73.
- Chapman JR, Norvell DC, Hermsmeyer JT, et al Evaluating common outcomes for measuring treatment success for chronic low back pain. Spine. 2011;36(21 Suppl):S54–68. [PubMed: 21952190]
- 74.
- Rocchi MB, Sisti D, Benedetti P, Valentini M, Bellagamba S, Federici A. Critical comparison of nine different self-administered questionnaires for the evaluation of disability caused by low back pain. Eura Medicophys. 2005;41(4):275–281. [PubMed: 16474281]
- 75.
- Grotle M, Brox J, Vollestad N. Functional status and disability questionnaires: what do they assess?: a systematic review of back-specific outcome questionnaires. Spine. 2005;30(1):130–140. [PubMed: 15626993]
- 76.
- Thorborg K, Roos EM, Bartels EM, Petersen J, Holmich P. Validity, reliability and responsiveness of patient-reported outcome questionnaires when assessing hip and groin disability: a systematic review. Br J Sports Med. 2010;44:1186–1196. [PubMed: 19666629]
- 77.
- Peer MA, Lane J. The Knee Injury and Osteoarthritis Outcome Score (KOOS): a review of its psychometric properties in people undergoing total knee arthroplasty. J Orthop Sports Phys Ther. 2013;43(1):20–28. [PubMed: 23221356]
- 78.
- Gandek B. Measurement properties of the Western Ontario and McMaster Universities Osteoarthritis Index: a systematic review. Arthritis Care Res. 2015;67(2):216–229. [PubMed: 25048451]
- 79.
- Mokkink LB, Prinsen CA, Bouter LM, Vet HC, Terwee CB. The COnsensus-based Standards for the selection of health Measurement INstruments (COSMIN) and how to select an outcome measurement instrument. Braz J Phys Ther. 2016;20(2):105–113. [PMC free article: PMC4900032] [PubMed: 26786084]
- 80.
- Crosby RD, Kolotkin RL, Williams GR. Defining clinically meaningful change in health-related quality of life. J Clin Epidemiol. 2003;56(5):395–407. [PubMed: 12812812]
- 81.
- Turner D, Schunemann HJ, Griffith LE, et al The minimal detectable change cannot reliably replace the minimal important difference. J Clin Epidemiol. 2010;63(1):28–36. [PubMed: 19800198]
- 82.
- Dworkin RH, Turk DC, Wyrwich KW, et al Interpreting the clinical importance of treatment outcomes in chronic pain clinical trials: IMMPACT recommendations. J Pain. 2008;9(2):105–121. [PubMed: 18055266]
- 83.
- Haby MM, Chapman E, Clark R, Barreto J, Reveiz L, Lavis JN. What are the best methodologies for rapid reviews of the research evidence for evidence-informed decision making in health policy and practice: a rapid review. Health Res Policy Syst. 2016;14(1):83. [PMC free article: PMC5123411] [PubMed: 27884208]
- 84.
- Tricco AC, Antony J, Zarin W, et al A scoping review of rapid review methods. BMC Medicine. 2015;13:224. [PMC free article: PMC4574114] [PubMed: 26377409]
- 85.
- Tricco AC, Zarin W, Antony J, et al An international survey and modified Delphi approach revealed numerous rapid review methods. J Clin Epidemiol. 2016;70:61–67. [PubMed: 26327490]
- 86.
- Beaton D, BscOt M, Bombardier C, et al Guidelines for the process of cross-cultural adaptation of self-report measures. Spine. 2000;25(24):3186–3191. [PubMed: 11124735]
- 87.
- Booker SS, Herr K. The state-of-“cultural validity” of self-report pain assessment tools in diverse older adults. Pain Med. 2014;16(2):232–239. [PubMed: 25219949]
- 88.
- Von Korff M. Assessment of chronic pain in epidemiological and health services research. New York: Guilford Publications; 2011.
- 89.
- Fillingim RB, King CD, Ribeiro-Dasilva MC, Rahim-Williams B, Riley JL, 3rd. Sex, gender, and pain: a review of recent clinical and experimental findings. J Pain. 2009;10(5):447–485. [PMC free article: PMC2677686] [PubMed: 19411059]
- 90.
- Kroenke K, Spitzer RL. Gender differences in the reporting of physical and somatoform symptoms. Psychosom Med. 1998;60(2):150–155. [PubMed: 9560862]
- 91.
- Tait RC, Chibnall JT. Racial/ethnic disparities in the assessment and treatment of pain: psychosocial perspectives. Am Psychol. 2014;69(2):131–141. [PubMed: 24547799]
Supplemental Table 1Search Strategy
| 1 | exp Low Back Pain/ or exp Shoulder Pain/ or exp Back Pain/ or exp Musculoskeletal Pain/ or exp Chronic Pain/ or exp Neck Pain/ |
| 2 | (pain and (musculoskeletal or (low adj back) or neck or shoulder or hip or knee or joint)).mp. |
| 3 | osteoarthritis.mp. or exp Osteoarthritis/ |
| 4 | 1 or 2 or 3 |
| 5 | exp Pain Measurement/mt |
| 6 | (pain adj5 (questionnaires or assess$ or measur$ or scale$ or inventor$ or rating$ or tool$)).mp. |
| 7 | (BPI or PEG or SF-36 or PROMIS or McGill or DVPRS or Roland-Morris or WOMAC or Oswestry or KOOS or HOOS or (Faces adj Scale)).mp. |
| 8 | 5 or 6 or 7 |
| 9 | (pain adj (severity or intensity or function$ or limit$ or activit$ or impact$ or interfer$ or disabilit$)).mp. |
| 10 | (valid$ or reliab$ or feasib$ or generalizab$ or respons$ or implements).mp. |
| 11 | 4 and 8 and 9 and 10 |
| 12 | limit 12 to (english language and humans and yr=“2000 -Current”) |
Supplemental Table 2Peer Review Comments/Author Responses
| Question Text | Comment | Author Response |
|---|---|---|
| Are the objectives, scope, and methods for this review clearly described? | Yes | Thank you |
| Yes | Thank you | |
| Yes | Thank you | |
| Yes | Thank you | |
| Yes | Thank you | |
| Is there any indication of bias in our synthesis of the evidence? | No | Thank you |
| No | Thank you | |
| No | Thank you | |
| No | Thank you | |
| No | Thank you | |
| Are there any published or unpublished studies that we may have overlooked? | Yes - Please see my major comment below. | Please see our response to these major comments below. |
| No | Thank you | |
| Yes - I have some concerns about the time period examined, as detailed below. | Please see our response below. | |
| Yes - I am concerned that some studies may have been missed. For example, re: the PROMIS-PI scale please verify that the following studies were screened and excluded. Amtmann, D. A., Cook, K. F., Jensen, M. P., Chen, W-H., Choi, S. W., Revicki, D., Cella, D., Rothrock, N., Keefe, F., Callahan, L, Lai, J-S. (2010). Development of a PROMIS item bank to measure pain interference. Pain, 150(1), 173-82. Amtmann, D., Kim, J., Chung, H., Askew, R. L, Park, R., & Cook, K. F. (2016). Minimally important differences for Patient Reported Outcomes Measurement Information System pain interference for individuals with back pain. Journal of Pain Research, 9, 251-255. Askew, R. L, Kim, J., Chung, H., Cook, K. F., Johnson, K. L, & Amtmann, D. (2013). Development of a crosswalk for pain interference measured by the BPI and PROMIS pain interference short form. Quality of Life Research, 10.1007/s11136-013-0398-5. Broderick, J. E., Schneider, S., Junghaenel, D. U., Schwartz, J. E., & Stone, A. A. (2013). Validity and reliability of Patient-Reported Outcomes Measurement Information System instruments in osteoarthritis. Arthritis Care and Research, 5(10), 1625-1633. Merriwether, E. N., Rakel, B. A., Zimmerman, M. B., Dailey, D. L, Vance, C. G., Darghosian, L, … Sluka, K. A. (2016). Reliability and construct validity of the Patient-Reported Outcomes Measurement Information System (PROMIS) instruments in women with fibromyalgia. Pain Medicine. doi:10.1093/pm/pnw187 Papuga, M. O., Mesfin, A., Molinari, R., & Rubery, P. T. (2016). Correlation of PROMIS physical function and pain CAT instruments with Oswestry Disability Index and Neck Disability Index in spine patients. Spine. doi:10.1097/BRS.0000000000001518 Also, I am concerned that the exclusion criteria may have resulted in exclusion of relevant studies (see comments below). For example, many studies investigating the psychometric properties of the pain scales have been published using non-English language versions of the scales of interest. It is not clear to me the rationale for excluding such studies, as this excludes a huge chunk of the literature on this topic. If the authors were concerned that findings could be affected by use of translated versions of a scale, it would be easy to assess whether that is the case. | The suggested references were reviewed for eligibility and did not meet inclusion criteria. Amtmann (2010): the study population did not meet the requirement that >75% of participants have chronic musculoskeletal pain Amtmann (2016): the study population did not meet the requirement that >75% of participants have chronic musculoskeletal pain Askew: the study population was comprised of multiple sclerosis patients (not musculoskeletal pain) Broderick: the study population was comprised of patients who self-reported a physician diagnosis of osteoarthritis. It is unclear whether such diagnoses were radiologically or clinically defined. Details were not provided on presence or duration of pain. Merriwether: we agree with a reviewer’s suggestion to include fibromyalgia; this study is included in the final report. Papuga: the duration of pain associated with conditions of the spine in this population was not reported. We excluded results from non-English language versions of scales. We added information to support this decision in the Limitations section (page 31 We disagree that “it would be easy to assess” whether findings could be affected by use of translated versions of a scale, as psychometric properties are affected by a number of factors other than linguistic and cultural variation, and isolating the influence of language variation would not be a straightforward process. | |
| No | Thank you. | |
| Additional suggestions or comments can be provided below. If applicable, please indicate the page and line numbers from the draft report. | I have one major concern and a number of smaller comments. Major comment: I am confused about the inclusion/exclusion criteria related to chronic pain conditions. Exclusion criteria include “studies of patients with chronic conditions typically associated with pain unless the study specified that the patients had CMP (eg, osteoarthritis).” Does this mean that a study conducted in an osteoarthritis population would be excluded unless the authors specified that patients had “CMP”? If so, this seems to contradict the key question, which indicates that the population of interest has “chronic (≥ 3 months) musculoskeletal pain (eg, low back pain, osteoarthritis, and non-traumatic joint pain).” The pain field suffers from a lack of consensus on terminology (e.g., “chronic pain” vs “persistent pain”) and pain diagnosis categories, so substantial heterogeneity in descriptions of clinical populations is to be expected. “Chronic musculoskeletal pain” is not a specific entity, just an umbrella term used to capture a group of patients with chronic painful conditions, such as those with low back pain and osteoarthritis. Excluding studies of chronic pain measures conducted in patients with chronic back pain and osteoarthritis that do not describe patients as specifically having “chronic musculoskeletal pain” does not seem to make sense. It’s possible that I’m just misunderstanding the exclusion criterion. It would be helpful to have a table of excluded studies along with the reasons for exclusion so readers of the report can better understand how criteria were applied. Without this information, 1 am wondering why the following studies were not included:
Other comments:
| We clarified the study inclusion criteria. The requested scope of this rapid review was to assess the psychometric properties of specified scale scores in individuals with chronic musculoskeletal pain (defined as at least 3 months duration). We were generous in our inclusion criteria. We did not specifically require the phrase “chronic musculoskeletal pain” be used. We included studies if the authors reported that participants had pain of at last 3 months duration or the authors described the participants as having chronic pain associated with a musculoskeletal condition (eg, osteoarthritis) even if duration was not described. We disagree that articles should have been included if they evaluated pain measures in patients with chronic conditions often associated with pain. Such individuals do not necessarily have chronic pain. From a clinical perspective, many patients with radiologically defined osteoarthritis do not have pain or only have acute or subacute pain and thus would fall outside the scope of this review. Nonetheless, we recognize that some may wish to extrapolate less reliable findings from individuals with acute or subacute pain or those with osteoarthritis without pain. We provide a discussion of findings from results of systematic reviews that assessed pain scale scores from studies that included these populations. In the process of full text review, we exclude an article if it meets any one of our exclusion criteria - we do not document all the reasons it was not eligible. Therefore a table of excluded studies would not provide the level of requested detail. The suggested references were reviewed for eligibility. Keller is now included in the final report. Elliott did not meet all inclusion criteria. The study was designed to assess the Chronic Pain Grade as a measure useful in prospective studies of the general population and included patients with any chronic pain, including pain due to angina, arthritis, back pain, injury, women’s problems, and unknown sources. Results were not stratified by pain type. Holm did not meet all inclusion criteria (not English version of scale of interest). The study assessed the Norwegian version of the ODI. We removed the CMP abbreviation. Thank you for the suggestion. We reviewed Table 1 (table of measures) and Supplemental Content Table 3 and updated them to reflect correct descriptions of the scales. Scales, including the BPI and PEG, have been corrected to indicate they are numeric rating scales. Of note, there are discrepancies among various sources of information we reviewed about the scales. We thought that “use of pain medication” might provide an important descriptor of the study population but there are limitations, as the reviewer noted. We have deleted this information from the text and tables. We appreciate the reviewer’s point about the value of information on why no studies of the DVPRS and KOOS met inclusion criteria. We have added this information to the report (page 10). As noted above, we updated Table 1. We replaced the “domain” column with “Restrictions on Use.” The BPI and SF-36 have restrictions and may require payment. Some scales may also be obtained directly from the original author. Although our literature search was limited to 2000 to the present, we included studies prior to 2000 that were identified in hand-searching of reference lists of eligible studies and systematic reviews as well as websites of individual pain scales. This is noted in the Methods section (page 6). We updated Supplemental Content Table 3 to show the BPI as a set of numeric rating scales. We reviewed Table 1 and Supplemental Content Table 3 and added “for pain” to the titles for the NRS and VAS We included TMJ references, as this type of orofacial pain is musculoskeletal in nature. We clarified this in the report (page 7). We agree that pain varies in intensity and is not expected to remain static over specific periods of time. We comment further on the limited conceptual value and applicability of test-retest reliability in the discussion (page 31). We updated Table 1 and Supplemental Content Table 3 showing the BPI as an 11 item scale. We reviewed Gallasch 2007. For non-US studies, we included the study if the authors did not specify the language used for the measures and Gallasch doesn’t provide this information. We modified our exclusion criteria to reflect this. The section on “Mode of Administration” has been revised. We appreciate the reviewer’s attention to the information about availability of measures. We updated Table 1 and Supplemental Content Table 3 as well as the text on Availability. We chose to indicate that there are restrictions on the SF-36. |
| This report will serve an important role in informing a Pain Measurement WG deliberations regarding optimal measures for use in clinical and research settings. The process for establishing the parameters of the review, the enactment of a high fidelity review process, and an exceptionally clear report are important strengths. At the same time, the narrow scope of the review and the narrow parameters for identifying published articles on this topic will likely limit the value of the report. In particular, the decision to “exclude trials of interventions for pain, unless assessment of psychometric properties of interest was noted in the abstract” seems to be a “fatal flaw.” It seems intuitive that most published clinical trials would not report psychometric properties of the key measures in the Abstract, since this would not likely be the major focus of the report. It would also seem intuitive that published reports of the psychometric properties of the measures should have been considered, as well as systematic reviews of the psychometric properties of these measures. These decisions likely greatly limited the data pool upon which measures’ quality could be evaluated. Other comments: Why only Medline? Results seem to be based on a binary determination about whether specific psychometric properties were reported in published studies, rather than the strength of the psychometric properties. Results are reported for CMP generally, without regard to specific CMP conditions. The failure to examine non-English language versions of the measures will greatly limit the value of the report beyond its use in informing VHA policy. Use of quality assessment (COSMIN) is a strength. Some of the data reported in Table 1 could be considered misleading. The pain severity and pain interference scales of the WHYMPI total only 12 items. The Pain Rating Index of the MPQ that assesses pain severity has only five response options. There are questions about the accuracy of Table 2. Kerns (1985) reported on the concurrent and criterion-related validity of the measure. Page 24 reports on internal consistency, but it reports on a range of alphas for the several scales of the WHYMPI, not just the pain severity and interference scales. Also on page 24, the section on concurrent and criterion-related validity does include a reference to Kerns et al (1985) but this publication is not listed among those that were reviewed earlier in the same section and the fact that these psychometric properties were evaluated is not acknowledged in Table 2. I’m not clear how MID or responsiveness is operationalized. It seems intuitive that if an RCT included one of these measures as an outcome, and if there is evidence of significant change over time, it should be considered as evidence or responsiveness. Similarly, if the study included a prespecified MID and included a “responder analysis” then this should be included. | Thank you. We disagree that the scope and parameters are too narrow. Our report was based on decisions made jointly with our partners and within the parameters of a Rapid Review and the Topic Nomination. We previously described our concerns about including findings from studies of non-English language versions of scales and recommendations for providing some information related to these studies. We also disagree that our decision to “exclude trials of interventions for pain, unless assessment of psychometric properties of interest was noted in the abstract” is a “fatal flaw.” We reviewed search and triage strategies of relevant systematic reviews. It is extremely likely that these authors used similar strategies. For example, the systematic review by Gandek (2015) evaluating the WOMAC excluded nearly 2000 articles at the abstract level because they did not meet inclusion criteria (without further elaboration). Included articles described psychometric properties in the abstract and none of the included articles identified in prior systematic reviews or scale score websites reported information in the body of the manuscript without also describing in the abstract. A review of a subset of excluded articles confirmed these findings and support our rationale. We considered MEDLINE to be the most pertinent database. Rapid Reviews typically utilize a single electronic search engine that is likely to capture the most relevant information in an expedient fashion. As noted, in the Methods, we searched beyond MEDLINE to identify relevant evidence. Evaluating the quality of the statistical and other methodological approaches to psychometric assessments, and therefore the quality of their findings, was not set out as one of our goals for this systematic review. We report the CMP conditions present within the population for each study, and thus for the psychometric properties of interest assessed in that study. We attempted to synthesize results across CMP conditions as per the understood goals of this report. We have commented further on patterns in the CMP conditions of populations within which the most frequently studied measures were assessed. We have previously described our rationale for excluding non-English language versions of the measures. We modified the Methods section. Although the COSMIN checklist is an appropriate tool for the quality of studies of measurement properties, on further examination, the checklist (beyond identifying the appropriate measurement properties to evaluate) is extensive and not feasible to use in a Rapid Review. We reviewed Table 1 (table of measures) and Supplementary Content Table 3 to include the number of pain severity and number of pain interference items in each scale (as appropriate based on purpose of scale) Thank you for noting this. We cross-checked all tables and text for accuracy. We appreciate the reviewer’s point about the role of change over time in a measure used in an RCT. We also recognize that in such a situation, some forms of responsiveness assessment cannot separate the effect of an intervention from the ability of a measure to assess that effect. We considered the variety of approaches to responsiveness in assessed studies, and comment on this in the discussion (page 31). We have also attempted to clarify our approach to MID assessment, which focuses on whether studies developed an estimate of a minimum clinically important difference and/or minimum detectable change specific to a given measure. This question of primary MID development is distinct from questions about whether studies used, for example, prespecified MIDs and responder analyses as part of their approach to an RCT. | |
| This is overall a very well done review. The methods are clearly described and the conclusions are appropriate for the findings. I have one main concern, which is the time period examined, starting in 2000. I think this would be an ample look-back period. However, some of these measures are a bit older, and the early psychometric data may have been published before 2000. Even though the included articles from 2000 forward were scanned for references other relevant articles, this strategy could still miss relevant articles for measures that did not have any newer articles meeting inclusion criteria. If it is decided that the review will not search for articles prior to 2000, I think this limitation should be very clear and prominent, and the report should make it clear that the lack of finding psychometric data does not necessarily mean it isn’t there in earlier years, or that this finding means the measure is not recommended. I have some familiarity with the KOOS and was very surprised to see that there were no relevant articles, since there certainly are papers on its psychometric properties in the literature. I am not sure if the lack of finding is because these manuscripts were published before 2000. Some additional minor comments:
| Thank you. As noted in responses above, we have taken multiple other steps to enhance the literature retrieval process. We appreciate the point about the inherent limitation in any date restrictions, and have commented on this in the Limitations section (page 31). The reviewer does not provide article references that we may have missed. We have reviewed and included (or excluded) all suggested references provided by peer reviewers. Several articles reporting on the KOOS were included in our full text review (eg, Roos 2003, Ornetti 2008) but were not eligible because they used non-English versions of the KOOS. We revised the Conclusions paragraph in the Abstract. We corrected this sentence. | |
This manuscript gives an overview of the properties of a number of pain-related measures in persons with chronic pain. Though it does provide some summarization of the literature, I have some concerns about the methods as well as the conclusions. My main concern is that relevant studies were likely to have been excluded due to the way the inclusion/exclusion criteria were specified, failure to assess the quality of included studies, and unclear synthesis methods. I also feel that the conclusions--which are basically “we can’t make any conclusions” are rather superficial when there do appear to be some measures that are supported by more evidence/testing/validation than others.
| Thank you for the feedback. We have modified the conclusion statements and address specific comments below.
| |
| Boonstra, Anne M. et al. “Cut-Off Points for Mild, Moderate, and Severe Pain on the Numeric Rating Scale for Pain in Patients with Chronic Musculoskeletal Pain: Variability and Influence of Sex and Catastrophizing.” Frontiers in Psychology 7 (2016): 1466. PMC. Web. 8 May 2017. | The suggested reference was reviewed for eligibility and did not meet all inclusion criteria (English language versions of scales). The scales were administered in Dutch. |
Supplemental Table 3Characteristics of Included Pain Measurement Scales
| Scale Reference | Measure Properties | Feasibility | ||||||
|---|---|---|---|---|---|---|---|---|
| Year Developed | Developed for Specific Conditions (write in) | Pain Severity/Intensity or Functioning/Interference | Scoring (write in) | Number of Items | Scale Description | Restrictions on use: Yes, No | Reading Level (write in) | |
| Brief Pain Inventory (BPI)1 | 1983 | Cancer pain | Pain intensity Interference (physical functioning, work mood, walking, social activity, relations with others, and sleep) | 11-point numeric rating scale of 0-10, corresponding to: 0=no pain, no interference, to 10=pain as bad as you can imagine, complete interference Diagram also provided for respondents to indicate where pain is felt Mean of pain intensity and interference scores indexed separately | 11 total (4 severity, 7 interference) | Range: none=0, mild= 1-3, moderate=4-6, severe=7-10 Direction: Hiqher indicates worse | Scale available for purchase with price dependent on use | NR |
| Defense & Veterans Pain Rating Scale2 | 2010 | Pain among military and Veterans Designed to enhance NRS with visual cues and word descriptors to anchor pain | Pain intensity Interference (general activity, sleep, mood, stress) | 11-point numeric rating scale of 0-10, corresponding to: 0=no pain, no interference, no affect, to 10=pain as bad as can be, completely interferes, completely affects | 5 total (1 severity, 4 interference) | Range: Green (0-4)=mild pain or interference Yellow (5-6)= moderate pain or interference Red (7-10)= severe pain or interference Direction: Higher indicates worse | Free use of the scale is permitted without revisions or alterations | 9th grade reading level |
| Graded Chronic Pain Scale3,4 | 1992 | Chronic pain conditions including musculoskeletal pain and LBP | Pain Intensity Interference (disability) | 11-point Likert-type scale of 0-10, corresponding to: 0=no pain to 10=pain as bad as can be. Mean intensity ratings multiplied by 10 calculated for 2 subscales ranging from 0-100 and 1 subscale ranging from 0-3 points Subscale scores for pain intensity and disability are combined to calculate chronic pain grade. Patients are then divided into 5 hierarchical categories: grade 0 (no pain) and 5 (high disability and severely limiting) | 7 total | Range: Pain intensity= 0-100 Disability score= 0-100 (0-3 points) Disability pts (points from disability days + disability score) =0-6 *Disability days 0-6 days=0 points 7-14 days=1 points 15-30 days=2 points 31+ days=3 points *Disability score 0-29=0 points 30-49=1 points 50-69=2 points 70+=3 points Direction: Hiqher indicates worse | Free version of scale is available from original reference or directly from author | Basic |
| Hip Osteoarthritis Outcomes Scale (HOOS)5 | 2002 | Hip disability with or without OA Extension of WOMAC scale | Pain intensity Interference (physical functioning) | 5-pt Likert-type scale of 0-4, corresponding to: 0=no problems to 4=extreme problems All subscale scores transformed to a 0-100 scale with zero representing no hip problems and 100 representing extreme hip problems | 40 total with 5 subscales pain, symptoms, daily living limitations, sport and recreation limitations, hip-related quality of life | Range: 0-100 Direction: Hiqher indicates worse | Free version of scale available online | NR |
| Knee Osteoarthritis Outcomes Scale (KOOS)6 | 1998 | Knee injury or OA Extension of the WOMAC pain scale | Pain intensity Interference (physical functioning) | 5-point Likert-type scale of 0-4, corresponding to: 0=no problems to 4=extreme problems All subscale scored as sum of items answered Scores are then transformed to a 0-100 scale with zero representing extreme knee problems and 100 representing no knee problems | 42 total with 5 subscales: pain (9 items), symptoms (7 items), daily living limitations (17 items), sport and recreation limitations (5 items), knee-related quality of life (4 items) | Range: 0-100 Direction: Hiqher indicates better | Free version of scale available online | NR |
| McGill Pain Questionnaire7,8 | 1970 | General chronic pain | Pain Intensity and quality in multiple domains (eg, sensory, affective, evaluative) | Three classes of rank order-type words and a 5-point numeric rating scale MPQ scored by counting number of words selected to obtain a Number of Words Chosen score (0-20). PRI scores (0-78) based on rank order of words in each subclass Rank scores are summed in each subclass as well as overall Normative scored range from 24-50% of maximum score | 78 total with 20 subscales (PRI) sensory=42, affective=14, evaluative=5, miscellaneous=17; 6 additional items (5 point score range) for the present pain intensity scale (PPI) | Range: Number of Words Chosen= 0-20 PRI= 0-78 PPI= 0-6 Direction: Hiqher indicates worse *No established cut points | Free version of scale available from author | Words may be defined by administrator |
| Multidimension-al Pain Inventory7,9 (also known as the West Haven-Yale Multidimensional Pain Inventory [WHYMPI]) | 1985 | Chronic pain including LBP and temporo-mandibular disorders | Pain intensity Interference (daily activities including vocational, social, and familial functioning) | 7-point numeric rating scale of 0-6, corresponding to: 0=none, not at all, extremely low, never, to 6=extreme, very intense, very often Subscale scores are derived by from sum of individual terms in subscale divided buy number of items in subscale To calculate total score divide by the number of items | 52 total with 3 parts interference=9, support=3, pain severity=3, life-control=2, affective distress=3, negative responses=4, solicitous responses=6, distracting responses=4, household chores=5, outdoor work=5, activities away from home=4, social activities=4 | Range: Pain experience= (0-120) Significant others’ responses to communication of pain=(0-84) Participation in common daily activities= (0-108) Direction: Hiqher indicates worse | Free version of scale available from author | Words may be defined by administrator |
| Numeric Rating Scale for Pain (NRS)3,8 | NR | General chronic pain | Pain intensity Pain interference | 11-point numeric rating scale of 0-10, corresponding to: 0=none to 10=severe Horizontal line commonly used | 1 total | Range: none=0, mild= 1-3, moderate=4-6, severe=7-10 Direction: Hiaher indicates worse | Free version of scale available online | Basic |
| Oswestry Disability Index/Oswestry Low Back Pain Disability Questionnaire (ODI/ODQ)10 | 1980 | Disability from acute and chronic LBP | Pain intensity (need for pain medications) Interference (physical functioning, disability) | 6-point ordinal scale of 0-5, corresponding to: 0=no pain, no interference/disability, to 5=worst scenario of pain, interference/disability Scoring for each item increases from 0-5 Missing values omitted. Sum of scores divided by total possible scores to obtain percentage | 10 total with 2 possible subscales; pain or need for pain medication=1 item, interference on daily activities=9 items | Range: Minimal disability=0-20 Moderate disability=20-40 Severe disability=40-60 Housebound-60-80 Bedbound=80-100 Direction: Hiqher indicates worse (disability) | Free use of scale permitted for non-funded academic research and individual clinical practice | NR |
| Patient Global Impression of Change11 | NR | NR | NR | 7-point categorical scale of 1-7, which corresponds to: 1=no change in condition to 7= a great deal better | 1 total | Range: 1-7 Direction: Hiqher indicates better | Free version of scale available online | N/A |
| PEG12 | 2008 | Chronic pain in primary care Derived from the BPI | Pain intensity Interference (physical functioning) | 11-point numeric rating scale of 0-10, corresponding to: 0=no pain, no interference, to 10=pain as bad as you can imagine, completely interferes The PEG is scored by averaging the 3 individual item scores | 3 total | Range: 0-10 Direction: Higher indicates worse | Free use of the scale is permitted | NR |
| PROMIS Pain Interference (PROMIS-PI)13,14 | 2004 | General chronic pain conditions | Interference (physical functioning) | 5-point numeric rating scale of 1-5, corresponding to: 1=not at all, never, to 5=very much, always, every few hours Sum response scores for questions that were answered. Multiply sum by total number of items in form then divide by number of items answered | 41 total 4a, 6a, 6b, and 8a item short version SFs often used | Range:4a=4-20 6a=6-30 6b=6-30 8a=8-40 Direction: Higher indicates worse | Free use of the scale is permitted after registration with assessment center and endorsing terms and conditions of use | NR |
| Roland Morris Disability Questionnaire (RMDQ)15 | 1983 | Disability from LBP | Interference (physical functioning, disability) | 1 point for each item completed | 24 total | Range: 0=no disability to 24=severe disability Direction: Higher indicates worse (disability) | Free version of scale available and in the public domain | Basic |
| SF-36 Bodily Pain Scale (SF-36 BPS)3,16 | 1996 | Overall health status in ages ≥14 | Pain intensity Interference (daily activities) | 6-point pain severity rating where 1=none and 6=very severe; 5-point pain interference rating where 1=not at all and 5=extremely Responses transformed to a 0-100 point scale. | 2 total | Range: 0-100 Direction: Hiqher indicates more favorable health state. | Scale available for purchase with price dependent on use | NR |
| Visual Analogue Scale for Pain (VAS)7,17 | 1952 | Rheumatic diseases | Pain intensity Interference (disability) | One vertical line (usually 10cm or 100 mm) in length anchored with verbal descriptors of “no pain” to “pain as bad as it could be”. Perpendicular lines placed at point that best indicates pain. Metric ruler placed along line to indicate score in mm or cm | 1 total | Range: 0-10 cm or 0-100 mm Direction: Hiqher indicates worse Scores below 4 cm or 20 mm considered desirable for chronic pain management | Free version of scale available and in the public domain | NR |
| Western Ontario and McMaster Universities Osteoarthritis Index (WOMAC)18 | 1982 | OA (knee and hip) | Pain intensity Interference (physical functioning) | 5-point Likert-type scale of 0-4, corresponding to: 0=none to 4=extreme 100mm Visual Analog version uses anchors of no pain/ stiffness/ difficulty and extreme pain/ stiffness/ difficulty | 24 total with 3 subscales pain=5, interference (functioning)=17, stiffness=2 | Range: Pain 0-20 Function 0-68 Stiffness 0-8 Direction: Hiqher indicates worse | Scale available for purchase with price dependent on use | NR |
| Wong Faces Scale19 | 1985 | Pain among children | Pain intensity | 6-point numeric rating scale of 0-10 (increasing by 2), which corresponding to: 0=no pain to 10=hurts worst Person chooses the face that best describes their pain | 1 total | Range: No pain=0 hurts little bit=2 hurts little more=4 hurts even more=6 hurts whole lot=8 hurts worst=10 Direction: Hiqher indicates worse pain | Scale available for purchase with price dependent on use | NR |
OA=Osteoarthritis; NR=not reported, PPI=present pain intensity, PRI=Pain rating index, LBP= low back pain, CAT= computer adaptive test, N/A= not applicable
Supplemental Table 4Study Characteristics
| Study (name and year)/Location/Funding | Scale of Interest/Others | Mode of Administration | Settinga | Condition/Study Inclusion/Exclusion Criteria | Baseline Pain Characteristics | Demographics |
|---|---|---|---|---|---|---|
| Anagnostis 200420 Location: United States Funding: Government | ODI | SAQ, written | Community treatment clinic | Condition: CDMD (current) Inclusion: Enrolled in chronic pain management course; ≥ 4 months partial or total disability since work related injury; ≥ 1 injury related to spine or extremities, failed response to primary or secondary non-operative care or surgery; severe functional limitations; English or Spanish speaking Exclusion: NR | Baseline pain score(s): NR Average intensity: NR | N=230 Age (mean, SD): 43.3, δ 9.4 Women (%): 53 Race/Ethnicity (%): White: 59.7 African-Amer./Black: 29.2 Hispanic: 11 Other: 0.1 |
| Askew 201621 Location: United States Funding: Government | PROMIS-PI | SAQ, written | Spine center, local clinics | Condition: LBP Inclusion: Receiving, or about to receive; a spinal injection Exclusion: NR | Baseline pain score(s): NRS= 78% scored ≥8, range 0-10 Average intensity: NR | N=218 Age: 62% ≥ 50 years Women (%): 56 Race/Ethnicity (%): White: 84 African-Amer./Black: 4.1 Hispanic: 1.3 Other: 10.6 |
| Burnham 201222 Location: Canada Funding: NS |
MPQ ODI | SAQ, written | Chronic pain management clinic | Condition: Spine pain Inclusion: Attending a chronic pain management clinic; received a lumbopelvic spinal intervention Exclusion: NR | Baseline pain score(s): NR Average intensity: NR | N=60 Age (mean, SD): 60, δ 12.4 Women (%): 67 Race/Ethnicity (%):NR |
| Changulani 200923 Location: United Kingdom Funding: NS |
ODI VAS | SAQ, written | Outpatient clinic | Condition: LBP Inclusion: Undergoing caudal epidural steroid injections for lumbosacral radicular pain with symptoms persisting for more than 4 weeks; unrelieved by analgesia and physiotherapy Exclusion: NR | Baseline pain score(s): ODI Spinal stenosis= 48 (δ15); Disc prolapse=50 (δ16); Spondylolisthesis=4 1 (δ15) Average intensity: NR Type of pain (%): Spinal stenosis=59 Disc prolapse=36 Spondylolisthesis=5 | N=107 Age (mean): 58 Women (%): 58 Race/Ethnicity (%): NR |
| Chansirinukor 200524 Location: Australia Funding: None | RMDQ | SAQ, written | Physical therapy clinic | Condition: LBP Inclusion: Work-related pain, at least 2 complete Functional Rating Indexes and RMDQs Exclusion: NR | Baseline pain score(s): RMDQ= 57.2 (δ23.7) Average intensity: NR Type of pain (%): LBP=78.3 | N=143 Age (mean, SD): 37.9, δ 9.8 Women (%): 26.4 Race/Ethnicity (%):NR |
| Chien 201325 Location: Australia Funding: Academic | BPI | SAQ, written | Pain clinic | Condition: General musculoskeletal pain Inclusion: Age ≥18 years; nonmalignant pain Exclusion: Cancer-related pain | Baseline pain score(s): BPI (S) =6.0 (δ 1.6); BPI (I) =5.9 (δ 1.9) Average intensity: Moderate | N=254 Age (mean): 51 Women (%): 50 Race/Ethnicity (%): NR |
| Cook 200826 Location: United States Funding: Government | RMDQ (24-, modified, 18-, 12-, and 11-item) | SAQ, written and CATs | NR | Condition: LBP Inclusion: Study 1 (Discogenic study) participants had 1- or 2-level disc degeneration Study 2 (Seattle Lumbar Imaging Project) participants randomly assigned to rapid magnetic resonance imaging or standard radiographs Exclusion: NR | Baseline pain score(s): NR Average intensity: NR | *Data combined from 2 studies N=875 Age (mean, range): 47, 18-93 Women (%):NR Race/Ethnicity (%): White: 85 African-Amer./Black: 9 Hispanic: 3 Asian: 2 Other: 1 |
| de Vet 200727 Location: Netherlands Funding: NS | NRS | SAQ, written | Physiotherapy clinics | Condition: LBP Inclusion: Referred for physiotherapy Exclusion: NR | Baseline pain score(s): NR Average intensity: NR | N=438 Age (mean, range): NR Women (%): NR Race/Ethnicity (%): NR |
| Deyo 201628 Location: United States Funding: Government | PROMIS-PI SF | SAQ, Telephone interview | Primary care clinics | Condition: General musculoskeletal pain Inclusion: Age ≥55 years; ≥ 2 visits for musculoskeletal pain; moderate pain (≥ 5 points on 10-point pain scale); no opioid use for ≥ 1 month; telephone access; no cognitive impairments Exclusion: Adverse reaction to opioids; life expectancy <2 years | Baseline pain score(s): NR Average intensity: ≥5, 10-point scale Type of pain (%): Back=30.8 Neck=7.5 Joint=14.1 Arthritis=15.6 Other=31.8 | N=198 Age (mean, SD): 66.5, δ 8.2 Women (%): 62.1 Race/Ethnicity (%): White: 92.3 Hispanic: 3.6 Other: 4.1 |
| Driban201529 Location: United States Funding: Government |
PROMIS-PI SF-36 BPS WOMAC | SAQ, written | University hospital | Condition: Pain from OA of the knee Inclusion: Participation in RCT (comparison of Tai Chi and physical therapy); age ≥40 years, WOMAC pain subscale score (100 mm visual analog scales) >40 on at least 1 out of 5 questions; fulfillment of the American College of Rheumatology criteria for knee osteoarthritis; radiographic evidence of knee osteoarthritis; confirmation of knee pain, discomfort; or disability by clinical examination Exclusion: Experience with physical therapy in past year, Tai Chi training/ use of alternative medicine; serious medical conditions limiting ability to participate, intraarticular steroid injections or replacement surgery on the affected knee in the last 3 months; or a Mini-Mental examination score <24 | Baseline pain score(s): PROMIS-Pl= 58 (δ 7.0); SF-36 BPS= 47.5 (δ 18.6); WOMAC= 254 (δ 98.6) Average intensity: NR | N=204 Age (mean): 60.2 Women (%): 70 Race/Ethnicity (%): White: 52.7 African-Amer./Black: 35.5 Other: 11.8 |
| Fisher 199730 Location: United Kingdom Funding: NS |
MPQ ODI | SAQ, written | Clinical Psychology Department, outpatient clinic | Condition: LBP Inclusion: Undergoing, or about to undergo, a back pain rehabilitation program Exclusion: NR | Baseline pain score(s): ODI= 54.5 (δ12.3); MPQ =2.8 (δ1.1) Average intensity: NR Type of pain (%): Back=87 Leg or neck=13 | N=54 Age (mean, range): 41, 20-62 Women (%): 63 Race/Ethnicity (%): NR |
| Gallasch 200731 Location: Brazil Funding: Government |
Faces NRS VAS | SAQ, written | University health center | Condition: General musculoskeletal pain Inclusion: Physiotherapy treatment due to musculoskeletal symptoms, age 18 to 70 years; education no more than middle school level Exclusion: Illiterate | Baseline pain score(s): NR Average intensity: NR Type of pain (%): OA=19 Tendonitis=16 Back=13 | N=32 Age (mean, range): 51, 33-69 Women (%): NR Race/Ethnicity (%): NR |
| Gentelle-Bonnassies 200032 Location: France Funding: NS |
VAS WOMAC | SAQ, written and mail | Hospital | Condition: Pain from OA of the knee Inclusion: OA fulfilling the criteria of the American College of Rheumatology; primary or secondary OA (osteonecrosis; chondro-calcinosis); involvement of the medial tibiofemoral; the lateral tibiofemoral, or the patellofemoral compartment of the knee joint; active disease (pain and disability) justifying joint lavage Exclusion: Serious chronic disease; intra-articular procedures (arthroscopy or surgery) performed ≤ 2 years or osteotomy performed ≤ 3 years; prescription of intra-articular injections ≤ 1 month before entry | Baseline pain score(s): VAS=57 (δ22) (pain after activity) Average intensity: NR | N=80 Age (mean, SD): 62, δ 12 Women (%): 70 Race/Ethnicity (%): NR |
| Godil 201533 Location: United States Funding: Industry |
NRS - neck pain NRS - arm pain | Telephone interview | Medical center | Condition: Neck and radicular arm pain Inclusion: Age 18-70 years; undergoing anterior cervical discectomy and fusion for neck and radicular arm pain; radiological evidence of cervical nerve root impingement from herniated disc or osteophyte Exclusion: Myelopathic symptoms; previous cervical spine surgery | Baseline pain score(s): NRS-neck pain=6.3 (δ2.6); NRS-arm pain= 5.5 (δ3) Average intensity: NR | N=88 Age (mean, SD): 52.3, δ 10.7 Women (%): 44 Race/Ethnicity (%): NR |
| Gronblad 199334 Location: Finland Funding: Foundation |
ODQ VAS | SAQ | Tertiary care center | Condition: LBP Inclusion: With or without radiation to legs Exclusion: Pain due to underlying disease, psychiatric disease requiring continuous medication | Baseline pain score(s): NR Average intensity: Among subset VAS=54.1 (δ19.48) | N=94 Age (mean): 42.7 Women (%): 51 Race/Ethnicity (%): NR N=20 (re-test) Age (mean, SD): 42.3 Women (%): 55 Race/Ethnicity (%): NR |
| Hicks 200935 Location: USA Funding: Government |
ODI SF-36 BPS | SAQ, mail | Retirement communities | Condition: LBP requiring activity modification Inclusion: Age ≥ 62 years, living independently Exclusion: NR | Baseline pain score(s): ODI=29.4 (δ16.6) Average intensity: NR | N=107 (validity) Age (mean): 80 Women (%): 72 Race/Ethnicity (%): White: 100 N=56 (re-test) Age (mean, range): 79 Women (%): 71 Race/Ethnicity (%): White: 100 |
| Jensen 201236 Location: United States Funding: Industry | VAS | SAQ, written | Clinic | Condition: LBP Inclusion: Participation in an RCT (comparison of Etoricoxib and placebo); age 18-75 years; pain for majority previous month; taking NSAID or acetaminophen for 24 of previous 30 days; pain met Quebec Task Force criteria for spinal disorders (class 1 or 2); no surgery for LBP in past 6 months; no symptomatic depression or drug/alcohol abuse in past 5 years; no opioids > 4 days/month; no corticosteroid injections within 3 months Exclusion: NR | Baseline pain score(s): VAS= 76.7; RMDQ= 14.7 Average intensity: NR | N=639 Age (mean): 52.4 Women (%): 61.5 Race/Ethnicity (%): White: 90.1 African-Amer./Black: 5.1 Asian: 0.6 Other: 4.2 |
| Kamper 201537 Location: Australia Funding: Government, Industry |
NRS-24 hours NRS-week SF-36 BPS | SAQ (See Stewart 2007) | Clinic (See Stewart 2007) | Condition: Whiplash associated disorders (neck pain) Inclusion: Participation in RCT (exercise therapy for chronic whiplash); pain from car accident; age 18-65 years; English speaking Exclusion: Cervical fractures or dislocations; serious spinal pathology; serious psychiatric illness | Baseline pain score(s): NR Average intensity: NR | N=280 Age (mean): 43.5 Women (%): 65 Race/Ethnicity (%): NR |
| Kean 201638 Location: United States (Enrolled Veterans) Funding: Government |
BPI PEG PROMIS-PI SF-36 BPS | IAQ | Primary care clinic | Condition: Musculoskeletal pain Inclusion: Participation in RCT (effectiveness of collaborative telecare management for moderate to severe and persistent musculoskeletal pain); Veteran; age 18-65 years; receiving care at a VAMC; persistent pain despite trying ≥ 1 analgesic medication; other non-musculoskeletal pain; English speaker; pain of moderate severity Exclusion: Inflammatory arthritis; pending pain-related disability claim; cognitive impairment; psychoses; actively suicidal; current illicit drug use; life expectancy < 12 months | Baseline pain score(s): BPI= 5.3 (δ 1.8); SF-36 BPS= 34.8 (δ 16.8); PROMIS-PI=22.1 (δ 8.8) Average intensity: Moderate | N=244 Age (mean, range): 55, 28-65 Women (%): 17 Race/Ethnicity (%): White: 77 African-Amer./Black: 19 Other: 4 |
| Keller 200439 Location: United States Funding: Government |
BPI-SF GCPS SF-36 BP RMDQ | SAQ | Primary care clinic | Condition: LBP Inclusion: Age 18-80 years, not permanently disabled, at least 8th grade reading level, prescribed change of therapy requiring follow-up visit Exclusion: NR | Baseline pain score(s): NR Average intensity: NR | N=131 Age (mean): 46.5 Women (%): NR Race/Ethnicity (%): NR |
| Kerns 19859 Location: United States (Enrolled Veterans) Funding: Government |
WHYMPI (MPI) MPQ | SAQ | Pain clinic | Condition: Chronic pain Inclusion: consecutive referrals to pain management program at 2 VAMCs Exclusion: NR | Baseline pain score(s): NR Average intensity: NR Type of pain (%): Back=36 | N=120 (test-retest reliability for n=60 from one site) Age (mean, SD): 51, δ 14.5 Women (%): 18.5 Race/Ethnicity (%): NR |
| Krebs 201040 Location: United States (Enrolled Veterans) Funding: Government |
BPI GCPS PEG RMDQ SF-36 BPS | SAQ, written See Scamp papersb | See Scamp papers | Condition: Back, hip, or knee pain Inclusion: Participation in SCAMP studyb; Veteran; primary care patients, receiving care at a VAMC; persistent pain of at least moderate severity [BPI≥5]) (See SCAMP Study papers) Exclusion: NR | Baseline pain score(s): BPI (S)= 5.7; BPI (I)= 5.8; PEG=6.0;GCPS= 68.3; RMDQ=14.8; SF-36 BPS=35.3 Average intensity: NR Type of pain (%): Back=55 Hip or knee=45 | N=427 Age (mean): 59 Women (%): 53.4 Race/Ethnicity (%): White: 58 African-Amer./Black: 38 Other: 4 |
| Krebs 200912 Location: United States (Enrolled Veterans) Funding: Government |
BPI GCPS PEG PGIC RMDQ SF-36 BPS | SAQ, written See Scamp papersb | University and VA affiliated clinics | Condition: Back, hip, or knee pain Inclusion: Participation in SCAMP studyb; Veteran; primary care patients, receiving care at a VAMC; persistent pain of at least moderate severity [BPI≥5]) (See SCAMP Study papers) Exclusion: NR | Baseline pain score(s): (Mean) NRS = 6.1 (δ1.9), 0-10 scale Average intensity: NR | N=500 Age (mean): 59 Women (%): 52 Race/Ethnicity (%): White: 58 African-Amer./Black: 38 Other: 4 |
| Krebs 200741 Location: United States Funding: Foundation, Government | NRS | IAQ | Hospital | Condition: General musculoskeletal pain (including extremities, back, and neck) Inclusion: Adults presenting to general medicine clinic for a return visit Excluded: Non-English speaking; patients chosen by physicians | Baseline pain score(s): NRS=6.0 (among those with NRS ≥1), 0-10 scale Average intensity: NR Type of pain (%): Lower extremity= 21 Back or neck= 18 Upper extremity= 8 No pain= 28 | N=275 Age (mean): 59 Women (%): 59 Race/Ethnicity (%): White: 70 African-Amer./Black: 24 Other: 6 |
| Lovejoy 201242 Location: United States (Enrolled Veterans) Funding: Government, Industry |
MPQ-2 SF MPQ MPI | SAQ, written | Unclear | Condition: LBP, neck or joint pain Inclusion: Veterans; age ≥18 years; English speaking; ≥1 pain diagnosis in medical record; reported current symptoms of (or receiving treatment for) chronic pain, previous tests for hepatitis C Exclusion: Age >70 years; current unstable psychiatric disorder; pending litigation or disability compensation for pain; advanced liver disease | Baseline pain score: MPQ-2 SF= 3.22 (δ2.36), range 0-9.82 Average intensity: NR Type of pain (%): Neck orjoint=76 Back=59 | N=186 Age (mean, SD): 54.4, δ 7.7 Women (%): 7.5 Race/Ethnicity (%): White: 75.3 Other: 14.7 |
| Lund 200543 Location: Sweden Funding: NS | VAS | SAQ, written | Unclear | Condition: Idiopathic musculoskeletal pain Inclusion: Recruited from rehabilitation medicine clinic; previously classified as chronic/idiopathic pain by physician Exclusion: NR | Baseline pain score(s): (Median) VAS=59, range12-96 Average intensity: NR | N=30 Age (mean, SD): 42.8, δ 10.6 Women (%): 43 Race/Ethnicity (%): NR |
| Macedo 201144 Location: Australia Funding: Government | RMDQ (24-, 18c,d-, and 11- item) | SAQ, written | Unclear | Condition: LBP Inclusion: Patients with or without leg pain, age 18-80 years Exclusion: Previous spinal surgery; specific pathology; contraindication to exercise; insufficient English ability to complete questionnaires | Baseline pain score(s): (Mean) RMDQ 24=12.8 (δ 5.1);18c= 10.6 (δ 4.6); 18d = 10.8 (δ 4.4); 11=7.3 (5 2.9) Average intensity: NR | N=461 Age (mean, SD): 52.5, δ 14 Women (%): 61 Race/Ethnicity (%): NR |
| Maughan 201045 Location: United Kingdom Funding: NS |
NRS ODI-2 RMDQ | SAQ, written | Pain management back class | Condition: LBP Inclusion: Age ≥ 18 years, not undergoing treatment for pain, sufficient level of spoken and written English Exclusion: Spinal surgery in past 12 months, unstable neurological symptoms, pregnancy | Baseline pain score(s): NRS= 5 (δ2.6), RMDQ= 11 (δ6.1), ODI= 29 (δ20) Average intensity: NR | N=48 Age (mean): 52 Women (%): 67 Race/Ethnicity (%): NR |
| Merriwether 201646 Location: United States Funding: Government | PROMIS- Pl-SF | SAQ | University outpatient clinics | Condition: Fibromyalgia Inclusion: Women, ages 20-67 years, English speaking, stable medical treatment regime Exclusion: Prior transcutaneous electrical nerve stimulation use in last 5 years, pain intensity less than 4 out of 10 on the NRS | Baseline pain score: NR Average intensity: NR | N=106 Age (mean): 49.1 Women (%): 100 Race/Ethnicity (%): White: 96 Other: 4 |
| Mikai 199347 Location: Canada Funding: Foundation |
MPI ODI | SAQ | Pain clinic | Condition: Chronic pain Inclusion: Patients seen at Chronic Pain clinic; diagnosis of chronic pain by physiatrist, psychologist, and physiotherapist Exclusion: NR | Baseline pain score: NR Average intensity: NR Type of pain (%): Neck=6, Back=43, Extremities=18, Multiple=25, Other=8 | N=315 Age (mean): 43.5 Women (%): 53 Race/Ethnicity (%): NR |
| Nilsdotter 200348 Location: Sweden Funding: NS |
HOOS SF-36 BPS WOMAC | SAQ, written | Clinic | Condition: OA of the hip Inclusion: Assigned total hip replacement; completed follow-up Exclusion: NR | Baseline pain score(s): NR Average intensity: NR | N=62 Age (mean, range): 72.8, 53-85 Women (%): 45 Race/Ethnicity (%): NR |
| Parker 201249 Location: United States Funding: NS |
ODI VAS-back pain | SAQ, written | University medical center | Condition: Symptomatic pseudoarthrosis, mechanical LBP Inclusion: Patients undergoing revision-instrumented fusion; age 18-70 years; prior lumbar instrumented fusion; failed to complete at least 3 months of non-operative care Exclusion: Extra-spinal cause of back pain; trauma, infection, or neoplasm; previous lumbar revision surgery for other causes | Baseline pain score(s): (Mean) VAS-back pain=7.3mm (δ 0.8mm); ODI= 59.4% (δ 10.8%) Average intensity: NR | N=47 Age (mean, SD): 54.5, δ 10.5 Women (%): 64 Race/Ethnicity (%): NR |
| Pinsker 201550 Location: Canada Funding: Foundation |
NRS WOMAC | SAQ, mail | Patients home | Condition: Ankle arthroplasty or arthrodesis Inclusion: Age ≥ 18 years; able to complete survey in English; end-stage ankle arthritis (pre- or post-operative); surgical patients ≥ 6 months post-surgery Exclusion: NR | Baseline pain score(s): NRS pre-op=6.6, range 2-10; NRS post-op= 4.0, range 0-10; WOMAC (overall)=51.4, range 0-95.2 Average intensity: NR Type of pain (%): Arthroplasty=60 Arthrodesis=10 Pre-operative=30 | N=142 N=124 (test/retest) Age (mean, range): 61.2, 22-92 Women (%): 54 Race/Ethnicity (%): NR |
| Scott 201551 Location: United Kingdom Funding: International Association | PGIC | SAQ, written | Pain treatment center | Condition: Chronic pain Inclusion: Significant levels of distress and disability Exclusion: Incomplete data | Baseline pain score(s): NR Average intensity: NR Type of Pain (%): Low back/spine=43.8 Upper shoulder=7.80 Lower limbs=13.30 Other=35.1 | N=476 Age (mean, SD): 46.2, δ 11.2 Women (%): 66.8 Race/Ethnicity (%): White: 71.9 African-Amer./Black: 16.6 Asian: 7.1 Other: 4.4 |
| Sindhu 201152 Location: United States Funding: NS |
NRS VAS-digital VAS | VAS, written and digital NRS, verbal | Hand therapy clinics | Condition: Unilateral musculoskeletal disorder or injury to elbow, forearm, or hand Inclusion: Age 18-65 years; recruited from hand therapy clinics Exclusion: Verbally reported pain intensity > 7 (1-10); unable to perform grip test | Baseline pain score(s): NR Average intensity: (Mean) NRS=<2; VAS=<2mm | N=33 Age (Mean, SD): 39, δ 12.3 Women (%): 48% Race/Ethnicity (%): NR |
| Stewart 200753 Location: Australia Funding: Government |
NRS SF-36 BPS | SAQ, written Baseline; follow up after completion of 6-week treatment period | New-South Wales community, physiotherapy clinics | Condition: Whiplash associated disorders (neck pain) Inclusion: Patients enrolled in RCT (effects of exercise and advice to exercise alone); Motor Accident Authority claimants seeking medical care for whiplash associated disorder (Grades I to III) within 1 month of accident; reported at least “mild” disability compared to pre-injury; significant pain or disability indicated by score of at least 20% on NRS scales or Patient-Specific Functional Scale Exclusion: Previous neck surgery, nerve root compromise, current physical therapy neck treatment | Baseline pain score(s): NR Average intensity: NR | N= 132 Age (mean, SD): 43, δ 14.7 Women (%): 67 Race/Ethnicity (%): NR |
| Stroud 200454 Location: United States Funding: NS | RMDQ (24-, 18-, and 11-item) | SAQ, written | University pain treatment center | Condition: Chronic pain Inclusion: Available RMDQ scale data Exclusion: NR | Baseline pain score(s): NR Average intensity: NR Type of pain (%): Lower back=36.2 Lower extremities=14.1 Head=12.5 Shoulder and arms=9.8 Upper back=4.8 Other=22.6 | N=993 Age (mean, SD): 43.5, δ 12.6 Women (%): 57 Race/Ethnicity (%): White: 84.4 African-Amer./Black: 3 Asian: 2.3 Hispanic: 3.9 Native American: 3.7 Other: 2.7 |
| Tan 200455 Location: United States (Enrolled Veterans) Funding: NS |
BPI RMDQ | SAQ, written Baseline; follow up assessments on subsequent visits | VA chronic pain center | Condition: Chronic pain Inclusion: Completed BPI before initial visit; referred to chronic pain center Exclusion: NR | Baseline pain score(s): NR Average intensity: NR Type of pain (%): Multiple sites (including back)=50 Back only=28 | N=440 Age (mean, SD): 54.9, δ 21-85 Women (%): 8.2 Race/Ethnicity (%): White: 72.3 African-Amer./Black: 21.2 Other: 6.5 |
| Tong 200656 Location: United States Funding: Academic institution | VAS | SAQ, written Baseline; follow up 2nd, 3rd, and 4th visits | University spine care center | Condition: LBP Inclusion: Referred for physical therapy at University spine care facility Exclusion: NR | Baseline pain score(s): (Mean) VAS=5.2mm (δ 2.1mm) Average intensity: NR | N=52 Age (mean, SD): 41.1, δ 12.6 Women (%): 61.5 Race/Ethnicity (%): White: 88 African-Amer./Black: 3 Asian: 3 Other: 6 |
| Trudeau 201557 Location: United States Funding: Industry |
NRS-Now NRS- 24 hours NRS-1 week WOMAC-48 hours | SAQ, written and digital NRS-Now reported 4 times daily, NRS-24 hours reported daily, NRS-1 week reported weekly, WOMAC-48 hours reported every 48 hours | Unclear | Condition: Pain from OA of the knee Inclusion: Age ≥ 21 years; diagnoses of functional classes 1-3 of knee OA; pain intensity on NRS ≤ 6; able to withdraw from OA medications; ≤ 10 on hospital anxiety and depression scale, Exclusion: History of major depressive disorders not controlled with medication | Baseline pain score(s): Treatment-placebo: NRS-24 =3.7 (δ1.22); WOMAC-48=8.6 (2.69); NRS-1 wk =4.2 (δ1.61) Placebo-treatment: NRS-24 =3.9 (δ1.32) WOMAC-48=8.7 (δ2.97); NRS-1 wk =4.4 (δ1.33) Average intensity: NR | N=47 Age (mean, SD): NR Women (%): NR Race/ethnicity (%): NR |
| Van der Roer, 200658 Location: Netherlands Funding: NS | NRS | SAQ, written Baseline; follow up 6, 12, 26, and 52 weeks | Physiotherapy clinics | Condition: LBP Inclusion: Participants in an RCT (comparison of physiotherapy strategies); referred to physiotherapy treatment by physician for new episode of pain. Exclusion: Pregnant; unable to give consent | Baseline pain score(s): NRS (by GPE category) Improved= 6.0 (δ 2.1); Unchanged= 6.4 (δ1.8) Average intensity: NR | N=138 Age (mean, SD): 44.0, δ 13.4 Women (%): 58.7 Race/ethnicity (%): NR |
| van Grootel 200759 Location: Netherlands Funding: International academic research institute | VAS | SAQ, written Baseline (pre-treatment); follow up post-treatment | University medical center | Condition: Myogenous temporomandibular disorders (TMD) Inclusion: Pain and tenderness of the mastication muscles; restricted mandibular opening of 3 months duration or longer; age 18-65 years Exclusion: Clinical and/or radiographic evidence of organic TMJ changes; recent TMD treatment (<1 year); other pain treatment; evidence of serious psychopathology (psychotherapy and/or psychomedication, recent dramatic life events) | Baseline pain score(s): (Mean) VAS=40mm (δ 22.3mm) Average intensity: NR | N=118 Age (mean, range): 31.6, 18-65 Women (%): 93 Race/Ethnicity (%): NR |
| Wittink 200460 Location: United States Funding: Government, Industry |
MPI ODI SF-36 BPS | SAQ, written Baseline; follow up after 3 visits | Medical center pain program | Condition: Chronic pain Inclusion: More than 3 visits to medical center; referred to pain program | Baseline pain score(s): NR Average intensity: NR Type of Pain (%): Back=52.9 Neck=21.8 Myofascial=19.5 | N=87 Age (mean): 46.9 Women (%): 66.5 Race/Ethnicity (%): White: 79.3 Other: 20.7 |
δ=standard deviation
(I)=interference; (S)=severity; BPI=Brief Pain Inventory; CAT= computer adaptive testing (subsequent questions depend on previous response); CDMD= chronic disabling musculoskeletal disorders; CPG=Chronic Pain Grade Questionnaire; IAQ=interview administered questionnaire; LBP=low back pain; MPQ=McGill Pain Questionnaire; MPI=Multidimensional Pain Inventory; MS=multiple sclerosis; NRS=numeric rating scale; NR=not reported; NS=not specified; OA=osteoarthritis arthritis; ODI=Oswestry Disability Index (also known as Oswestry Low Back Pain Disability Questionnaire); PEG=items assess average pain intensity (P), interference with enjoyment of life (E), and interference with general activity (G); PGA=patient global assessment; PGART=patient-rated global assessment of response to therapy; PRGC=patient-reported Global Change; PROMIS-PI=Patient-Reported Outcomes Measurement Information System-Pain Interference; SAQ=self-administered questionnaire; SCAMP=Stepped Care for Affective Disorders and Musculoskeletal Pain; SF-36 BPS=Medical Outcomes Study Short Form-36 Bodily Pain Scale; SF= Short form; RCT=randomized controlled trial; RMDQ=Roland-Morris Disability Questionnaire; VAMC=Veterans Affairs Medical Center; WHYMPI=West Haven-Yale Multidimensional Pain Inventory (see also MPI); WOMAC=Western Ontario and McMaster Universities Arthritis Index
- a
Primary care, pain clinic, etcetera
- b
SCAMP study included RCT of combined depression medication and pain self-management vs usual care in patients with depression of at least moderate severity and observational study in patients with absence of clinical depression; responsive results analyzed separately
- c
William and Myers Version
- d
Stratford and Binkley Version
Supplemental Table 5Outcomes Reported
| Author Year/Scale (range)/Mean time between surveys | OUTCOMES REPORTED | ||||||
|---|---|---|---|---|---|---|---|
| Minimally Important Difference (Describe) | Test-Retest Reliability | Inter-Rater Reliability | Concurrent and/or Criterion Validity | Discriminant and/or Predictive Validity | Responsiveness (Describe) | Other Outcomes | |
| Anagnostis 200420 Scale(s): ODI (0-100) Time: Varied (upon completion of program) | Responsiveness assessed by effect size P<.001 ES=0.95 Mean pre-post treatment change = 14.8, δ 15.6 | ||||||
| Askew 201621 Scale(s): PROMIS-PI (0-66) Time: 12 weeks | Responsiveness assessed using SRMs for PROMIS-PI scores SRM scores ≥0.30 indicated responsiveness Change by “general health” anchor Better=−0.94, δ 7.96 Same=−0.58, δ 7.97 Worse=−0.47, δ 7.18 Change by “pain” anchor Better=−1.09, δ 7.43 Same=−0.26, δ 6.33 Worse=0.44, δ 4.95 | ||||||
| Burnham 201222 Scale(s): MPQ (short form) (pain 0-6), ODI (0-100) Time: 2 weeks (corticosteroid injection); 6-8 weeks (radiofrequency neurotomy or TransDiscal Biacuplasty) | Pearson’s correlation coefficient between mean change 1 month before intervention and day of intervention MPQ r=0.88 (95%CI 0.72, 0.95) ODI r=0.89 (95%CI 0.75, 0.95) | Pre-post treatment responsiveness ratios (RR) (significant RR values >1.96) MPQ RR=1.9 ODI RR=2.3 | |||||
| Changulani 200923 Scale(s): ODI (0-100%), VAS (domain not reported) Time: 6 weeks | Pearson’s correlation coefficient between mean change in ODI scores and mean change in VAS scores r=0.44 (P<.05) | Based on: ES=1.05 Measured by SRM=0.84 | |||||
| Chansirinukor 200524 Scale(s): RM-18 (Shortened version of RMDQ () Time: 12.1 weeks (±0.9) | Minimal detectable change (MDC) for RM-18: 7.5 points | Assessed in subset of patients whose work status had not changed from baseline to follow-up visit ICC=0.68 (95% CI 0.52, 0.79) | RM-18 correlated with change in work status using Spearman’s ρ (0.30; Z=123, P=.02) AUC=0.69 (95%CI=0.60, 0.78) *1=perfect discrimination ES=0.44 (0.37-0.51) SES=0.38 (0.32-0.44) SRM=0.44 (0.37-0.51); paired t= 5.25 | ||||
| Chien 201325 Scale(s): BPI pain intensity items* (4), each item scored 0-10 Time: 10 days *NOTE: 4 BPI items (current pain, worst pain [past 24 hr], least pain [past 24 hr], average pain) used to compute composite average pain | SMRs all participants (improved/unimproved) Current pain: 0.36 (0.89/−0.03) Worst pain: 0.37 (0.63, 0.14) Least pain: 0.17 (0.50, −0.03) Average pain: 0.40 (0.53, 0.28) Composite average pain: 0.42 (0.81/0.10) ROC Current pain: 0.75 Worst pain: 0.66 Least pain: 0.65 Average pain: 0.61 Composite average pain: 0.71 | Internal consistency (Spearman correlation) -moderate/high correlations between BPI composite average pain score and component items: ρ=0.71-0.84, P< .01 -small/moderate correlations between BPI pain items: ρ=0.38-0.65, P<.01 | |||||
| Cook 200826 Scale(s): RMDQ-23- (0-23);11- (0-11); 5- (0-5) Time: Single administration of scale *Data from 2 previously published studies | Correlations between each CAT condition and scores based on RMDQ 23 ranged from 0.93 (5-item) to 0.98 (11-item) Standard error of measurement-based CAT scores correlated 0.95 with RM-MODirt scores | ||||||
| de Vet 200727 Scale(s): NRS (pain intensity) (0-10) Time: 12 weeks | Anchor-based (with global perceived effect) MIC, for chronic pain subjects (n=135):
| Changes in Pl-NRS scores and the global perceived effect categories (Spearman correlation): ρ=0.6 | |||||
| Deyo 201628 Scale(s): PROMIS-PI SF (4-20) Time: 12 weeks | At 3 months:
| PROMIS-PI scores in those
| Change of pain (much less to much worse) at 3 months compared to baseline Pain Interference: ES range: −1.03 (much less) to 0.71 (much worse) SRM range: −1.07 (much less) to 0.74 (much worse) | ||||
| Driban 201529 Scale(s): PROMIS-PI SF (41-78.3), SF-36 BPS (0-100), WOMAC (pain 0-500), WOMAC (function 0-1700) Time: baseline data *Secondary analysis of previously published RCT | Spearman’s correlation coefficient (95%CI) PROMIS-PI/SF-36 BPS: p=-0.73 (−0.79, 0.65) PROMIS-PI/WOMAC Pain: p=0.47 (0.35, 0.57) PROMIS-PI/WOMAC Function: p=0.42 (estimated from Figure 3, confidence interval not provided) | ||||||
| Fisher 199730 Scale(s): ODI (0-100), MPQ (pain 0-6) Time: 15 weeks | Criterion Validity (Kendall’s tau, all P<.01)
| Internal Consistency Cronbach’s alpha ODI=0.76 Effect size for post-treatment change ODI=0.6 MPQ
| |||||
| Gallasch 200731 Scale(s): Wong Faces, VAS (0-10), NRS (0-10) All scales: pain on previous day Time: Same day (pre- and post-physiotherapy) | Before and after physiotherapy session ICC: Faces=0.96 VAS=0.97 NRS=0.99 | Rated easiest to understand:
Most difficult to fill out: VAS 67.8% | |||||
| Gentelle-Bonnassies 200032 Scale(s): VAS (pain, 0-100 mm), WOMAC (pain and function 0-100) Time: 6 months | Based on SRM (95%CI) VAS. Pain, ITT (n=80) Month 1:−0.40 (−0.64, −0.16) Month 3:−0.13 (−0.35, 0.10) Month 6: −0.25 (−0.48, −0.02) WOMAC, Pain, ITT (N=80) Month 1: −0.39 (−0.60, −0.18) Month 3: −0.28 (−0.53, −0.02) Month 6: −0.30 (−0.55, −0.06) WOMAC, Function, ITT (N=80) Month 1:−0.37 (−0.64,−0.10) Month 3: −0.15 (−0.39, 0.09) Month 6: −0.09 (−0.33, 0.14) | ||||||
| Godil 201533 Scale(s): NRS-neck pain, NRS-arm pain (intensity, 0-10) Time: 12 months | Based on SRM Responders: NRS-neck pain=0.95 NRS-arm pain=0.97 Non-responders: NRS-neck pain=0.49 NRS-arm pain=0.38 SRMs in patients reporting meaningful improvement (responders) versus non-responders (greater difference = more responsive scale) Mean change: NRS-neck pain=0.46 NRS-arm-pain=0.59 Based on ROC (AUC) curve NRS-neck pain: AUC=0.69 (poor discriminator) NRS-arm-pain: AUC=0.74 (valid discriminator) | ||||||
| Gronblad 199334 Scale(s): ODQ (0-50), VAS (present pain intensity, 0-100) Time: Subset after 1 week | Subset chosen, n=20, 1 week interval ODQ ICC=0.83 | Pearson’s correlation ODQ/VAS r=0.62 | |||||
| Hicks 200935 Scale(s): ODI (0-100), SF-36 BPS (0-100) Time: Mean 11 days | Standard error of measurement = 4.57 (using data from participants classified as stable) Minimum detectable change ODI: 10.7 points 14.5% scored below 10.7 0% scored above 89.3 | ODI subset of patients with stable LBP status from baseline to follow-up (mean 11 days) ICC 0.92 (95% CI 0.86, 0.95) | “Convergent” ODI/ SF-36 BPS: r=−0.69 (−0.78, −0.60) (P<.0001) | ODI scores significantly different (P<.0001) between groups with and without 1) high pain severity/high functional limitation and 2) chronic pain/high functional limitation (n=107) | |||
| Jensen 201236 Scale(s): VAS (pain intensity, 0-100mm) Time: 12 weeks post-randomization *Data obtained from 2 previously published RCTs | Discriminating active tx from placebo VAS ≥20mm: OR 1.94 (1.37, 2.75) VAS ≥30%: OR 1.97 (1.41, 2.77) VAS ≥50%: OR 2.46 (1.72, 3.50) Agreement between response criteria (kappa)
| ||||||
| Kamper201537 Scale(s): SF-36 BPS (pain only, 0-100), NRS-24hr and NRS-Wk (pain intensity, 0-10) Time: 3, 6, and 12 months *Secondary analysis of data from 3 clinical studies; studies 2 and 3 were chronic pain cohorts | Pearson’s correlation coefficient Study 2*: NRS-24/SF-36 BPS Baseline: r=0.37 3 months: r= 0.71 12 months: r= 0.68 Study 3*: NRS-24/SF-36 BPS Baseline: r= 0.40 3 months: r=0.65 6 months: r=0.66 12 months: r=0.65 NRS-Wk/SF-36 BPS Baseline: r=0.46 3 months: r=0.64 6 months: r=0.72 12 months: r=0.70 NRS-24/NRS-Wk Baseline: r=0.72 3 months: r=0.87 6 months: r=0.90 12 months: r=0.93 | ||||||
| Kean 201638 Scale(s): PROMIS-PI SF (6b) (6 items, total score 6-30), BPI (4 item severity [S], 7 item interference [I], and 11 item total, each item scored 0-10), PEG (severity and interference combined, each item scored 0-10), SF-36 BPS (0-100) Time: 3 months | Responsiveness to intervention (SCOPE trial) (Cohen’s d) BPI-S: 0.37 BPI-I: 0.33 BPI total: 0.38 PEG: 0.35 SF-36 BPS: -0.24 PROMIS-PI-SF: 0.21 AUC (SE) for detecting any improvement BPI-S= 0.73 (0.03) BPI-I= 0.68 (0.04) BPI total= 0.73 (0.03) PEG= 0.71 (0.03) SF-36 BPS= 0.68 (0.04) PROMIS-PI-SF= 0.61 (0.04) AUC (SE) for detecting moderate improvement BPI-S= 0.74 (0.04) BPI-I= 0.69 (0.04) BPI total= 0.74 (0.04) PEG= 0.72 (0.04) SF-36 BPS= 0.64 (0.05) PROMIS-PI-SF= 0.66 (0.04) SRMs significantly different (P<.05) between those who report being better vs stayed the same and those who report being worse vs stayed the same for all BPI scales, PEG, SF-36 BPS, and PROMIS-PI-SF | ||||||
| Keller 200439 Scale(s): BPI-SF (15 items, 4 severity, 7 interference, 4 other), GCPS (7 items, 3 intensity, 4 disability), SF-36 BPS, RMDQ-24 Time: First follow-up visit Note: all results for low back pain group only | Pearson’s r correlations BPI severity and GCPS intensity=0.60 GCPS disability=0.49 RMDQ=0.57 SF-36 BPS=0.61 BPI interference and GCPS intensity=0.64 GCPS disability=0.69 RMDQ=0.64 SF-36 BP=0.64 SF-36 BPS and GCPS intensity=0.47 GCPS disability=0.45 RMDQ=0.53 | Standardized Response Means among improved patients BPI severity=−1.09 BPI interference=−1.13 GCPS intensity=−0.47 GCPS disability=−0.47 SF-36 BPS=0.69 | Internal consistency (Cronbach’s alpha) BPI severity=0.82 BPI interference=0.93 GCPS intensity=0.65 GCPS disability=0.94 RMDQ=0.92 SF-36 BPS=0.84 | ||||
| Kerns 19859 Scale: WHYMPI (pain severity and pain interference), MPQ (Present Pain Intensity, Total Pain Rating Index) Time: 2 weeks | WHYMPI scales Pain severity: r=0.82 Pain interference: r=0.86 | Correlation with a factor related to severity and interference WHYMPI Pain Severity: 0.81 WHYMPI Pain Interference: 0.70 MPQ Total Pain Rating Index: 0.47 MPQ Present Pain Intensity: 0.44 | Internal consistency (Cronbach’s alpha) WHYMPI Pain severity=0.72 Pain interference=0.90 | ||||
| Krebs 201040 Scale(s): BPI (4 item severity [S], 7 item interference [I], and 11 item total, each item scored 0-10), PEG (severity and interference combined, each item scored 0-10), GCPS (3 item intensity [S], 3 item disability [D], 0-10), RMDQ-24 (0-24), SF-36 BPS (0-100) Time: 12 months | Kappa for agreement between one-SEM and global rating classification Observational cohort BPI-S=0.31 BPI-l=0.20 BPI total=0.34 PEG=0.23 GCPS-S=0.27 CGPS-D=0.14 RMDQ-24=0.18 SF-36 BPS=0.27 RCT group BPI-S=0.32 BPI-l=0.24 BPI total=0.29 PEG=0.33 GCPS-S=0.35 GCPS-D=0.27 RMDQ-24=0.36 SF-36 BPS=0.19 | AUC for responsiveness -detecting moderate improvement Observational cohort BPI-S=0.81 (0.04) BPI-l=0.67 (0.05) BPI total=0.76 (0.04) PEG=0.70 (0.05) GCPS-S=0.73 (0.06) GCPS-D=0.66 (0.06) RMDQ-24=0.70 (0.05) SF-36 BPS=0.70 (0.05) RCT group BPI-S=0.85 (0.04) BPI-I= 0.77 (0.05) BPI total=0.81 (0.04) PEG=0.79 (0.04) GCPS-S=0.82 (0.04) CGPS-D=0.76 (0.04) RMDQ-24=0.85 (0.04) SF-36 BPS=0.77 (0.04) Observational cohort Mean SRMs differed significantly between “worse” and “same” groups and between “better” and “same” groups for each measure RCT group Mean SRMs differed significantly between “better” and “same” groups for each measure; values did not differ significantly between “worse” and “same” groups | |||||
| Krebs 200912 Scale(s): BPI (4 item severity [S] and 7 item interference [I]; each item scored 0-10), PEG (severity and interference combined, each item scored 0-10), SF-36 BPS (0-100), GCPS (3 item intensity [S], 3 item disability [D], transformed to 0-100 scores), PGIC (1 item, change in pain, 1-7), RMDQ-24 (0-24) Time: 6 months *Brief Pain Inventory (BPI), Graded Chronic Pain (GCP), RMDQ, and SF-36BPS administered at baseline; BPI, GCP, and patient global rating of change administered at 6 months | Validity (Pearson’s r) PEG/BPI-S: r=0.69 PEG/BPI-I: r=0.89 PEG/GCPS-S: r=0.64; PEG/GCPS-D: r=0.67 PEG/RMDQ-24: r=0.60 PEG/SF-36 BPS: r=−0.61 BPI-S/BPI-I: r=0.58 BPI-S/CPGS-S: r=0.82 BPI-S/CPGS-D: r=0.47 BPI-S/RMDQ-24: r=0.41 BPI-S/SF-36 BPS: r=−0.46 BPI-I/CPGS-S: r=0.62 BPI-I/CPGS-D: r=0.71 BPI-S/RMDQ-24: r=0.70 BPI-S/SF-36 BPS: r=−0.65 | Proportion of pain improvement after 6 months according to PGIC (31.4%) and GCPS (29.5%) - “similar” Improved group (based on PGIC) had mean improvement on PEG of 3 points (δ 2.5) and GCPS of 2.6 points (δ 2.7) - “similar” SRM among improved patients according to PGIC similar for PEG (1.20, 95%CI 0.96, 1.44), BPI-S (1.04, 95%CI0.80, 1.28), and BPI-I (1.13, 95%CI 0.89, 1.37) For all measures of improvement ES and SRM were consistent with large effects | Reliability (internal consistency) – PEG: 0.73 Construct validity “good” PEG: r=0.60-0.89 | ||||
| Krebs 200741 Scale(s): NRS (current pain intensity, 0-10) Time: Single administration of scale | Accuracy of NRS-predicting
| ||||||
| Lovejoy 201242 Scale(s): MPQ-2 SF (22 pain descriptors [6 continuous, 6 intermittent, 6 neuropathic, and 4 affective] each rated 0-10 and total pain score), MPI (severity [S] and interference [I] scales) Time: Single administration of scale | Bivariate correlations using Pearson’s r MPQ-2 SF/ MPI-S: r=0.72 MPQ-2 SF/ MPI-I: r=0.66 | MPQ-2-SF discriminant validity (mean) vs
| Internal consistency reliability (Cronbach’s α) MPQ-2-SF Total score: α =0.96 | ||||
| Lund 200543 Scale(s): VAS (pain intensity, 0-100) Time: Same day | Same day agreement: 20% | ||||||
| Macedo 201144 Scale(s): RMDQ-24 (0-24), RMDQ-18a (0-18), RMDQ-18b (0-18), RMDQ-11 (0-11) Time: 8-12 months | Internal responsiveness assessed using ES (84%CI): RMDQ-24: 0.67 (0.63-0.71) RMDQ-183: 0.75 (0.71-0.79) RMDQ-18b: 0.78 (0.73-0.82) RMDQ-11: 0.65 (0.61-0.69) External responsiveness assessed using AUC values for patients classified as improved and not improved (based on GPE scale): RMDQ-24=0.78 (0.76-0.81) RMDQ-18a=0.78 (0.75-0.81) RMDQ-18b=0.78 (0.75-0.81) RMDQ-11 =0.75 (0.72-0.78) | ||||||
| Maughan 201045 Scale(s): NRS (intensity, 0-10), ODI-2 (0-50), RMDQ-24 (0-24) Time: 5 weeks | MCID (ROC approach) RMDQ-24: 3.5 ODI-2: 7.5 NRS: 4.0 | AUC RMDQ-24: 0.64 ODI-2: 0.67 NRS: 0.5 | |||||
| Merriwether 201646 Scale(s): PROMIS-PI-SF (6b) Time: 2nd visit | Internal Consistency Cronbach’s alpha 0.90 | ||||||
| Mlkail 199347 Scale(s): MPI (interference and pain severity), ODI Time: Same day | MPI Interference correlated with: ODI: 0.66 MPI Pain Severity: 0.55 | ||||||
| Nilsdotter 200348 Scale(s): HOOS (40 items, 10 pain, 5 symptoms, 17 activity limitations [ADL], 4 sport/recreation function, 4 hip-related quality of life, 0-100), WOMAC LK 3.0 (pain, function, 0-20), SF-36 BPS (0-100) Time: 6 months | Spearman’s correlation HOOS (pain)/SF-36 BPS: ρ=0.61 HOOS (ADL)/SF-36 BPS; ρ=0.62 | Responsiveness calculated as SRM after 6 months HOOS(pain)=2.11 WOMAC (pain)=1.83 HOOS (ADL)=1.70 WOMAC (function)=1.70 | |||||
| Parker 201249 Scale(s): VAS-back pain (severity, 0-10), ODI (0-100) Time: 2 years | MCID thresholds (4 anchor-based approaches):
| ||||||
| Pinsker 201550 Scale(s): WOMAC (pain, physical function, 0-20), NRS (pain, 0-10) Time: NS | Mean of 15.5 days (range 4-35) between ICC WOMAC: Overall=0.90 Pain=0.90 Function=0.89 NOTE: limited to individuals who completed retest survey and reported condition to be stable on global change question | Spearman’s rank correlations NRS pain/WOMAC Overall=0.78 Pain=0.78 Function=0.73 | Internal Consistency (Cronbach’s a) WOMAC Overall=0.97 Pain=0.91 Function=0.96 | ||||
| Scott 201551 Scale(s): PGIC (pain, physical function, 1-7) Time: Single administration of scale | Effect sizes computed from pre- to post-treatment (Cohen’s d) Pain=0.56 Physical Function=0.56 | ||||||
| Sindhu 201152 Scale(s): VAS-D (digital, pain level, 1-10), VAS-P (paper, pain level, 1-10), NRS-V (verbal, pain level, 1-10) Time: Administered twice on one visit, before and after grip tests (5-10 minutes apart) Up to 4 grip tests performed (1-minute apart) | ICC (pre-grip): VAS-P 0.96 VAS-D 0.96 NRS-V 1.00 | Concurrent validity measured by Pearson’s r: Pre-grip VAS-D/VAS-P=0.97 NRS-V/VAS-P=0.84 NRS-V/VAS-D=0.84 Post-grip VASD/VAS-P=0.95 NRS-V/VAS-P=0.93 NRS-V/VAS-D=0.93 | Mean score change between pre- and post-grip pain levels: VAS-P=0.40 VAS-D=0.48 NRS-V=0.54 Effect size coefficient (change score average/SD of pre-grip pain score): VAS-P=0.29 VAS-D=0.32 NRS-V=0.37 ANOVA on change scores showed no significant difference in responsiveness among scales: F= 1.36, P<=.25 | ||||
| Stewart, 200753 Scale(s): NRS (pain intensity [1], bothersomeness [B], 1-10), SF-36 BPS (0-100) Time: 6 weeks | Internal responsiveness ES (84% CI): NRS-I= 0.75 (0.61, 0.89) NRS-B=1.17 (1.02, 1.31) SF-36 BPS=0.49 (0.36, 0.61) Subpopulation* NRS-l=1.03 (0.88, 1.18) NRS-B=1.40 (1.24, 1.56) SF-36 BPS=0.72 (0.58, 0.86) SRM (84% CI): NRS-I= 0.64 (0.52, 0.77) NRS-B=0.98 (0.86, 1.10) SF-36 BPS=0.48 (0.35, 0.60) Subpopulation* NRS-I= 0.96 (0.82, 1.10) NRS-B=1.20 (1.06, 1.34) SF-36 BSP=0.71 (0.57, 0.85) *Subpopulation (n=101) participants who improved on GPE scale External responsiveness Pearson’s r for change score and AUC: NRS-I=0.49 (0.68) NRS-B=0.47 (0.70) SF-36 BPS= 0.41 (0.73) | ||||||
| Stroud 200454 Scale(s): RMDQ-24 (0-24), RMDQ-18 (0-18), RMDQ-11 (0-11) Time: Single administration of scale | Intercorrelations among RMDQ 24-, 18-, and 11-item scales P<.01 24/18=0.98 24/11 =0.93 18/11 =0.95 | ||||||
| Tan 200455 Scale(s): BPI (intensity [S], interference [1], 0-10), RMDQ-24 (0-24) Time: Varied (upon follow up visits) | Concurrent validity (Pearson’s r) BPI-l/RMDQ-24 r=0.57 BPI-S/RMDQ-24 r=0.40 | Significant improvement with treatment confirms responsiveness of BPI intensity (S) and interference scales (I) (P<.001) Mean change (Visit 1 to Visit 3): BPI-S 0.93, t=5.33 (P<.001) BPI-I 0.96, t=4.66 (P<.001) | |||||
| Tong 200656 Scale(s): VAS (pain intensity, 0-100mm) Time: Administered at 2nd, 3rd, 4th, and final visits *Patients usually seen 2x/week for physical therapy | Spearman’s rank order correlation (r): early responses at second (r=0.32, P=. 02) third (r=0.34, P=.01), and fourth visits (r=0.62, P<.001) significantly correlated with discharge change in pain Discriminant analysis: early responses (2nd-4th visits) correctly predicted 80.4% of discharge outcomes (P<.001) defined by 30% improvement vs no improvement | ||||||
| Trudeau 201557 Scale(s): NRS-24 hr (pain intensity, 0-10), NRS-1 wk (pain intensity, 0-10), WOMAC (pain 0-20) Time: 4 × daily, 24 hours, 48 hours, 1 week | Differences between treatment and placebo were measured using SES NRS-24hr=0.33, P=.02 WOMAC-48hr=0.54, P=.001 NRS-1 wk=0.38, P=.01 | ||||||
| Van der Roer 200658 Scale(s): NRS (pain intensity, 0-10) Time: 6, 12, 26, and 52 weeks | Chronic pain subgroup results Minimal Clinically Important Difference (MCIC) with NRS using 3 methods:
NRS sensitivity analysis showing range of MCIC results for lowest tertile baseline scores and highest tertile baseline scores: Low scores: 1.5-3.3 High scores 4.5-5.5 | ||||||
| van Grootel 200759 Scale(s): VAS (pain intensity, 0-100mm) Time intervals: 1, 7 and 13 days (diary/SDD); 2-18 months (question-naire/CID) | Smallest detectable difference (SDD) determined by calculating difference between duplicate VAS scores for each subject SDD=49mm (for 13 days – longest interval) | ||||||
| Wittink 200460 Scale(s): SF-36 BPS (0-100), MPI (pain [S] 0-120; interference [I] 0-108), ODI (0-100) Time: After 3 visits | Overlap of the instruments measured using R2 values (≥0.4 is high overlap) MPI-S/ODI=0.43 MPI-I/ODI=0.43 SF-36 BPS/MPI-S=0.58 SF-36 BPS/ODI=0.37 | Responsiveness to change determined by ES from baseline to posttreatment (ES of <0.4 is small, >0.5 moderate, and >0.8 large) MPI-S=−0.41 MPI-I=−0.42 ODI=−0.39 SF 36 BPS=0.44 | |||||
δ=standard deviation; τ=Kendall’s Tau; ρ=Spearman’s rho; r=Pearson’s r
ADL=activities of daily life; AUC=area under curve; BP=bodily pain; BPI=Brief Pain Inventory; CAT= computer adaptive testing; CDMD= chronic disabling musculoskeletal disorders; D=disability; ES=effect size; GCPS=Graded Chronic Pain Scale; GPE=global perceived effect; CPG=Chronic Pain Grade Questionnaire; I=Interference; ICC=Intraclass correlation coefficients; KOOS=Knee Osteoarthritis Outcome Score; MDC=minimal detectable change; MPQ=McGill Pain Questionnaire; NRS=numeric rating scale; ODI=Owestry Disability Index (also known as Oswestry Low Back Pain Disability Questionnaire); PEG=items assess average pain intensity (P), interference with enjoyment of life (E), and interference with general activity (G); PF= physical functioning; PGA=patient global assessment; PI=pain interference; PROMIS-PI=Patient-Reported Outcomes Measurement Information System-Pain Interference; RMDQ=Roland Morris Disability Questionnaire; ROC=receiver operating characteristic curve; S=severity/intensity; SCOPE=Stepped Care to Optimize Pain Care Effectiveness; SE=standard error; SES=standardized effect size; SF-36 BPS=Medical Outcomes Study short form-36 Bodily Pain Scale; SF-MPQ-2=Short Form McGill Pain Questionnaire; SRM=standardized response mean (SRM value 0.2-0.5 = small change, 0.5-0.8 = moderate, and >0.8 = large)
- a
William and Myers version
- b
Stratford and Binkley version
Supplemental Table 6Summary of Minimally Important Difference Outcomes
| Study (ref)/ mode of administration/ (version) | n Condition of pain Time interval | MID equivalent | Approach(es) used to estimate MID equivalent |
|---|---|---|---|
| Studies Estimating MID for More Than One Scale | |||
| Parker 201249 SAQ, on-site | 47 Pseudoarthrosis (revision fusion patients) 2 years | Oswestry Disability Index (range 0-100) Average chanqe approach 8.2 points Minimum detectable chanqe 2.0 points Chanqe difference approach 8.3 points ROC approach 4.0 points VAS (range 0-10) Averaqe chanqe approach 3.2 points Minimum detectable chanqe 2.2 points Chanqe difference approach 2.0 points ROC approach 3.0 points | Distribution and anchor-based Four approaches to MCID:
|
| Krebs 201040 SAQ, on-site Randomized trial | 205 Back, hip, or knee 12 months | SEM BPI (range 0-10) BPI-S: 0.7 BPI-I: 0.7 BPI total: 0.6 PEG (range 0-10): 1.8 CPG intensity (range 0-100): 9.0 CPG disability (range 0-100): 8.7 RMDQ (range 0-24): 1.0 SF-36 BPS (range 0-100): 9.8 | Distribution and anchor-based minimal clinically important chanqe (MCIC) Distribution: Change classified by one-SEM criteria as follows: better score improved ≥1 SEM from baseline, same score change <1 SEM from baseline, and worse score worsened ≥1 SEM. Anchor: Patient-reported retrospective global rating of change (better, about the same, worse) Agreement between anchor and SEM was then examined via weighted kappa statistics. |
| Krebs 201040/ SAQ, on-site Cohort study | 222 Back, hip, or knee 12 months | SEM BPI (range 0-10) BPI-S: 0.8 BPI-I: 0.8 BPI-total: 0.7 PEG (range 0-10): 1.9 CPG intensity (range 0-100): 9.9 CPG disability (range 0-100): 10.3 RMDQ (range 0-24): 1.2 SF-36 BPS (range 0-100): 11.8 | |
| Maughar 201045 SAQ, on-site | 63 (48)a Back 5 weeks | Oswestry Disability Index (range 0-100) Minimum detectable chanqe 16.7 points ROC approach 7.5 points RMDQ (range 0-24) Minimum detectable change 4.9 points ROC approach 3.5 points Numeric Rating Scale (range 0-10) Minimum detectable chanqe 2.4 ROC approach 4 points | Distribution and anchor-based minimal clinically important difference (MCID) Distribution: Minimal detectable change approach, estimated by 1.96 × square root of 2 × SEM test-retest. Anchor: Patient-reported global impression of change (much improved/completely better, unchanged, worse than ever). ROC analysis assessed the ability to distinguish patients who had and had not changed according to patient-reported global impression of change |
| Single Studies by Pain Scale | |||
| Numeric Rating Scale for pain intensity (range 0 to 10) | |||
| de Vet 200727 SAQ, on-site [see van der Roer, same study population] | 135 (chronic) Lower back 12 weeks | ROC approach 3.5 points 95% limit cut-off approach 4.7 points | Distribution and anchor-based: Minimally important chanqe (MIC) Distribution: distribution of the change in scores was plotted on anchor-based a×es and 2 cut-points were applied, ROC and 95% limit Anchor: global perceived effect (completely recovered, much improved, slightly improved, no change, slightly worse, much worse). These were then clustered into 1) importantly improved, 2) not importantly changed, and 3) importantly deteriorated |
| van der Roer 200658 SAQ, on-site | 138 (chronic) Lower back 12 weeks | Minimal detectable chanqe approach 4.5 points Mean chanqe approach 3.7 points Optimal cutoff point approach 2.5 points | Distribution and anchor-based: Minimal Clinicallv Important Chanqe (MCIC)
|
| Oswestry Disability Inde× (range 0 to 100 points) | |||
| Hicks 200935 SAQ, mail (modified) | 107 (56)a Lower back 11 days | 10.7 points | Distribution: minimum detectable chanqe (MDC) SEM determined from participants classified as stable. The SEM was then used to calculate the 90% Cl and then multiplied by the square root of 2, which resulted in an estimate of MID |
| Roland Morris Disability Questionnaire (range 0-24 points) | |||
| Chansirinukor 200524 SAQ, on-site (18-item) | 143 Lower back 3 months | MDC95% 7.5 points | Distribution: minimal detectable chanqe (MDC) 95% Cl of the MDC was estimated by ± square root of 2 × SEM test-retest × 1.96 |
| Visual Analog Scale (range 0 to 100 mm) | |||
| van Grootel 200759 SAQ, on-site | 118 (95-109)a Temporomandibular disorders 2 weeks | 49 mm | Distribution: smallest detectable difference (SDD) Estimated by the standard deviation of the difference values × 1.96 |
BPI=Bodily Pain Inde×; BPS=Bodily Pain Scale: CPG=Chronic Pain Grade Questionnaire (also known as the Graded Chronic Pain Questionnaire); LBP=low back pain; NR=not reported; RMDQ=Roland Morris disability questionnaire; ROC=receiver operating characteristic curve; SAQ=self-administered questionnaire; SEM=standard error of measurement; VAS= visual analog scale;
- a
Post-treatment, no further details
Supplemental Table 7Summary of Responsiveness Outcomes
| Study (ref)/ Mode of administration (version) | N Condition of Pain Time interval | Responsiveness Results | Approach(es) used to estimate Responsiveness |
|---|---|---|---|
| Comparative Studies | |||
| Kean 201638/ Interview, on-site | 250 (244)a Musculoskeletal (moderate) 3 months | AUC, anv improvement BPI-S 0.73; BPI-I 0.68; BPI total 0.73 PEG 0.71 PROMIS-29-Profile PI 0.56; PROMIS-57-Profile PI 0.57; PROMIS-PI Short form 6b 0.61 SF-36 Bodily Pain 0.68 SRMs BPI-S: Worse −0.47; Same 0.13; Better 0.71 BPI-I: Worse 0.03; Same 0.38; Better 0.94 BPI total: Worse −0.22; Same 0.31; Better 0.93 PEG: Worse −0.14; Same 0.25: Better 0.86 PROMIS-29 Profile PI: Worse −0.11; Same 0.29; Better 0.33 PROMIS-57 Profile PI: Worse −0.16; Same 0.30; Better 0.37 PROMIS-PI Short form 6b: Worse −0.02; Same 0.27 Better 0.51 SF-36 Bodily Pain: Worse 0.17; Same −0.38; Better −0.71 SES (ES) BPI-S: 0.38 (Cohen’s d 0.37) BPI-I: 0.37 (Cohen’s d 0.33) BPI total: 0.42 (Cohen’s d 0.38) PEG: 0.37 (Cohen’s d 0.35) PROMIS-29 Profile PI: SES 0.17 (Cohen’s d 0.14) PROMIS-57 Profile PI: SES 0.24 SES 0.42 (Cohen’s d 0.38) PROMIS-PI Short form 6b: SES 0.28 (Cohen’s d 0.21) SF-36 Bodily Pain: −0.25 (Cohen’s d −0.24) | Based on SRM, SES and ES (0.2 is small, 0.5 is medium, and 0.8 is large) and ROC/AUC (0.5 is the same as chance to 1.0 is perfect discrimination). Anchored by patient-reported global change (much better, moderately better, a little better, no change, a little worse, moderately worse, and much worse) |
| Trudeau 201557 SAQ, on-site | 47 Knee OA 1 week |
SES
NRS, 1 week: 0.38 NRS, 24 hours: 0.33 WOMAC-pain, 48 hours: 0.54 | Based on SES of differences in pain scores between treatment and placebo |
| Bumham 201222 SAQ, on-site | 67 Lower back 2-8 weeks | Responsiveness ratios Oswestry Disability Index 2.3; MPQ 1.9 | Based on responsiveness ratio (RR). The RR evaluates intervention-related change over time while considering the between-subject variability in within-subject changes in stable subjects. Significant RR values should be >1.96 |
| Sindhu 201152 SAQ, on-site (paper and digital) | 33 Arm/hand Pre-post gripping | ES VAS-paper 0.29; VAS-digital 0.32 NRS 0.37 | Based on ES of change scores between pre- and post-gripping pain levels |
| Krebs 201040 SAQ, on-site | 427 Back, hip, or knee 12 months | AUC, any improvement BPI-S-cohort 0.83; BPI-S-RCT 0.81 BPI-l-cohort 0.70; BPI-I-RCT 0.78 BPI total-cohort 0.78; BPI total-RCT 0.81 PEG-cohort 0.73; PEG-RCT 0.78 CPG intensity-cohort 0.75, CPG intensity-RCT 0.78 CPG disability-cohort 0.65, CPG disability-RCT 0.75 RMDQ-cohort 0.70: RMDQ-RCT 0.81 SF-36 Bodily Pain-cohort 0.68: SF-36 Bodily Pain-RCT 0.72 SMRs BPI-S-cohort: Worse 0.75; Same 0.08: Better −1.07 BPI-S-RCT: Worse 0.29; Same −0.02; Better −0.99 BPI-I-cohort: Worse 0.43; Same −0.09: Better −0.69 BPI-I-RCT: Worse 0.06; Same −0.50; Better −1.06 BPI total-cohort: Worse 0.63; Same −0.04: Better −0.99 BPI total-RCT: Worse 0.15; Same −0.42; Better −1.15 PEG-cohort: Worse 0.35; Same −0.13; Better −0.83 PEG-RCT: Worse −0.05; Same −0.49; Better −1.14 CPG intensity-cohort: Worse 0.60; Same 0.07; Better −0.68 CPG intensity-RCT: Worse 0.56; Same −0.03; Better −0.73 CPG disability-cohort: Worse 0.37; Same −0.03; Better −0.57 CPG disability-RCT: Worse 0.14; Same −0.25; Better −0.94 RMDQ-cohort: Worse 0.57; Same −0.03; Better −0.67 RMDQ-RCT: Worse 0.35; Same −0.29; Better −1.09 SF-36 Bodily Pain-cohort: Worse −0.58; Same 0.17; Better 0.67 SF-36 Bodily Pain-RCT: Worse −0.17; Same 0.31; Better 0.76 | Based on SRM and ROC/AUC. Anchored by global rating of change at 12 months (worse, same, or better) |
| Maughan 201045 SAQ, on-site | 63 (48)a Back 5 weeks | AUC Oswestry Disability Index 0.67 RMDQ-24 0.64 NRS 0.5 | Based on ROC/AUC. Anchored by patient-reported global impression of change (much improved /completely better, unchanged, worse than ever) |
| Krebs 200912 SAQ, on-site | 210 Back, hip, or knee 6 months | SRM (ES) Global rating of change PEG Improved 1.20 (1.29); Unchanged 0.29 (0.26); Worse −0.06 (−0.06) BPI-severity Improved 1.04 BPI-interference Improved 1.13 Chronic Pain Grade questionnaire PEG Decreased by ≥1 level 0.99 (1.51); Baseline = follow-up 0.29 (0.25); Increased by ≥1 level 0.04 (0.05) | Based on SRM. Anchored by global rating of change (improved, unchanged, worse) and Chronic Pain Grade questionnaire grade (pain grade decreased by ≥1 level, pain grade at baseline = pain grade at follow-up, pain grade increased by ≥1 level) at 6 months |
| Stewart 200753 SAQ, on-site | 134 Chronic whiplash 6 weeks | AUC (Pearson’s r) NRS- pain intensity 0.68 (0.49) NRS- pain bothersomeness 0.70 (0.47) SF-36 Bodily Pain 0.73 (0.41) SRMs (ES) NRS- pain intensity Total cohort 0.64 (0.75); Improved 0.96 (1.03) NRS- pain bothersomeness Total cohort 0.98 (1.17); Improved 1.20 (1.40) SF-36 Bodily Pain Total cohort 0.48 (0.49); Improved 0.71 (0.72) | Based on SRMs, ES, ROC/AUC and Pearson’s r. Anchored by global perceived effect scored on an 11-point numerical rating scale (−5 = vastly worse, 0 = unchanged, 5 = completely recovered) at 6 weeks |
| Keller 200739 SAQ | 131 LBP First follow-up visit | Among improved patients BPI severity=−1.09 BPI interference=−1.13 GCPS intensity=−0.47 GCPS disability=−0.47 SF-36 BPS=0.69 | Based on SRM |
| Wittink 200460 SAQ, on-site | 87 Mostly back and neck NRb | ES MPI-S: −0.41; MPI-I: −0.42 Oswestry Disability Index −0.39 SF-36 Bodily Pain 0.44 | Based on ES of differences between the baseline visit and post-treatment |
| Nilsdotter 200348 SAQ, on-site | 62 OA, hip 6 months | SMRs HOOS pain: All patients 2.11; age ≤66 years 2.60; age >66 years 1.97 HOOS ADL: All patients 1.70; age ≤66 years 2.51; age >66 years 1.52 WOMAC pain: All patients 1.83; age ≤66 years 2.37; age >66 years 1.68 WOMAC function: All patients 1.70; age ≤66 years 2.51; age >66 years 1.52 | Based on SRM |
| Gentelle-Bonnassie 200032 SAQ, on-site and mailed | 80 Knee OA 6 months | SRMs Intent-to-treat VAS Month 1: −0.40; Month 3: −0.13; Month 6: −0.25 WOMAC Pain Month 1: −0.39; Month 3: −0.28; Month 6: −0.30 WOMAC Function Month 1: −0.37; Month 3: −0.15; Month 6: −0.09 | Based on SRM |
| Single Studies by Pain Scale | |||
| Brief Pain Inventory | |||
| Chien 201325 SAQ, on-site | 254 Chronic 10 days | AUC 0.71 BPI composite average SMRs BPI composite average All subjects 0.42; Improved 0.81; Unimproved 0.10 | Based on SRM and ROC/AUC. Anchored by patient-reported rating of pain improvement “Would you say that your pain has improved as a result of your treatment?” (strongly disagree, disagree, neutral, agree, and strongly agree) |
| Tan 200455 SAQ, on-site | 440 Chronic NRb | BPI-S, mean change P <.01 at all visits BPI-I, mean change P <.001 between visits 1 and 2, and visits 1 and 3. NS for visits 2 and 3. | Was assessed by using paired t tests to compare changes in the BPI scale scores across a span of 3 visits. |
| Numeric Rating Scale (range | |||
| Godil 201533 Interview, off-site (neck and arm versions) | 88 Neck and radicular arm 1 year | AUC NRS-neck pain 0.69; NRS-arm-pain 0.74 SRMs Responders, NRS-neck pain 0.95; NRS-arm-pain 0.97 Non-responders NRS-neck pain 0.49; NRS-arm-pain 0.38 | Based on SRM and ROC/AUC. Anchored by Meaningful improvement versus not’ (taken as the “gold standard” or the external criterion) |
| Oswestry Disability Index | |||
| Anagnostis 200420 Unclear, on-site | 230 Chronic disabled musculoskeletal disorder NRb | ES 0.95 | Based on ES through comparison of pre- and post-treatment scores using paired t tests |
| Changulani 200923 SAQ, on-site | 107 Lower back 6 weeks | SRM (ES) 0.84 (1.05) | Based on SRM and ES. Anchored by reported change in symptoms (much better, better, same, worse, much worse) |
| Patient Global Impression of Change | |||
| Scott 201551 unclear, on-site | 476 Back, upper body, other | ES Pain: 0.56 Physical function: 0.56 | Based on within subject ES of differences between pre- and post-treatment means |
| PROMIS PI | |||
| Askew 201621 SAQ, on-site | 218 (175)a Lower back 3 months | SRMs Better −1.09; Same −0.26; Worse 0.44 | Based on SRM. SRM ≥ 0.30 indicated responsiveness. Anchored by self-reported magnitude of changes (better, same, or worse) in overall pain scores |
| Deyo 201628 Interview, written survey | 198 Musculoskeletal 3 months | SRM (ES) Pain interference Much better −1.07 (−1.03); Slightly better −0.29 (−0.28); Same −0.08 (−0.08); Slightly worse 0.18 (0.17); Much worse 0.74 (0.71) | Based on SRM and ES. Anchored by patient-reported global change (much better, slightly better, same, slightly worse, and much worse) |
| Roland Morris Disability Questionnaire | |||
| Macedo 201144 SAQ, on-site (24, 18-itemwillams and Myers (WM), 18-itemStratford and Binkley (SB), 11-item) | 461 Lower back Up to 1 year | AUC (cut-off of ≥3 qlobal perceived effect units) 24-item 0.78; 18-itemWM 0.78; 18-itemSB 0.78; 11-item 0.75 ES 24-item 0.67; 18-itemWM 0.75; 18-itemSB 0.78; 11-item 0.65 GRI 24-item 1.55; 18-itemWM 1.49; 18-itemSB 1.52; 11 -item 1.30 | Based on ES, Guyatt’s responsiveness index (GRI, calculated by dividing the mean change of patients who have improved by the standard deviation of change of patients reporting no improvement) and ROC/AUC. Anchored by global perceived effect (cut-off of 3 units was used to identify patients that improved and did not improve) |
| Chansirinukor 200524 SAQ, on-site (18-item) | 143 Lower back 3 months | AUC 0.69 SRM (ES) 0.44 (0.44) SES 0.38 | Based on SRM, SES, ES, and ROC/AUC Anchored by work status (working preinjury duties, full time; working preinjury duties, part-time or working other duties, full-time; working other duties, part time; and not working) |
ES=effect size; HOOS=Hip Disability and Osteoarthritis Outcome Score; LBP=low back pain; MCID=minimum clinically important difference; MPQ=McGill Pain Questionnaire; NR=not reported; ROC=receiver operating characteristic curve (AUC area under the curve); SAQ=self-administered questionnaire; SEM=standard error of measurement; SES=standardized effect sizes; SRM=standardized response mean; VAS= visual analog scale; WOMAC=Western Ontario and McMaster Universities Osteoarthritis Index
- a
Available at follow-up
- b
Post-treatment, no further details
References
- 1.
- Cleeland CS, Ryan KM. Pain assessment: global use of the Brief Pain Inventory. Ann Acad Med Singapore. 1994;23(2):129–138. [PubMed: 8080219]
- 2.
- Buckenmaier CC, 3rd, Galloway KT, Polomano RC, McDuffie M, Kwon N, Gallagher RM. Preliminary validation of the Defense and Veterans Pain Rating Scale (DVPRS) in a military population. Pain Med. 2013;14(1):110–123. [PubMed: 23137169]
- 3.
- Hawker GA, Mian S, Kendzerska T, French M. Measures of adult pain: Visual Analog Scale for Pain (VAS Pain), Numeric Rating Scale for Pain (NRS Pain), McGill Pain Questionnaire (MPQ), Short-Form McGill Pain Questionnaire (SF-MPQ), Chronic Pain Grade Scale (CPGS), Short Form-36 Bodily Pain Scale (SF-36 BPS), and Measure of Intermittent and Constant Osteoarthritis Pain (ICOAP). Arthritis Care Res. 2011;63 Suppl 11:S240–252. [PubMed: 22588748]
- 4.
- Von Korff M, Ormel J, Keefe FJ, Dworkin SF. Grading the severity of chronic pain. Pain. 1992;50(2):133–149. [PubMed: 1408309]
- 5.
- Klassbo M, Larsson E, Mannevik E. Hip disability and osteoarthritis outcome score: An extension of the Western Ontario and McMaster Universities Osteoarthritis Index. Scand J Rheumatol. 2003;32:46–51. [PubMed: 12635946]
- 6.
- Roos EM, Lohmander LS. The Knee injury and Osteoarthritis Outcome Score (KOOS): from joint injury to osteoarthritis. Health Qual Life Outcomes. 2003;1:64. [PMC free article: PMC280702] [PubMed: 14613558]
- 7.
- Burckhardt CS, Jones KD. Adult Measures of Pain: The McGill Pain Questionnaire (MPQ), Rheumatoid Arthritis Pain Scale (RAPS), Short-Form McGill Pain Questionnaire (SFMPQ), Verbal Descriptive Scale (VDS), Visual Analog Scale (VAS), and West Haven-Yale Multidisciplinary Pain Inventory (WHYMPI). Arthritis Rheum. 2003;49(5S):S96–S104.
- 8.
- McCaffery M, Beebe A. Pain: Clinical Manural for Nursing Practice. St. Louis, MO: Mosby, 1989.
- 9.
- Kerns RD, Turk DC, Rudy TE. The West Haven-Yale Multidimensional Pain Inventory (WHYMPI). Pain. 1985;23(4):345–356. [PubMed: 4088697]
- 10.
- Smeets R, Koke A, Lin CW, Ferreira M, Demoulin C. Measures of function in low back pain/disorders: Low Back Pain Rating Scale (LBPRS), Oswestry Disability Index (ODI), Progressive Isoinertial Lifting Evaluation (PILE), Quebec Back Pain Disability Scale (QBPDS), and Roland-Morris Disability Questionnaire (RDQ). Arthritis Care Res. 2011;63 Suppl 11:S158–173. [PubMed: 22588742]
- 11.
- Farrar JT, Young JP, Jr., LaMoreaux L, Werth JL, Poole RM. Clinical importance of changes in chronic pain intensity measured on an 11-point numerical pain rating scale. Pain. 2001;94(2):149–158. [PubMed: 11690728]
- 12.
- Krebs EE, Lorenz KA, Bair MJ, et al Development and initial validation of the PEG, a three-item scale assessing pain intensity and interference. J Gen Intern Med. 2009;24(6):733–738. [PMC free article: PMC2686775] [PubMed: 19418100]
- 13.
- Pain Interference: A brief guide to the PROMIS Pain Interference instruments. 2015. Available at: https://www
.assessmentcenter .net/documents /PROMIS%20Pain%20Interference %20Scoring%20Manual.pdf; Accessed 1 August 2017. - 14.
- Cella D, Riley W, Stone A, et al The Patient-Reported Outcomes Measurement Information System (PROMIS) developed and tested its first wave of adult self-reported health outcome item banks: 2005-2008. J Clin Epidemiol. 2010;63(11):1179–1194. [PMC free article: PMC2965562] [PubMed: 20685078]
- 15.
- Roland MO, Morris RW. A study of the natural history of back pain. Part 1: Development of a reliable and sensitive measure of disability in low back pain. Spine 1983; 8: 141–144. [PubMed: 6222486]
- 16.
- Ware JE, Jr., Gandek B. Overview of the SF-36 Health Survey and the International Quality of Life Assessment (IQOLA) project. J Clin Epidemiol. 1998;51(11):903–912. [PubMed: 9817107]
- 17.
- Wewers ME, Lowe NK. A critical review of visual analogue scales in the measurement of clinical phenomena. Res Nurs Health. 1990;13(4):227–236. [PubMed: 2197679]
- 18.
- American College of Rheumatology. Western Ontario and McMaster Universities Osteoarthritis Index (WOMAC). Available at: http://www
.rheumatology .org/I-Am-A/Rheumatologist /Research/Clinician-Researchers /Western-Ontario-McMaster-Universities-Osteoarthritis-Index-WOMAC, Accessed 1 August 2017. - 19.
- Wong-Baker FACES® History. Available at: http:
//wongbakerfaces .org/us/wong-baker-faces-history/, Accessed 1 August 2017. - 20.
- Anagnostis C, Gatchel RJ, Mayer TG. The pain disability questionnaire: a new psychometrically sound measure for chronic musculoskeletal disorders. Spine. 2004;29(20):2290–2302. [PubMed: 15480144]
- 21.
- Askew RL, Cook KF, Revicki DA, Cella D, Amtmann D. Evidence from diverse clinical populations supported clinical validity of PROMIS pain interference and pain behavior. J Clin Epidemiol. 2016;73:103–111. [PMC free article: PMC4957699] [PubMed: 26931296]
- 22.
- Burnham R, Stanford G, Gray L. An assessment of a short composite questionnaire designed for use in an interventional spine pain management setting. PM R. 2012;4(6):413–418. [PubMed: 22732153]
- 23.
- Changulani M, Shaju A. Evaluation of responsiveness of Oswestry low back pain disability index. Arch Orthop Trauma Surg. 2009;129(5):691–694. [PubMed: 18521617]
- 24.
- Chansirinukor W, Maher CG, Latimer J, Hush J. Comparison of the functional rating index and the 18-item Roland-Morris Disability Questionnaire: responsiveness and reliability. Spine. 2005;30(1):141–145. [PubMed: 15626994]
- 25.
- Chien CW, Bagraith KS, Khan A, Deen M, Strong J. Comparative responsiveness of verbal and numerical rating scales to measure pain intensity in patients with chronic pain. J Pain. 2013;14(12):1653–1662. [PubMed: 24290445]
- 26.
- Cook KF, Choi SW, Crane PK, Deyo RA, Johnson KL, Amtmann D. Letting the CAT out of the bag: comparing computer adaptive tests and an 11-item short form of the Roland-Morris Disability Questionnaire. Spine. 2008;33(12):1378–1383. [PMC free article: PMC2671199] [PubMed: 18496352]
- 27.
- de Vet HC, Ostelo RW, Terwee CB, et al Minimally important change determined by a visual method integrating an anchor-based and a distribution-based approach. Qual Life Res. 2007;16(1):131–142. [PMC free article: PMC2778628] [PubMed: 17033901]
- 28.
- Deyo RA, Katrina R, Buckley DI, et al Performance of a Patient Reported Outcomes Measurement Information System (PROMIS) Short Form in older adults with chronic musculoskeletal pain. Pain Med. 2016;17(2):314–324. [PMC free article: PMC6281027] [PubMed: 26814279]
- 29.
- Driban JB, Morgan N, Price LL, Cook KF, Wang C. Patient-Reported Outcomes Measurement Information System (PROMIS) instruments among individuals with symptomatic knee osteoarthritis: a cross-sectional study of floor/ceiling effects and construct validity. BMC Musculoskelet Disord. 2015;16:253. [PMC free article: PMC4570513] [PubMed: 26369412]
- 30.
- Fisher K, Johnston M. Validation of the Oswestry Low Back Pain Disability Questionnaire, its sensitivity as a measure of change following treatment and its relationship with other aspects of the chronic pain experience. Physiother Theory Pract. 1997;13:67–80.
- 31.
- Gallasch CH, Alexandre NM. The measurement of musculoskeletal pain intensity: a comparison of four methods. Rev Gaucha Enferm. 2007;28(2):260–265. [PubMed: 17907648]
- 32.
- Gentelle-Bonnassies S, Le Claire P, Mezieres M, Ayral X, Dougados M. Comparison of the responsiveness of symptomatic outcome measures in knee osteoarthritis. Arthritis Care Res. 2000;13(5):280–285. [PubMed: 14635296]
- 33.
- Godil SS, Parker SL, Zuckerman SL, Mendenhall SK, McGirt MJ. Accurately measuring the quality and effectiveness of cervical spine surgery in registry efforts: determining the most valid and responsive instruments. Spine J. 2015;15(6):1203–1209. [PubMed: 24076442]
- 34.
- Gronblad M, Hupli M, Wennerstrand P, et al Intercorrelation and test-retest reliability of the Pain Disability Index (PDI) and the Oswestry Disability Questionnaire (ODQ) and their correlation with pain intensity in low back pain patients. Clin J Pain. 1993;9:189–195. [PubMed: 8219519]
- 35.
- Hicks GE, Manal TJ. Psychometric properties of commonly used low back disability questionnaires: are they useful for older adults with low back pain? Pain Med. 2009;10(1):85–94. [PMC free article: PMC5323267] [PubMed: 19222773]
- 36.
- Jensen MP, Schnitzer TJ, Wang H, Smugar SS, Peloso PM, Gammaitoni A. Sensitivity of single-domain versus multiple-domain outcome measures to identify responders in chronic low-back pain: pooled analysis of 2 placebo-controlled trials of etoricoxib. Clin J Pain. 2012;28(1):1–7. [PubMed: 21705875]
- 37.
- Kamper SJ, Grootjans SJ, Michaleff ZA, Maher CG, McAuley JH, Sterling M. Measuring pain intensity in patients with neck pain: does it matter how you do it? Pain Pract. 2015;15(2):159–167. [PubMed: 24433369]
- 38.
- Kean J, Monahan PO, Kroenke K, et al Comparative responsiveness of the PROMIS Pain Interference Short Forms, Brief Pain Inventory, PEG, and SF-36 Bodily Pain Subscale. Med Care. 2016;54(4):414–421. [PMC free article: PMC4792763] [PubMed: 26807536]
- 39.
- Keller S, Bann CM, Dodd SL, Schein J, Mendoza TR, Cleeland CS. Validity of the Brief Pain Inventory for use in documenting the outcomes of patients with noncancer pain. Clin J Pain. 2004;20:309–318. [PubMed: 15322437]
- 40.
- Krebs EE, Bair MJ, Damush TM, Tu W, Wu J, Kroenke K. Comparative responsiveness of pain outcome measures among primary care patients with musculoskeletal pain. Med Care. 2010;48(11):1007–1014. [PMC free article: PMC4876043] [PubMed: 20856144]
- 41.
- Krebs EE, Carey TS, Weinberger M. Accuracy of the pain numeric rating scale as a screening test in primary care. J Gen Intern Med. 2007;22(10):1453–1458. [PMC free article: PMC2305860] [PubMed: 17668269]
- 42.
- Lovejoy TI, Turk DC, Morasco BJ. Evaluation of the psychometric properties of the revised short-form McGill Pain Questionnaire. J Pain. 2012;13(12):1250–1257. [PMC free article: PMC3513374] [PubMed: 23182230]
- 43.
- Lund I, Lundeberg T, Sandberg L, Budh CN, Kowalski J, Svensson E. Lack of interchangeability between visual analogue and verbal rating pain scales: a cross sectional description of pain etiology groups. BMC Med Res Methodol. 2005;5:31. [PMC free article: PMC1274324] [PubMed: 16202149]
- 44.
- Macedo LG, Maher CG, Latimer J, Hancock MJ, Machado LA, McAuley JH. Responsiveness of the 24-, 18- and 11-item versions of the Roland Morris Disability Questionnaire. Eur Spine J. 2011;20(3):458–463. [PMC free article: PMC3048224] [PubMed: 21069545]
- 45.
- Maughan EF, Lewis JS. Outcome measures in chronic low back pain. Eur Spine J. 2010;19:1484–1494. [PMC free article: PMC2989277] [PubMed: 20397032]
- 46.
- Merriwether EN, Rakel BA, Zimmerman MB, et al Reliability and construct validity of the Patient-Reported Outcomes Measurement Information System (PROMIS) Instruments in women with fibromyalgia. Pain Med. 2016. [PMC free article: PMC6279305] [PubMed: 27561310]
- 47.
- Mikail SF, DuBreuil S, D’eon JL. A Comparative Analysis of Measures Used in the Assessment of Chronic Pain Patients. Psychol Assess. 1993;5(1):117–120.
- 48.
- Nilsdotter AK, Lohmander LS, Klassbo M, Roos EM. Hip disability and osteoarthritis outcome score (HOOS)--validity and responsiveness in total hip replacement. BMC Musculoskelet Disord. 2003;4:10. [PMC free article: PMC161815] [PubMed: 12777182]
- 49.
- Parker SL, Adogwa O, Mendenhall SK, et al Determination of minimum clinically important difference (MCID) in pain, disability, and quality of life after revision fusion for symptomatic pseudoarthrosis. Spine J. 2012;12(12):1122–1128. [PubMed: 23158968]
- 50.
- Pinsker E, Inrig T, Daniels TR, Warmington K, Beaton DE. Reliability and validity of 6 measures of pain, function, and disability for ankle arthroplasty and arthrodesis. Foot Ankle Int. 2015;36(6):617–625. [PubMed: 25652665]
- 51.
- Scott W, McCracken LM. Patients’ impression of change following treatment for chronic pain: global, specific, a single dimension, or many? J Pain. 2015;16(6):518–526. [PubMed: 25746196]
- 52.
- Sindhu BS, Shechtman O, Tuckey L. Validity, reliability, and responsiveness of a digital version of the visual analog scale. J Hand Ther. 2011;24(4):356–363. [PubMed: 21820864]
- 53.
- Stewart M, Maher CG, Refshauge KM, Bogduk N, Nicholas M. Responsiveness of pain and disability measures for chronic whiplash. Spine. 2007;32(5):580–585. [PubMed: 17334294]
- 54.
- Stroud MW, McKnight PE, Jensen MP. Assessment of self-reported physical activity in patients with chronic pain: development of an abbreviated Roland-Morris disability scale. J Pain. 2004;5(5):257–263. [PubMed: 15219257]
- 55.
- Tan G, Jensen MP, Thornby JI, Shanti BF. Validation of the Brief Pain Inventory for chronic nonmalignant pain. J Pain. 2004;5(2):133–137. [PubMed: 15042521]
- 56.
- Tong HC, Geisser ME, Ignaczak AP. Ability of early response to predict discharge outcomes with physical therapy for chronic low back pain. Pain Pract. 2006;6(3):166–170. [PubMed: 17147593]
- 57.
- Trudeau J, Van Inwegen R, Eaton T, et al Assessment of pain and activity using an electronic pain diary and actigraphy device in a randomized, placebo-controlled crossover trial of celecoxib in osteoarthritis of the knee. Pain Pract. 2015;15(3):247–255. [PubMed: 24494935]
- 58.
- van der Roer N, Ostelo RW, Bekkering GE, van Tulder MW, de Vet HC. Minimal clinically important change for pain intensity, functional status, and general health status in patients with nonspecific low back pain. Spine. 2006;31(5):578–582. [PubMed: 16508555]
- 59.
- van Grootel RJ, van der Bilt A, van der Glas HW. Long-term reliable change of pain scores in individual myogenous TMD patients. Eur J Pain. 2007;11(6):635–643. [PubMed: 17118682]
- 60.
- Wittink H, Turk DC, Carr DB, Sukiennik A, Rogers W. Comparison of the redundancy, reliability, and responsiveness to change among SF-36, Oswestry Disability Index, and Multidimensional Pain Inventory. Clin J Pain. 2004;20(3):133–142. [PubMed: 15100588]
Prepared for: Department of Veterans Affairs, Veterans Health Administration, Quality Enhancement Research Initiative, Health Services Research & Development Service, Washington, DC 20420. Prepared by: Evidence-based Synthesis Program (ESP) Center, Minneapolis VA Health Care System, Minneapolis, MN, Timothy J. Wilt, MD, MPH, Director, Nancy Greer, PhD, Program Manager
Suggested citation:
Goldsmith ES, Murdoch M, Taylor B, Greer N, MacDonald R, McKenzie LG, Rosebush C, Wilt TJ. Rapid Evidence Review: Measures for Patients with Chronic Musculoskeletal Pain. VA ESP Project #09-009; 2017.
This report is based on research conducted by the Evidence-based Synthesis Program (ESP) Center located at the Minneapolis VA Health Care System, Minneapolis, MN, funded by the Department of Veterans Affairs, Veterans Health Administration, Office of Research and Development, Quality Enhancement Research Initiative. The findings and conclusions in this document are those of the author(s) who are responsible for its contents; the findings and conclusions do not necessarily represent the views of the Department of Veterans Affairs or the United States government. Therefore, no statement in this article should be construed as an official position of the Department of Veterans Affairs. No investigators have any affiliations or financial involvement (eg, employment, consultancies, honoraria, stock ownership or options, expert testimony, grants or patents received or pending, or royalties) that conflict with material presented in the report.
Created: August 2017.
- NLM CatalogRelated NLM Catalog Entries
- PMCPubMed Central citations
- PubMedLinks to PubMed
- Rapid Evidence Review: Measures for Patients with Chronic Musculoskeletal PainRapid Evidence Review: Measures for Patients with Chronic Musculoskeletal Pain
Your browsing activity is empty.
Activity recording is turned off.
See more...