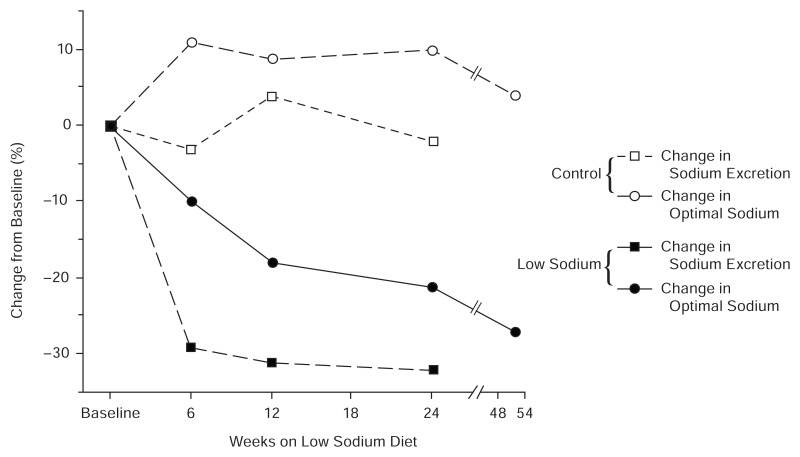
From: 3, Taste and Flavor Roles of Sodium in Foods: A Unique Challenge to Reducing Sodium Intake

Strategies to Reduce Sodium Intake in the United States.
Institute of Medicine (US) Committee on Strategies to
Reduce Sodium Intake; Henney JE, Taylor CL, Boon CS, editors.
Washington (DC): National Academies Press (US); 2010.
Copyright © 2010, National Academy of
Sciences.
NCBI Bookshelf. A service of the National Library of Medicine, National Institutes of Health.
