NCBI Bookshelf. A service of the National Library of Medicine, National Institutes of Health.
FDA-NIH Biomarker Working Group. BEST (Biomarkers, EndpointS, and other Tools) Resource [Internet]. Silver Spring (MD): Food and Drug Administration (US); 2016-. Co-published by National Institutes of Health (US), Bethesda (MD).

BEST (Biomarkers, EndpointS, and other Tools) Resource [Internet].
Show detailsA variety of factors influence a patient’s clinical outcome, including intrinsic characteristics of the patient, disease, or medical condition, and the effects of any treatments that the patient receives. Some of the intrinsic characteristics may be reflected as prognostic biomarkers, i.e., biomarkers used to identify likelihood of a clinical event, disease recurrence or progression in patients who have the disease or medical condition of interest, and others as predictive biomarkers, i.e., biomarkers used to identify individuals who are more likely than similar individuals without the biomarker to experience a favorable or unfavorable effect from exposure to a medical product or an environmental agent. Prognostic biomarkers and predictive biomarkers cannot generally be distinguished when only patients who have received a particular therapy are studied. Some biomarkers are both prognostic and predictive. Prognostic biomarkers are often identified from observational data and are regularly used to identify patients more likely to have a particular outcome.
To identify a predictive biomarker, there generally should be a comparison of a treatment to a control in patients with and without the biomarker. However, there are circumstances in which preclinical and early clinical data provide such compelling evidence that a new treatment will not work in patients without the biomarker that definitive clinical trials are performed only in populations enriched for the putative predictive biomarker. An illustration of such a situation was the development of the BRAF inhibitor vemurafenib for treatment of patients with late-stage melanoma that is positive for the BRAF V600E mutation.
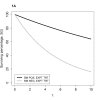
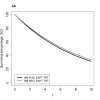
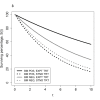
Distinguishing prognostic biomarkers and predictive biomarkers can be difficult, as the following examples illustrate. Considering a simple example involving a survival outcome and binary biomarker, Figure 1A illustrates how a difference in survival distribution associated with biomarker status for patients who received an experimental therapy might be misinterpreted as evidence that patients who are biomarker positive receive greater benefit from that therapy, in the absence of survival curves for patients receiving standard or no therapy. In this and subsequent figures, assume that patients have been randomized to receive either the experimental or standard therapy. Superimposing onto the survival curves in Figure 1A a new pair of survival curves reflecting the outcomes of patients who received a standard therapy reveals that the same survival differences according to biomarker status exist with standard therapy (Figure 1B). Therefore, the biomarker illustrated in Figures 1A and 1B is prognostic but not predictive and will not be helpful in choosing between standard and experimental therapy. In contrast, Figure 2A illustrates a scenario in which the biomarker might at first appear to not provide information useful in deciding whether to administer the experimental therapy, but with full analysis the biomarker is predictive. The biomarker is a negative prognostic biomarker as seen in the poorer survival in Figure 2B in patients who are positive for the biomarker and are given standard treatment. Figure 2B leads to the correct conclusion that the biomarker is indeed predictive because patients who are biomarker positive (and do worse on standard therapy) have a clear benefit from the experimental therapy and do as well as biomarker negative patients on that therapy. There is no difference in survival on the two treatments for patients who are biomarker negative.
Additional considerations may apply when evaluating the clinical utility of a predictive biomarker for selecting between two therapy options. Figure 3 depicts a situation in which the experimental therapy leads to better survival for both the biomarker positive and negative patients, albeit with different magnitude of benefit. Unless toxicity or other costs overshadow the survival benefits experienced in one of the subgroups, it is likely that the experimental therapy would be preferred over the standard therapy for all patients and the biomarker might not be useful for selecting between these two treatments. In statistical terms, Figure 3 conveys the concept of a quantitative treatment-by-biomarker interaction. Figure 4 illustrates an ideal type of predictive biomarker in which there is a clear benefit of the experimental treatment in one biomarker subgroup (positive) but a clear lack of benefit, or potentially even slight harm, from the experimental therapy in the other biomarker subgroup (negative). This reflects the statistical concept of a qualitative treatment-by-biomarker interaction; such biomarkers may be particularly useful for treatment selection.
- Understanding Prognostic versus Predictive Biomarkers - BEST (Biomarkers, Endpoi...Understanding Prognostic versus Predictive Biomarkers - BEST (Biomarkers, EndpointS, and other Tools) Resource
- LOC104633294 [Balearica regulorum gibbericeps]LOC104633294 [Balearica regulorum gibbericeps]Gene ID:104633294Gene
Your browsing activity is empty.
Activity recording is turned off.
See more...


