Included under terms of UK Non-commercial Government License.
NCBI Bookshelf. A service of the National Library of Medicine, National Institutes of Health.
Cookson R, Asaria M, Ali S, et al. Health Equity Indicators for the English NHS: a longitudinal whole-population study at the small-area level. Southampton (UK): NIHR Journals Library; 2016 Sep. (Health Services and Delivery Research, No. 4.26.)

Health Equity Indicators for the English NHS: a longitudinal whole-population study at the small-area level.
Show detailsThis appendix reports on our prototype national equity indicators for CHD. We have analysed three indicators:
- CHD1: primary care quality for CHD
- CHD2: emergency hospitalisation for CHD
- CHD3: mortality from CHD.
This appendix is divided into three sections: (1) indicator definitions, (2) graphical results, and (3) discussion.
Coronary heart disease indicator definitions
CHD1: primary care quality – blood pressure and cholesterol control in coronary heart disease patients
Definition
This indicator measures primary care quality for people with CHD. We use a weighted average of the following two indicators as defined in the QOF: (1) the proportion of people with CHD in whom the last blood pressure reading (measured in the preceding 12 months) was 150/90 mmHg or less; and (2) the proportion of people with CHD whose last measured cholesterol concentration (measured in the preceding 12 months) was 5 mmol/l or less. The numerator for (1) is the number of people with CHD who were within the limit for blood pressure, and for (2) is the number of people with CHD who were within the limit for cholesterol control. The denominator in both cases is the total number of people in each practice who were registered as having CHD. An importance-weighted average based on estimated mortality reduction impact (see below for details) of (1) and (2) was taken to measure performance on this indicator.
Technical details
General practitioner practices record the number of patients with CHD who are listed in their practice registers. Blood pressure and cholesterol control in CHD patients are two of the quality indicators in QOF. The denominator is the number of patients registered as having CHD, and who were not exception reported by the practice, while the numerator is the number of CHD patients for whom (1) blood pressure and (2) cholesterol control target was met. A weighted average of (1) and (2) was calculated, with weights based on the Public Health Impact score for each indicator, as calculated by Ashworth et al.,85 based on available evidence on mortality reduction.
We use reported achievement which excludes exception-reported patients from the population denominator. We do not standardise this indicator, as factors such as the age and sex distribution in the GP practice population are not legitimate justifications for variation in GP performance on this indicator.
CHD2: emergency hospitalisation for coronary heart disease
Definition
Emergency hospitalisation for CHD is defined as the number of people per 1000 population having one or more emergency hospitalisations for CHD, adjusting for age and sex. This is an indicator of the performance of primary care and the interface between primary and secondary care.
The numerator is the number of people with CHD-related emergency hospital admissions (both finished and unfinished admission episodes, excluding transfers). This is derived from the HES APC, provided by the HSCIC.
The denominator is the total number of people alive at mid-point in the current financial year. The ONS mid-year England population estimates for the respective calendar years are used for this purpose.
Technical details
This indicator measures the rate of CHD-related emergency hospital admissions per 1000 people, adjusted for age and sex. Hospital admissions for all ages, including young children and people aged > 75 years, for all ICD-10 codes I20–I125 for ischaemic heart disease are included in this indicator. We focus on patients with one of these codes in the primary diagnosis field. Only two of these codes are included in the NHS Outcomes Framework list of ‘preventable’ emergency hospitalisations: I20 for ‘angina pectoris’ and I25 for ‘chronic ischaemic heart disease’. However, we also include codes I21, I22 and I23 which represent ‘acute myocardial infarction’, ‘subsequent myocardial infarction’ and ‘certain current complications following acute myocardial infarction’. We include these additional codes (1) for more complete coverage of CHD, (2) for greater consistency with the companion indicator of mortality for CHD, and (3) because there is at least some evidence that multidisciplinary health-care interventions can reduce emergency admissions for these broader aspects of CHD. However, to avoid confusion with the NHS Outcomes Framework list we label this as ‘emergency hospitalisation for CHD’ rather than ‘preventable hospitalisation’.
We calculate indirectly standardised emergency hospital admission rate for CHD for each small area to allow for differing age and sex structure by deprivation level. To do so, we start with individual-level HES data on CHD emergency admissions and aggregate up to small-area level. We then compute the expected hospitalisation counts for each small area by applying national age–sex hospitalisation rates to small-area-level numbers of people in each age–sex group. We then compute the adjusted rate for each small area as the product of the ratio of observed over expected count for the small area and the national rate. We then compute the adjusted count for each small area as adjusted rate times the small-area population. Finally, we aggregate up this adjusted count to quantile group level to present adjusted count per 1000 people in each quantile group.
CHD3: amenable mortality – mortality from coronary heart disease, age and sex adjusted
Definition
Amenable mortality from CHD is defined as the number of deaths from CHD per 1000 population, allowing for age and sex. The numerator is the number of people who died in the current financial year because of CHD. The denominator is the total number of people aged < 75 years alive at the mid-point in the current financial year, from ONS mid-year population estimates.
Technical details
Amenable mortality from CHD was defined according to all the ICD-10 codes I20–I25, which are listed in the ONS list of causes of death considered amenable to health care. CHD is one of the conditions that has a clear link between the number of deaths and health-care interventions. In line with the ONS specification of avoidable mortality from CHD, an age limit of 0–74 years is applied to both the numerator and denominator. This is because identification of the underlying cause of death after age 75 years becomes increasingly unreliable.
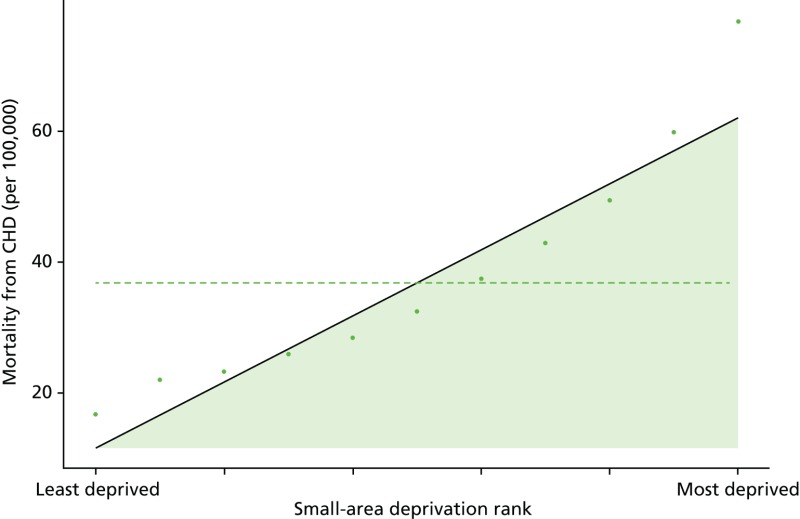
We calculate indirectly standardised amenable mortality rate from CHD for each small area to allow for differing age and sex structure by deprivation level, as described in Chapter 4. In brief, we start with individual-level ONS mortality data and aggregate up to small-area level. We then compute the expected number of deaths in each small area by applying national age–sex mortality rates to small-area-level numbers of people in each age–sex group. We then compute the adjusted rate for each small area as the product of the national rate and the ratio of observed over expected. For visualisation purposes, we then aggregate to quantile group level.
Graphical results for coronary heart disease indicators
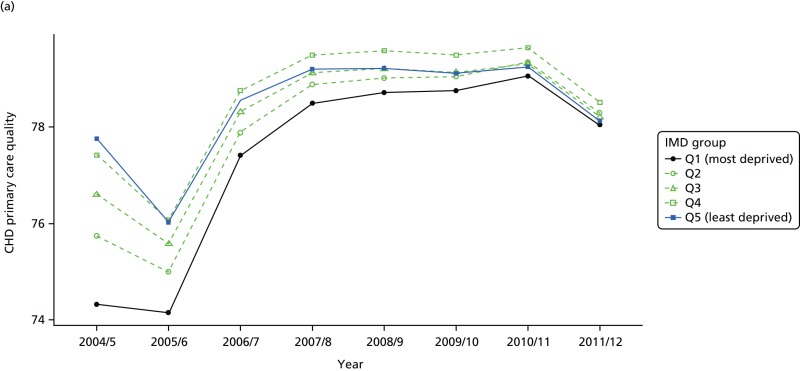
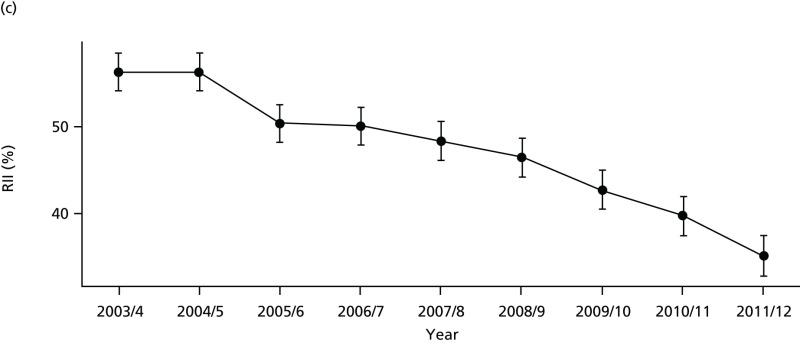
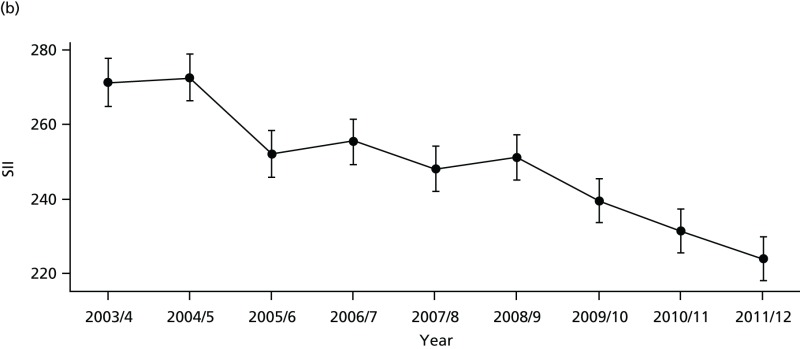
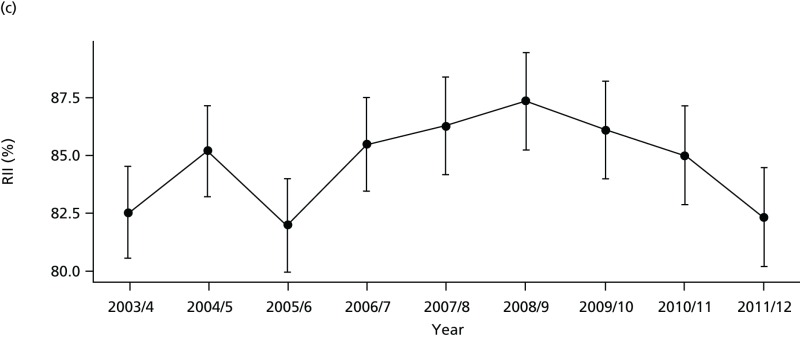
FIGURE 65
Equity time trend in CHD primary care quality. Notes: (1) the solid black line shows the most deprived quintile and the solid blue line shows the least deprived quintile; (2) negative SII indicates pro-poor distribution, while a positive SII indicates a pro-rich distribution in absolute terms; and (3) negative RII indicates pro-poor distribution, while a positive RII indicates a pro-rich distribution in relative terms.
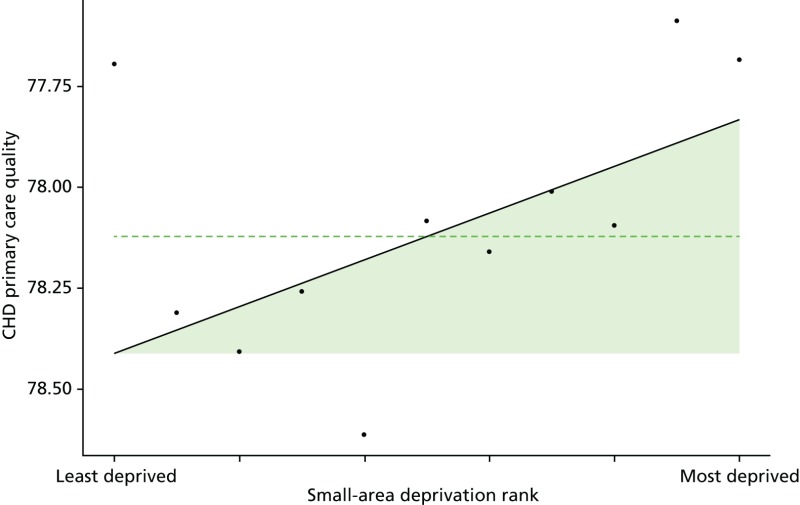
FIGURE 66
National social gradient in CHD primary care quality in 2011/12. Notes: (1) Dots represent decile groups; (2) the slope of the line is the SII; and (3) the shaded area shows the inequity gap.
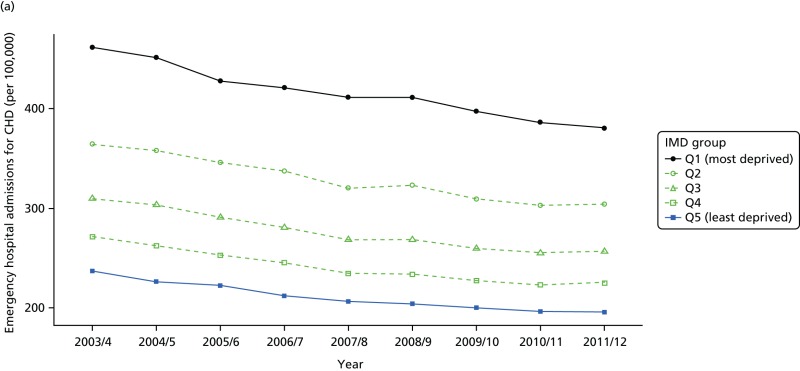
FIGURE 67
Unadjusted equity time trend in emergency hospitalisation for CHD. Notes: (1) the solid black line shows the most deprived quintile and the solid blue line shows the least deprived quintile; (2) negative SII indicates pro-poor distribution, while a positive SII indicates a pro-rich distribution in absolute terms; and (3) negative RII indicates pro-poor distribution, while a positive RII indicates a pro-rich distribution in relative terms.
FIGURE 68
Adjusted equity time trend in emergency hospitalisation for CHD. Notes: (1) the solid black line shows the most deprived quintile and the solid blue line shows the least deprived quintile; (2) negative SII indicates pro-poor distribution, while a positive SII indicates a pro-rich distribution in absolute terms; and (3) negative RII indicates pro-poor distribution, while a positive RII indicates a pro-rich distribution in relative terms.
FIGURE 69
National social gradient in emergency hospitalisation for CHD in 2011/12. Notes: (1) dots represent decile groups; (2) the slope of the line is the SII; and (3) the shaded area shows the inequity gap.
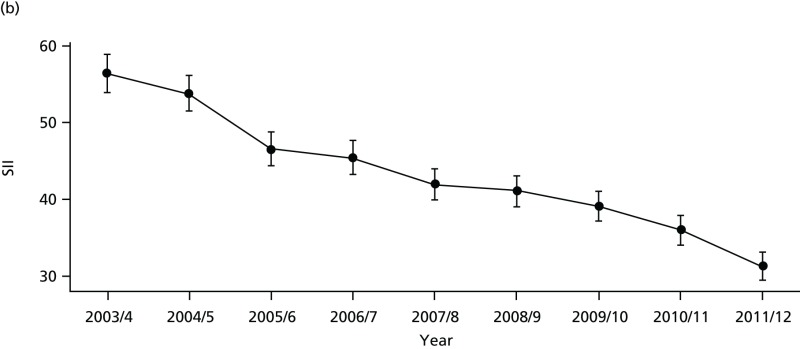
FIGURE 70
Unadjusted equity time trend in mortality from CHD. Notes: (1) the solid black line shows the most deprived quintile and the solid blue line shows the least deprived quintile; (2) negative SII indicates pro-poor distribution, while a positive SII indicates a pro-rich distribution in absolute terms; and (3) negative RII indicates pro-poor distribution, while a positive RII indicates a pro-rich distribution in relative terms.
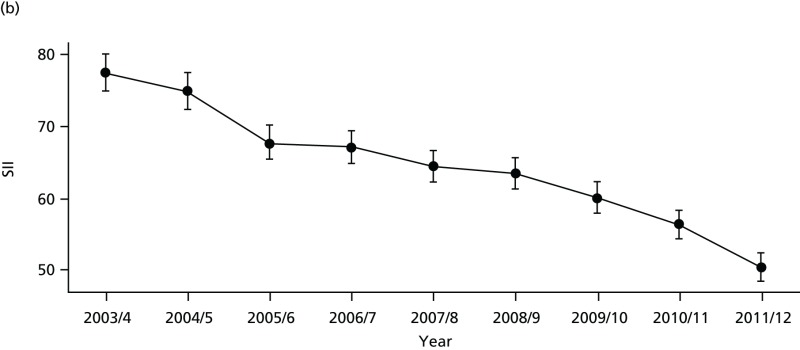
FIGURE 71
Adjusted equity time trend in mortality from CHD. Notes: (1) the solid black line shows the most deprived quintile and the solid blue line shows the least deprived quintile; (2) negative SII indicates pro-poor distribution, while a positive SII indicates a pro-rich distribution in absolute terms; and (3) negative RII indicates pro-poor distribution, while a positive RII indicates a pro-rich distribution in relative terms.
Discussion of coronary heart disease indicator findings
The basic pattern of our CHD findings is an improvement in average quality and a reduction in absolute inequality between 2001 and 2011. This pattern is entirely in line with our general findings for primary care quality, preventable hospitalisation and amenable mortality, although the improvements and absolute inequality reductions are even larger. However, as with the general indicators, these reductions in absolute inequality do not translate into improvements in relative inequality in the case of hospitalisation and mortality because the mean level of CHD hospitalisation and mortality is falling fast.
- Prototype coronary heart disease indicators - Health Equity Indicators for the E...Prototype coronary heart disease indicators - Health Equity Indicators for the English NHS: a longitudinal whole-population study at the small-area level
Your browsing activity is empty.
Activity recording is turned off.
See more...
