NCBI Bookshelf. A service of the National Library of Medicine, National Institutes of Health.

Rachaneni S, McCooty S, Middleton LJ, et al.; on behalf of the Bladder Ultrasound Study (BUS) Collaborative Group. Bladder ultrasonography for diagnosing detrusor overactivity: test accuracy study and economic evaluation. Southampton (UK): NIHR Journals Library; 2016 Jan. (Health Technology Assessment, No. 20.7.)

Appendix 10Incremental cost-effectiveness scatterplots and cost-effectiveness acceptability figures

FIGURE 65. Scatterplot showing the uncertainty in costs and clinical effectiveness (DO cases detected) for all strategies.

FIGURE 65

Scatterplot showing the uncertainty in costs and clinical effectiveness (DO cases detected) for all strategies.

Figures

FIGURE 52. Incremental cost-effectiveness scatterplot of UDS vs.

FIGURE 52

Incremental cost-effectiveness scatterplot of UDS vs. clinical history for women successfully treated.

FIGURE 53. Cost-effectiveness acceptability frontier for the comparison between UDS and clinical history for the case of women successfully treated.

FIGURE 53

Cost-effectiveness acceptability frontier for the comparison between UDS and clinical history for the case of women successfully treated.

FIGURE 54. Incremental cost-effectiveness scatterplot of UDS vs.

FIGURE 54

Incremental cost-effectiveness scatterplot of UDS vs. clinical history for QALYs.

FIGURE 55. Cost-effectiveness acceptability frontier for the comparison between UDS and clinical history for the case of QALYs.

FIGURE 55

Cost-effectiveness acceptability frontier for the comparison between UDS and clinical history for the case of QALYs.

FIGURE 56. Incremental cost-effectiveness scatterplot of UDS vs.

FIGURE 56

Incremental cost-effectiveness scatterplot of UDS vs. clinical history for DO cases detected.

FIGURE 57. Cost-effectiveness acceptability frontier for the comparison between UDS and clinical history for the case of DO cases detected.

FIGURE 57

Cost-effectiveness acceptability frontier for the comparison between UDS and clinical history for the case of DO cases detected.

FIGURE 58. Cost-effectiveness plane showing the mean cost and clinical effectiveness (women successfully treated) for all strategies.

FIGURE 58

Cost-effectiveness plane showing the mean cost and clinical effectiveness (women successfully treated) for all strategies.

FIGURE 59. Scatterplot showing the uncertainty in costs and effectiveness (women successfully treated) for all strategies.

FIGURE 59

Scatterplot showing the uncertainty in costs and effectiveness (women successfully treated) for all strategies.

FIGURE 60. Cost-effectiveness acceptability frontier for the comparison between UDS, clinical history and bladder ultrasonography in MUI and clinical history and UDS in MUI for the case of women successfully treated.

FIGURE 60

Cost-effectiveness acceptability frontier for the comparison between UDS, clinical history and bladder ultrasonography in MUI and clinical history and UDS in MUI for the case of women successfully treated.

FIGURE 61. Cost-effectiveness plane showing the mean cost and clinical effectiveness (QALYs) for all strategies.

FIGURE 61

Cost-effectiveness plane showing the mean cost and clinical effectiveness (QALYs) for all strategies.

FIGURE 62. Scatterplot showing the uncertainty in costs and effectiveness (QALYs) for all strategies.

FIGURE 62

Scatterplot showing the uncertainty in costs and effectiveness (QALYs) for all strategies.

FIGURE 63. Cost-effectiveness acceptability frontier for the comparison between UDS, clinical history and bladder ultrasonography in MUI and clinical history and UDS in MUI for the case of QALYs.

FIGURE 63

Cost-effectiveness acceptability frontier for the comparison between UDS, clinical history and bladder ultrasonography in MUI and clinical history and UDS in MUI for the case of QALYs.

FIGURE 64. Cost-effectiveness plane showing the mean cost and clinical effectiveness (DO cases detected) for all strategies.

FIGURE 64

Cost-effectiveness plane showing the mean cost and clinical effectiveness (DO cases detected) for all strategies.

FIGURE 66. Cost-effectiveness acceptability frontier for the comparison between UDS, clinical history and bladder ultrasonography in MUI and clinical history and UDS in MUI for the case of DO cases detected.

FIGURE 66

Cost-effectiveness acceptability frontier for the comparison between UDS, clinical history and bladder ultrasonography in MUI and clinical history and UDS in MUI for the case of DO cases detected.

FIGURE 67. Population EVPI for the main outcome measure (primary analysis).

FIGURE 67

Population EVPI for the main outcome measure (primary analysis).

FIGURE 68. Population EVPI for the main outcome measure (secondary analysis).
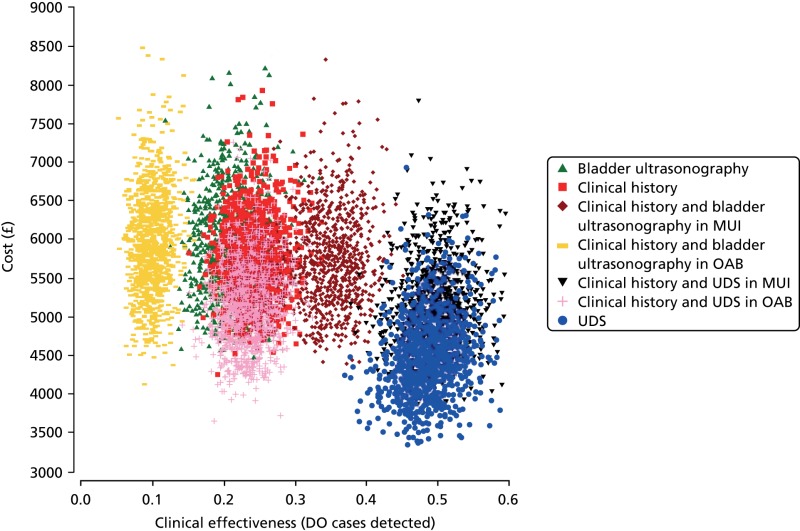
FIGURE 68

Population EVPI for the main outcome measure (secondary analysis).

Copyright © Queen’s Printer and Controller of HMSO 2016. This work was produced by Rachaneni et al. under the terms of a commissioning contract issued by the Secretary of State for Health. This issue may be freely reproduced for the purposes of private research and study and extracts (or indeed, the full report) may be included in professional journals provided that suitable acknowledgement is made and the reproduction is not associated with any form of advertising. Applications for commercial reproduction should be addressed to: NIHR Journals Library, National Institute for Health Research, Evaluation, Trials and Studies Coordinating Centre, Alpha House, University of Southampton Science Park, Southampton SO16 7NS, UK.

Included under terms of UK Non-commercial Government License.

Bookshelf ID: NBK338655