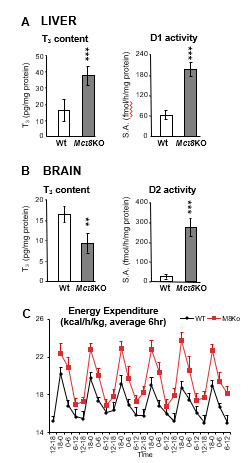
Figure 12. . Data from Mct8KO vs Wt mice.

Figure 12.

Data from Mct8KO vs Wt mice. A. T3 content and D1 enzymatic activity in liver. B. T3 content and D2 enzymatic activity in brain. Data from Mct8KO mice are represented as grey bars and those from Wt littermates are in open bars. ** p-value <0.01, *** p-value <0.001. C. Total energy expenditure (TEE) flow chart represented as 6h average over 6 days, Mct8KO mice are shown in red.

From: Impaired Sensitivity to Thyroid Hormone: Defects of Transport, Metabolism, and Action

Cover of Endotext
Endotext [Internet].
Feingold KR, Anawalt B, Blackman MR, et al., editors.
South Dartmouth (MA): MDText.com, Inc.; 2000-.
Copyright © 2000-2024, MDText.com, Inc.

This electronic version has been made freely available under a Creative Commons (CC-BY-NC-ND) license. A copy of the license can be viewed at http://creativecommons.org/licenses/by-nc-nd/2.0/.

NCBI Bookshelf. A service of the National Library of Medicine, National Institutes of Health.