

NCBI Bookshelf. A service of the National Library of Medicine, National Institutes of Health.
Feingold KR, Anawalt B, Blackman MR, et al., editors. Endotext [Internet]. South Dartmouth (MA): MDText.com, Inc.; 2000-.

ABSTRACT
The evidence for social and environmental factors that contribute to obesity are often underappreciated. Obesity prevalence is significantly associated with sex, racial ethnic identity, and socioeconomic status, which creates complex relationships between each of these characteristics. Food availability remains an important factor associated with obesity that relates to differences in prevalence seen across geographical areas and higher rates of obesity within low socioeconomic status individuals. Proliferation of high calorie, energy dense food options that are or perceived as more affordable combined with reductions in occupational and transportation related physical activity can contribute to a sustained positive energy balance. Additionally, environments experiencing deprivation, disorder, or high crime have been shown to be associated with higher odds of obesity, which may appear more frequently in low social status individuals. Both objective and subjective measures of social status and inequality are associated with increased energy intake and decreased energy expenditure, which could place individuals of low social status at greater risk for obesity development. Given the complexity of this multifactorial disease, effective obesity care requires knowledge of these complex relationships and an integration between the health systems and surrounding community. Resources for practicing clinicians regarding methods of screening for social and environmental factors in clinical care are provided in addition to information on a program that has been widely dispersed and made accessible to those who may be the most at risk. For complete coverage of all related areas of Endocrinology, please visit our on-line FREE web-text, WWW.ENDOTEXT.ORG.
INTRODUCTION
Many medical providers appreciate the significant social and environmental determinants of obesity but are unsure how to address them. Others consider these factors outside of their control and scope of practice, and are thus hesitant to even broach the topic with their patients. Finally, many medical providers still attribute obesity to causes within a person’s control, such as dietary choices, amount of exercise, or willpower, (1, 2) which perpetuates a stigma that accompanies this disease. Specifically, the prevailing stigma is that those who suffer from obesity represent a population who lack the willingness to change their poor lifestyle habits or harbor a character flaw that, at its extreme, infers immoral behaviors (e.g., gluttony). In reality, obesity is a multifactorial disease (3) that is caused by a combination of biological, genetic, social, environmental, and behavioral determinants. In order to address this gap in the understanding of the social and environmental determinants of obesity and improve the care of patients with obesity, this chapter will review the evidence for the social and environmental determinants of obesity development. The specific areas to be covered include social identity, social status, societal trends, and influences of the built, industrial, and social environments, all factors that are closely associated with the prevalence or incidence of obesity or that impact efforts to prevent and treat this disease. Resources for the busy clinician that will support implemental changes in one’s practice to improve the care and management of patients with obesity, as well as evidenced-based opportunities for advocacy in the community, will be included in the final section.
This chapter is divided into three primary sections based on the progression of thought and evidence surrounding the social and environmental determinants of obesity: individual characteristics, environmental characteristics, and social hierarchy influences. Individual characteristics are those that are attributed to the individual with obesity such as their sex, age, race, ethnicity, and socioeconomic status (SES). Environmental characteristics surround the individual, including the physical spaces where people live, work, and play, as well as sociocultural norms. The social hierarchy refers to social status or social rank of individuals within larger society or a local community.
INDIVIDUAL CHARACTERISTICS
The prevalence of obesity varies according to key individual characteristics such as age, sex, race and ethnicity, and SES. The prevalence of obesity increases cross-sectionally across the lifespan: from 13.9%, in early childhood (2-5 years old) to 18.4% in childhood (6-11 years old), 20.6% in adolescence (12-19 years old), 35.7%, in young adulthood (20-39 years old), 42.8% in adulthood (40-59 years old), and 41.0% in older adulthood (≥60 years old) (4). As of 2016, the prevalence of adult obesity in women in the United States was 41.1% and in men was 37.9% (4). In the decade between 2007-2008 and 2015-2016, obesity significantly increased only in women (4), suggesting a sex-specific vulnerability to expression of this disease. Additionally, when race and ethnicity are considered, significant interactions between race and sex emerge. Non-Hispanic black, non-Hispanic Asian, and Hispanic women all have significantly higher prevalence of obesity than men with the same racial ethnic identity (5). In men and women, non-Hispanic Asians have significantly lower prevalence of obesity compared to all other major races and ethnicities in the United States (Note: not adjusted for ethnic specific cut points for Asians), and Non-Hispanic blacks and Hispanics have significantly higher prevalence of obesity compared to Non-Hispanic whites (5). It is not fully clear why differences in obesity prevalence by race and ethnicity are present, but some evidence points to differences in genetic backgrounds that affect body composition and fat distribution (6, 7), and to differences in cultural body image standards (8). Additionally, in the United States, race and ethnicity are confounded with SES, which is one of the most potent indicators of overall health in the United States (9).
A significantly greater proportion of underrepresented racial ethnic minorities are considered low SES compared to non-Hispanic Asians and non-Hispanic whites in the United States. Socioeconomic status is a composite measure that can be represented by measures of income, educational attainment, or occupational status. In the 2017 Census, 21.2% of non-Hispanic blacks and 18.3% of Hispanics lived below the poverty level compared to 8.7% of non-Hispanic whites and 10% of non-Hispanic Asians (10). Non-Hispanic Asians (53.9%) and non-Hispanic whites (36.2%) are more likely to earn a bachelor’s degree than non-Hispanic blacks (22.5%) and Hispanics (15.5%) (11). In terms of health, low SES in childhood is associated with adult development of cardiovascular risk factors and a 20% increase in the odds of having central obesity (as defined by a waist circumference >102 cm for men or > 88 cm for women) (12). In adult women, obesity prevalence increases with decreasing income and educational attainment; however, in non-Hispanic black women, obesity prevalence differs by education gradients but not by income gradients (13). Conversely, non-Hispanic black men have a higher prevalence of obesity in the highest income group, but all the men’s racial ethnic groups showed similar relationships between obesity rates and education gradients as women (13). Higher SES is also associated with healthy lifestyle behaviors that are often the first line of prevention or treatment for obesity. On the other hand, low SES is associated with less leisure time physical activity (14) and consumption of energy-dense diets that are nutrient poor (15); however, SES is not the only factor that influences these behaviors. Further exploration of how SES affects resources and the ability to practice healthy behaviors is expounded upon in the next section.
ENVIRONMENTAL CHARACTERISTICS
Geography
Obesity prevalence differs by geographical region in the United States with the South and the Midwest having the highest level of obesity among adults (16). The Midwest and South also have high rates of diabetes and metabolic syndrome, which frequently accompany obesity (16). Approximately 55% of global increases in BMI can be attributed to rising BMI in rural areas, and this may be as high as 80% in low- and middle-income countries (17). Rural areas are associated with 1.36 higher odds of obesity compared to urban areas; however, mediation analysis shows that individual educational attainment, neighborhood median household income, and neighborhood-built environment features reduce these odds by 94% and render the relationship statistically insignificant (18). Rural areas tend to have farther distances between residences and supermarkets, clinical settings, and recreational opportunities, which may be impacting the ability to practice healthy behaviors that prevent obesity. This is one example of the “built environment”, which alludes to the infrastructure of a geographic area that influences proximity to and types of resources, transportation methods, and neighborhood quality.
Food Availability
The frequency and type of food vendors in a neighborhood determines the types of foods that residents can purchase. Historically, evidence has suggested that fast food restaurant density is associated with obesity prevalence. A state-level analysis of fast food restaurant density and the number of residents per restaurant accounted for 6% of the variance in state obesity prevalence (19). Individual-level factors can interact with built environmental factors (like fast food restaurant density) to increase the odds of obesity. For example, one study in older adults showed that residents who ate 1-2 times per week at a fast food restaurant (odds ratio [OR]: 1.878), did not meet current physical activity guidelines (OR: 1.792), had low self-efficacy for eating healthy food (OR: 1.212), or identified as non-Hispanic black (OR: 8.057) and lived in a high density fast food neighborhood were more likely to have obesity than older adults who lived in a low density fast food neighborhood (20). On the other hand, recent research suggests that fast food restaurant density is not associated with obesity prevalence and the food consumed in these establishments’ accounts for less than 20% of the total energy intake (21). This could reflect the widespread availability of fast food nationally, which weakens the ability to dissect links between its presence and increased consumption specific to obesity.
The term “food desert” is often used to describe areas with limited access to affordable and nutritious food (e.g. supermarkets) and these vary significantly according to neighborhood socioeconomic and racial/ethnic composition (22, 23). Food desert designation has been positively linked to obesity in the United States and simply switching from a non-food desert census tract to a food desert census tract can increase the odds of obesity by 30%, when all other relevant factors are held constant (24). Conversely, access to supermarkets does not automatically result in healthier eating behavior and weight status. A systematic review showed that five out of six studies looking at supermarket access did not find increased fruit and vegetable consumption with greater accessibility; however, four out of five studies looking at changes in weight status found lower BMI and prevalence of obesity in areas with high access to supermarkets compared to low access areas (25). A large natural experiment found that the opening of a new supermarket improved overall diet quality in the neighborhood, but did not affect fruit and vegetable intake or BMI (26). Interestingly, the only positive outcome directly associated with regular use of the new supermarket was higher perceived access to healthy food (26). Although these findings are mixed, it is important to acknowledge that changes in food choices at a neighborhood level might occur too slowly to be captured in these studies.
In addition to food availability and quality, the shift in food type, amount, and pricing is also relevant to the obesity epidemic. For example, available evidence strongly supports a greater risk of weight gain and type 2 diabetes with increased consumption of sugar-sweetened beverages (27). North America still has the highest per capita sales of calorie sugar-sweetened beverages, but is slowly starting to shift to low-calorie sugar sweetened beverages, though sports and energy drink consumption continue to increase (28). Portion sizes in the most popular fast-food, take-out, and family style restaurants exceed current USDA and FDA standard-recommended portion amounts as well as what had been historically served in past decades (29). Increased portion sizes have been robustly linked to increases in energy intake in both adults and children; however, evidence is limited that decreasing portion size results in decreased energy intake (30). In addition, fast foods, snack foods, and foods available through convenience stores are typically ultra-processed (high in processed grains and added sugars; low in fiber and unsaturated fats). A recent study found that keeping macronutrient content the same, meals that were ultra-processed resulted in greater food intake and weight gain over a two-week follow-up compared to consumption of non-processed foods (31). Contributing to increased intake of fast-foods and ultra-processed foods is the marketing techniques implemented by food industries across multiple mediums. Though adults have shown to be less susceptible to the effects of food advertising, experimental studies with children produce a moderate effect size for increased food consumption after food advertising exposure (32). Food advertising targeted at children is focused on brand building and emotive messages may not be discerned as such by this vulnerable population (33). Another common misconception confronting consumers is that healthy foods are more expensive, but research suggests this perception is based on misleading price metrics as well as changes in fruit and vegetable convenience and level of preparedness (34). Price per calorie metrics show fruits and vegetables to be more expensive than less healthy foods; however, price per average portion and price per edible 100 grams actually shows that fruits and vegetables are less expensive (34). In times of financial constraint, socioeconomically disadvantaged groups maximize energy value for money resulting in energy-dense, nutrient poor diets that contribute to obesity (35).
Transportation
Infrastructure can dictate means of transportation and neighborhood walkability, which is associated with weight status. High neighborhood walkability has been found to be associated with decreased prevalence of overweight and obesity (36), which can link back to structural differences discussed earlier between urban and rural areas (urban areas having higher walkability). Transport-related physical activity decreased by 17.8% between 1965 and 2009 in the United States, which could be due to growing ubiquity of car ownership and supportive infrastructure for automotive transport in the United States (37). Proximity to recreational facilities, recreational facility density, access to sidewalks and paths that remove pedestrians from traffic hazards, and access to parks, have all been reported to be facilitators of physical activity in qualitative and quantitative research (38, 39).
The quality of infrastructure in a neighborhood and the perceived aesthetics of homes, shops, and recreational facilities can impact the use of these facilities. A study in a high-income neighborhood and a low-income neighborhood showed that even though the number of recreational facilities was equitable in the neighborhoods, the residents of the low-income neighborhood perceived that they had less access to recreational facilities (40).
Additional neighborhood descriptors that are associated with obesity include neighborhood deprivation, disorder, and crime. Neighborhood deprivation, a composite score of socioeconomic position of individuals in a neighborhood that is used to assign a rank to that neighborhood, shows that high levels of deprivation are associated with a 20% increased odds of overweight (41). Neighborhood physical disorder refers to the presence of vandalism, abandoned lots or vehicles, garbage, and quality of building conditions. Women in an urban area with high neighborhood physical disorder have a 1.43 greater odds of obesity (42). Persons living in areas of high crime have a 28% reduced odds of achieving higher levels of physical activity and, conversely, perceived safety increases the odds of achieving higher levels of physical activity by 27% (43). Living in a neighborhood with high crime has been found to be associated with increased weekly snack consumption in women (42). The relevance of the neighborhood environment to obesity is further exemplified in the Moving to Opportunities Study (44). The Department of Housing and Urban Development randomly assigned just under 5000 families in Chicago, Baltimore, Boston, Los Angeles, and New York public housing to 3 possible conditions: receive a housing voucher to move to a low-poverty census track with moving counseling, receive a standard unrestricted housing voucher and no moving counseling, or receive nothing. Despite the fact that this study was not focused on weight or diabetes outcomes, participants that received the voucher to move to a low-poverty census track had 4.61 percentage points lower prevalence of BMI > 35, BMI > 40, and glycated hemoglobin ≥ 6.5% than participants who received nothing (44), showing that a mere change in environment from high- to low-poverty rates was enough to have a significant impact.
Work Environment and Advances in Communication Technology
As the built environment and food environment have changed in the United States, so has the work environment. From 1960 to 2010, jobs in the U.S. private industry shifted from 50% requiring at least moderate to vigorous physical activity to less than 20% requiring this level of activity intensity (45). National Health and Nutrition Examination Survey data has documented an association between decreases in work-related energy expenditure and weight gain over the same time period (45). These changes in occupation related physical activity could be due to improvements in labor-saving technology. Technology advances are not confined to the work environment and have spread into many facets of daily life, such as improvements in smart personal communication devices, internet media platforms, marketing techniques, and enhanced audio-visual media. Studies show that marketing for unhealthy foods is often targeted at more vulnerable populations such as Non-Hispanic blacks (46) and Hispanics (47). Additionally, the availability of information about healthy weight-loss behaviors on the internet is poor when searched for in Spanish (48). “Screen time” or the time spent using technology that utilizes a screen interface has been found to be associated with increased risk for obesity (49-51); however, many app companies and academic researchers are now using that same technology to help with obesity prevention and treatment (52-54).
SOCIAL HIERARCHY
Animal research consistently shows that animals of subordinate status experience adverse physiological and behavioral changes compared to their high status counterparts: higher levels of cortisol (primates) (55), elevated blood pressure (rats, rabbits, baboons, macaques) (56), elevated heart rate (primates) (56), accumulation of visceral fat (rats) (57), increased ad-libitum energy-dense food consumption (macaques, rats) (57, 58), cardiovascular disease (mice) (59), and shortened lifespan (mice) (59). This implies that social standing, regardless of species, has physiological implications and could be contributing to obesity development and poor health. The findings from animal models thus serve as the basis for parallel outcomes reported in humans of low social status.
Social status can be measured objectively or subjectively. Objective measures typically include socioeconomic status (SES) variables, such as income, education, or occupation, which were discussed as individual level factors at the beginning of this chapter. Social status can also be represented by manifestations of status differentials, including inequality between groups or measurable differences in the ability for someone to obtain basic life necessities, such as food security. High levels of absolute income/wealth may be related to health not only through better material conditions, but also through social position. However, in an analysis of two nationally representative British panel studies, ranked position of income/wealth, not absolute income/wealth, predicted adverse health outcomes such as obesity, presence of chronic disease, and poor ratings of physical functioning and pain (60). In a worldwide study of physical activity, countries with large activity inequality predicted obesity better than the total volume of physical activity within the country (61). Activity inequality is identified by calculating a Gini coefficient for population step count data from each country, 0 = complete equality, 1= complete inequality. Individuals in the top five countries for physical activity inequality (Saudi Arabia, USA, Egypt, Canada, Australia) were 196% more likely to have obesity than individuals from more equal societies that did not have large disparities in step counts across the population. Gender differences account for 43% of the inequality observed, however, this effect was mitigated in societies that rated higher in walkability (61). Inequality can also drive calorie consumption. Individuals who are experimentally induced to view themselves as poor in reference to others exhibited increased calorie intake (62). Additionally, individuals who believed they were poorer or wealthier than an interaction partner exhibited higher levels of anxiety in regards to that difference in status that, in turn, led to increased calorie consumption (62).
Food insecurity affects approximately 11.8 percent of families in the United States and has been linked to obesity and diabetes. Food insecurity occurs when “the intake of one or more members of a household is reduced and eating patterns are disrupted (sometimes resulting in hunger) because of insufficient money and other resources for food” (63). In women, food insecurity status predicts overweight/obese status differentially across racial ethnic groups. Non-Hispanic white women who are food insecure are 41% more likely to have overweight or obesity whereas Hispanic women who are food insecure are 29% more likely to have overweight and obesity (64). Among non-Hispanic black women and men, food insecurity did not predict overweight or obesity status (64). A population-based study in Canada revealed that persons in food insecure households had double the risk of developing type 2 diabetes compared to persons in food secure households, even after controlling for age, gender, income, race, physical activity, smoking status, alcohol consumption, diet quality, and BMI (65). Reduced food availability is theorized to initiate compensatory biological mechanisms that boost caloric intake, decrease resting metabolic rate, and increase storage of adipose tissue as a protective mechanism for survival (66). Research in youth has provided evidence for a moderating effect of food insecurity on the relationship between income and subjective social status (67). This means that low income is more strongly associated with low subjective social status when the household is also food insecure.
Subjective measures of social status (SSS) are typically measured by asking individuals to place themselves on 10-rung ladders based on where they perceive their rank within society and the community. Experimental evidence demonstrates a relationship between feelings of low social status and increased calorie intake. Cornil and Chandon showed that hometowns of National Football League teams consumed more calories after a team loss than hometowns of winning teams or of hometowns where teams didn’t play (68). Manipulations of social status in an experimental setting show that acute eating behavior post experimental manipulation consists of higher calorie food choices and higher total calorie intake in the low status group (69). Additionally, individuals randomized to a low social status condition, had increased levels of ghrelin, a hormone that stimulates appetite, as compared to the high social status condition, suggesting a physiological hunger response to low perceived social status (70). Studies of physical activity and SSS show that low SSS is associated with significantly lower levels of moderate to vigorous physical activity (71, 72), which could contribute to a lower overall energy expenditure. Closely related to SSS are other perceptive representations of status differentials, such as perceived discrimination, which is associated with increased weight and BMI in women (73) and increased abdominal adiposity in non-Hispanic whites (74).
Researchers have integrated individual and environmental factors into design and development of interventions to improve weight outcomes or weight-related behaviors (healthy eating, physical activity); however, not all of them are successful. For example, a study among low-income women with children in rural Mexico randomly assigned families to cash or in-kind transfers (food baskets) and found that women in the food basket and cash groups actually gained weight compared to women in the control group (75). This study and others that show weight gain occurring in spite of access to resources or poverty relief imply accounting for individual and environmental factors alone may not paint a complete picture of obesity development. Granted, it is important to consider that systemic environmental changes, such as placement of sidewalks or fruits and vegetables in a corner store, may not be adequately captured in a short time frame typical of academic studies. However, the small or nonexistent changes observed when resources are supplied warrants further investigation into deeper realms of social hierarchical constructs, as well as continued study of individual and environmental factors to improve treatment and prevention of obesity.
CLINICAL IMPLICATIONS AND CONCLUSIONS
Given the extent of the information on individual, environmental, and social hierarchy constraints on obesity development, it is important to understand how these can merge with clinical care. It is evident that there is no one simple solution and effective care requires knowledge of these complex relationships and an integration between the health system and the surrounding community. For example, based on the knowledge that the social determinants of health can influence diabetes and its comorbidities, the American Diabetes Association recommends in its clinical guidelines that providers “assess the social context… and apply that information to treatment decisions” (76). In conjunction with recognition of the impact of social and environmental determinants on multiple chronic diseases, some researchers propose that “community vital signs” be integrated into the electronic health record (EHR) (77) and some community health centers have begun pilot testing a social determinants questionnaire in their HER (78). Knowledge provided by these “vital signs” and social determinants could help providers make appropriate lifestyle-tailored recommendations for the patient.
Discussing context surrounding food in a patient’s life can provide insight into the realistic expectations for a patient’s diet. Food insecurity can be identified with a short two question screener (79) and implementation in clinics has shown that screening improves clinician awareness of food insecurity, helping to better understand the lengths to which it affects patient treatment (80). Positive responses from physicians after pilot testing that incorporates screening into clinical practice mitigates concerns that discussions about food security would be stigmatizing to the patient (80). Patients who identify as food insecure can be referred to local food banks or community programs that will connect patients with resources at a federal and community level.
Patients that are finding it difficult to follow lifestyle modification recommendations to lose weight to prevent diabetes development may benefit from the Diabetes Prevention Program. The Diabetes Prevention Program is a lifestyle program focused on weight loss through dietary change and increased physical activity. While the overall weight loss was modest (~4% after 4 years), participants lowered their chances of developing diabetes by 58% during long-term follow-up (81). This program has been adapted for implementation and dissemination purposes and now the CDC’s National Diabetes Prevention (National DPP) program is available at almost 2,000 sites across the United States including many YMCAs, with a mix of online and in-person options. This program is covered for eligible individuals by Medicare and many private insurers and cost for non-covered patients is variable and often income-based or free. Initial evaluation of the real-world evidence for implementation of the National DPP have been promising with 35% achieving 5% weight loss and 42% meeting the activity goal of 150 minutes per week (82). Locations with the best participant retention and attendance share the following qualities: referrals from healthcare providers or health systems, provision of non-monetary incentives for participation, and use of cultural adaptations to address participant needs (83). The National DPP provides an affordable, easy and local referral source so that the provider can be assured their patients are receiving evidence-based lifestyle management in an ongoing program.
RESOURCES
Figure 1 below shows the age-adjusted prevalence of obesity in adults by race and ethnicity, and sex from the Centers for Disease Control 2017 National Center for Health Statistics Data Brief (5).
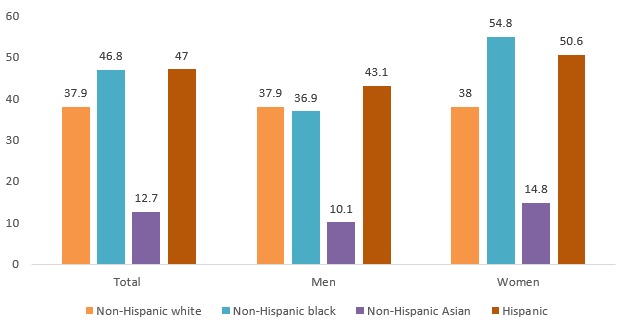
Figure 1.
Prevalence of Obesity by Race/Ethnicity and Sex
Questions to Incorporate into Your EHR About Food Insecurity
- 1.
“We worried whether (my/our) food would run out before (I/we) got money to buy more” Was that often true, sometimes true, or never true for (you/your household) in the last 12 months?
- 2.
“The food that (I/we) bought just didn't last and (I/we) didn't have money to get more” Was that often true, sometimes true, or never true for (you/your household) in the last 12 months?
Information on the Diabetes Prevention Program
Opportunities for Advocacy
The Obesity Action Coalition: https://www.obesityaction.org/
The Obesity Society: https://www.obesity.org/
STOP Obesity Alliance: http://stop.publichealth.gwu.edu/
Rudd Center for Food Policy and Obesity: http://www.uconnruddcenter.org/weight-bias-stigma
REFERENCES
- 1.
- Sikorski C, Luppa M, Kaiser M, et al. The stigma of obesity in the general public and its implications for public health - A systematic review. BMC Public Health. 2011;11(1):661. [PMC free article: PMC3175190] [PubMed: 21859493]
- 2.
- Tsai AG, Histon T, Kyle TK, Rubenstein N, Donahoo WT. Evidence of a gap in understanding obesity among physicians. Obes Sci Pract. 2018;4(1):46–51. [PMC free article: PMC5818759] [PubMed: 29479464]
- 3.
- Allison (chair) DB, Downey (co-chair) M, Atkinson RL, et al. Obesity as a Disease: A White Paper on Evidence and Arguments Commissioned by the Council of The Obesity Society. Obesity. 2008;16(6):1161-1177. [PubMed: 18464753]
- 4.
- Hales CM, Fryar CD, Carroll MD, Freedman DS, Ogden CL. Trends in obesity and severe obesity prevalence in usyouth and adults by sex and age, 2007-2008 to 2015-2016. JAMA - J Am Med Assoc. 2018;319(16):1723–1725. [PMC free article: PMC5876828] [PubMed: 29570750]
- 5.
- Hales CM, Carroll MD, Fryar CD, Ogden CL. Prevalence of obesity among adults and youth : United States, 2015–2016. (U.S.) NC for HS, ed. https://stacks
.cdc.gov/view/cdc/49223. [PubMed: 29155689] - 6.
- Fernández JR, Shiver MD. Using genetic admixture to study the biology of obesity traits and to map genes in admixed populations. Nutr Rev. 2004;62(7 Pt 2):S69–S74. [PubMed: 15387470]
- 7.
- Cardel M, Higgins PB, Willig AL, et al. African genetic admixture is associated with body composition and fat distribution in a cross-sectional study of children. Int J Obes. 2011;35(1):60–65. [PMC free article: PMC3804117] [PubMed: 20877287]
- 8.
- Kronenfeld LW, Reba-Harrelson L, Von Holle A, Reyes ML, Bulik CM. Ethnic and racial differences in body size perception and satisfaction. Body Image. 2010;7(2):131–136. d. [PMC free article: PMC3593344] [PubMed: 20096656]
- 9.
- Braveman PA, Cubbin C, Egerter S, Williams DR, Pamuk E. Socioeconomic Disparities in Health in the United States: What the Patterns Tell Us. Am J Public Health. 2010;100(S1):S186–S196. [PMC free article: PMC2837459] [PubMed: 20147693] [CrossRef]
- 10.
- Fontenot K, Semega J, Kollar M. Income and and Poverty Poverty the United States. 2018 September;2017:2018.
- 11.
- Ryan CL, Bauman K. Educational attainment in the United States: 2015 population characteristics. United States Census Bur. 2016;2010:20–578.
- 12.
- Kivimäki M, Davey Smith G, Juonala M, et al. Socioeconomic position in childhood and adult cardiovascular risk factors, vascular structure, and function: Cardiovascular risk in young Finns study. Heart. 2006 [PMC free article: PMC1860895] [PubMed: 16159979]
- 13.
- Ogden CL, Fakhouri TH, Carroll MD, et al. Prevalence of Obesity Among Adults, by Household Income and Education — United States, 2011–2014. MMWR Morb Mortal Wkly Rep. 2017;66(50):1369. [PMC free article: PMC5751581] [PubMed: 29267260] [CrossRef]
- 14.
- O’Donoghue G, Kennedy A, Puggina A, et al. Socio-economic determinants of physical activity across the life course: A “DEterminants of DIet and Physical ACtivity” (DEDIPAC) umbrella literature review. Henchoz Y, ed. PLoS One. 2018;13(1):e0190737. [PMC free article: PMC5774703] [PubMed: 29351286]
- 15.
- Darmon N, Drewnowski A. Does social class predict diet quality? Am J Clin Nutr. 2008;87(5):1107–1117. [PubMed: 18469226]
- 16.
- Gurka MJ, Filipp SL, DeBoer MD. Geographical variation in the prevalence of obesity, metabolic syndrome, and diabetes among US adults. Nutr Diabetes. 2018;8(1):14. [PMC free article: PMC5856741] [PubMed: 29549249]
- 17.
- Rising rural body-mass index is the main driver of the global obesity epidemic in adults. Nature. 2019;569(7755):260–264. [PMC free article: PMC6784868] [PubMed: 31068725]
- 18.
- Wen M, Fan JX, Kowaleski-Jones L, Wan N. Rural–Urban Disparities in Obesity Prevalence Among Working Age Adults in the United States: Exploring the Mechanisms. Am J Heal Promot. 2018;32(2):400–408. [PubMed: 29214811]
- 19.
- Maddock J. The relationship between obesity and the prevalence of fast food restaurants: State-level analysis. Am J Heal Promot. 2004;19(2):137–143. [PubMed: 15559714]
- 20.
- Li F, Harmer P, Cardinal BJ, Bosworth M, Johnson-Shelton D. Obesity and the built environment: does the density of neighborhood fast-food outlets matter? Am J Health Promot. 2009;23(3):203–209. [PMC free article: PMC2730045] [PubMed: 19149426]
- 21.
- Mazidi M, Speakman JR. Higher densities of fast-food and full-service restaurants are not associated with obesity prevalence. Am J Clin Nutr. 2017;106(2):603–613. [PubMed: 28566310]
- 22.
- Moore L V., Diez Roux A V. Associations of Neighborhood Characteristics With the Location and Type of Food Stores. Am J Public Health. 2006;96(2):325–331. [PMC free article: PMC1470485] [PubMed: 16380567]
- 23.
- Zenk SN, Schulz AJ, Israel BA, James SA, Bao S, Wilson ML. Neighborhood Racial Composition, Neighborhood Poverty, and the Spatial Accessibility of Supermarkets in Metropolitan Detroit. Am J Public Health. 2005;95(4):660–667. [PMC free article: PMC1449238] [PubMed: 15798127]
- 24.
- Chen D, Jaenicke EC, Volpe RJ. Food Environments and Obesity: Household Diet Expenditure Versus Food Deserts. Am J Public Health. 2016;106(5):881–888. [PMC free article: PMC4985118] [PubMed: 26985622]
- 25.
- Giskes K, van Lenthe F, Avendano-Pabon M, Brug J. A systematic review of environmental factors and obesogenic dietary intakes among adults: are we getting closer to understanding obesogenic environments? Obes Rev. 2011;12(5):e95–e106. [PubMed: 20604870]
- 26.
- Dubowitz T, Ghosh-Dastidar M, Cohen DA, et al. Diet And Perceptions Change With Supermarket Introduction In A Food Desert, But Not Because Of Supermarket Use. Health Aff. 2015;34(11):1858–1868. [PMC free article: PMC4977027] [PubMed: 26526243]
- 27.
- Hu FB. Resolved: there is sufficient scientific evidence that decreasing sugar-sweetened beverage consumption will reduce the prevalence of obesity and obesity-related diseases. Obes Rev. 2013;14(8):606–619. [PMC free article: PMC5325726] [PubMed: 23763695]
- 28.
- Popkin BM, Hawkes C. Sweetening of the global diet, particularly beverages: Patterns, trends, and policy responses. Lancet Diabetes Endocrinol. 2016;4(2):174–186. [PMC free article: PMC4733620] [PubMed: 26654575]
- 29.
- Young LR, Nestle M. The contribution of expanding portion sizes to the US obesity epidemic. Am J Public Health. 2002;92(2):246–249. [PMC free article: PMC1447051] [PubMed: 11818300]
- 30.
- Livingstone MBE, Pourshahidi LK. Portion Size and Obesity. Adv Nutr. 2014;5(6):829–834. [PMC free article: PMC4224223] [PubMed: 25398749]
- 31.
- Hall KD, Ayuketah A, Brychta R, et al. Clinical and Translational Report Ultra-Processed Diets Cause Excess Calorie Intake and Weight Gain: An Inpatient Randomized Controlled Trial of Ad Libitum Food Intake Cell Metabolism Clinical and Translational Report Ultra-Processed Diets Cause Excess Ca. Cell Metab. 2019;30(1):1–11. [PMC free article: PMC7959109] [PubMed: 31269427]
- 32.
- Boyland EJ, Nolan S, Kelly B, et al. Advertising as a cue to consume: a systematic review and meta-analysis of the effects of acute exposure to unhealthy food and nonalcoholic beverage advertising on intake in children and adults. Am J Clin Nutr. 2016;103(2):519–533. [PubMed: 26791177]
- 33.
- Story M, French S. Food Advertising and Marketing Directed at Children and Adolescents in the US. Int J Behav Nutr Phys Act. 2004;1(1):3. [PMC free article: PMC416565] [PubMed: 15171786]
- 34.
- Carlson A, Frazão E. Food costs, diet quality and energy balance in the United States. Physiol Behav. 2014;134(C):20–31. [PubMed: 24631301]
- 35.
- Lee A, Mhurchu CN, Sacks G, et al. Monitoring the price and affordability of foods and diets globally. Obes Rev. 2012 November;2014(14):82–95. [PubMed: 24074213]
- 36.
- Creatore MI, Glazier RH, Moineddin R, et al. Association of Neighborhood Walkability With Change in Overweight, Obesity, and Diabetes. JAMA. 2016;315(20):2211. [PubMed: 27218630]
- 37.
- Ng SW, Popkin BM. Time use and physical activity: a shift away from movement across the globe. Obes Rev. 2012;13(8):659–680. [PMC free article: PMC3401184] [PubMed: 22694051]
- 38.
- Salvo G, Lashewicz BM, Doyle-Baker PK, McCormack GR. Neighbourhood Built Environment Influences on Physical Activity among Adults: A Systematized Review of Qualitative Evidence. Int J Environ Res Public Health. 2018;15(5) [PMC free article: PMC5981936] [PubMed: 29724048]
- 39.
- Smith M, Hosking J, Woodward A, et al. Systematic literature review of built environment effects on physical activity and active transport - an update and new findings on health equity. Int J Behav Nutr Phys Act. 2017;14(1):158. [PMC free article: PMC5693449] [PubMed: 29145884]
- 40.
- Giles-Corti B, Donovan RJ. Socioeconomic status differences in recreational physical activity levels and real and perceived access to a supportive physical environment. Prev Med (Baltim). 2002. [PubMed: 12460528]
- 41.
- van Lenthe F, Mackenbach J. Neighbourhood deprivation and overweight: the GLOBE study. Int J Obes. 2002;26(2):234–240. [PubMed: 11850756]
- 42.
- Mayne SL, Jose A, Mo A, et al. Neighborhood disorder and obesity-related outcomes among women in Chicago. Int J Environ Res Public Health. 2018;15(7) [PMC free article: PMC6069019] [PubMed: 29970797]
- 43.
- Rees-Punia E, Hathaway ED, Gay JL. Crime, perceived safety, and physical activity: A meta-analysis. Prev Med (Baltim). 2017 October;2018(111):307–313. [PubMed: 29157975]
- 44.
- Ludwig J, Sanbonmatsu L, Gennetian L, et al. Neighborhoods, Obesity, and Diabetes — A Randomized Social Experiment. N Engl J Med. 2011 [PMC free article: PMC3410541] [PubMed: 22010917]
- 45.
- Church TS, Thomas DM, Tudor-Locke C, et al. Trends over 5 Decades in U.S. Occupation-Related Physical Activity and Their Associations with Obesity. Lucia A, ed. PLoS One. 2011;6(5):e19657. [PMC free article: PMC3102055] [PubMed: 21647427]
- 46.
- Grier SA, Kumanyika SK. The Context for Choice: Health Implications of Targeted Food and Beverage Marketing to African Americans. Am J Public Health. 2008;98(9):1616–1629. [PMC free article: PMC2509618] [PubMed: 18633097]
- 47.
- Adeigbe RT, Baldwin S, Gallion K, Grier S, Ramirez AG. Food and Beverage Marketing to Latinos. Heal Educ Behav. 2015;42(5):569–582. [PubMed: 25504570]
- 48.
- Cardel MI, Chavez S, Bian J, et al. Accuracy of weight loss information in Spanish search engine results on the internet. Obesity. 2016;24(11):2422–2434. [PMC free article: PMC5117437] [PubMed: 27653438]
- 49.
- Robinson TN, Banda JA, Hale L, et al. Screen Media Exposure and Obesity in Children and Adolescents. Pediatrics. 2017;140 Suppl 2:S97–S101. [PMC free article: PMC5769928] [PubMed: 29093041]
- 50.
- Banks E, Jorm L, Rogers K, Clements M, Bauman A. Screen-time, obesity, ageing and disability: findings from 91 266 participants in the 45 and Up Study. Public Health Nutr. 2011;14(1):34–43. [PubMed: 20409356]
- 51.
- Mitchell JA, Rodriguez D, Schmitz KH, Audrain-McGovern J. Greater screen time is associated with adolescent obesity: A longitudinal study of the BMI distribution from Ages 14 to 18. Obesity. 2013;21(3):572–575. [PMC free article: PMC3630469] [PubMed: 23592665]
- 52.
- Lee AM, Chavez S, Bian J, et al. Efficacy and effectiveness of mobile health technologies for facilitating physical activity in adolescents: Scoping review. JMIR mHealth uHealth. 2019;7(2) [PMC free article: PMC6390191] [PubMed: 30747716]
- 53.
- D.E. S. G. T-M, S.J. J, S. W. Mobile apps for pediatric obesity prevention and treatment, healthy eating, and physical activity promotion: Just fun and games? Transl Behav Med. 2013;3(3):320–325. http://link
.springer .com/article/10.1007/s13142-013-0206-3 Accessed June 10, 2016. [PMC free article: PMC3771006] [PubMed: 24073184] - 54.
- Hutchesson MJ, Rollo ME, Krukowski R, et al. eHealth interventions for the prevention and treatment of overweight and obesity in adults: a systematic review with meta-analysis. Obes Rev. 2015;16(5):376–392. [PubMed: 25753009]
- 55.
- Abbott DH, Keverne EB, Bercovitch FB, et al. Are subordinates always stressed? A comparative analysis of rank differences in cortisol levels among primates. Horm Behav. 2003;43(1):67–82. http://www
.ncbi.nlm.nih .gov/pubmed/12614636 Accessed April 16, 2019. [PubMed: 12614636] - 56.
- Sapolsky RM. Social Status and Health in Humans and Other Animals. Annu Rev Anthropol. 2004;33(1):393–418.
- 57.
- Tamashiro KLK, Hegeman MA, Sakai RR. Chronic social stress in a changing dietary environment. Physiol Behav. 2006;89(4):536–542. [PubMed: 16843504]
- 58.
- Wilson ME, Fisher J, Fischer A, Lee V, Harris RB, Bartness TJ. Quantifying food intake in socially housed monkeys: Social status effects on caloric consumption. Physiol Behav. 2008;94(4):586–594. [PMC free article: PMC2490628] [PubMed: 18486158]
- 59.
- Razzoli M, Nyuyki-Dufe K, Gurney A, et al. Social stress shortens lifespan in mice. Aging Cell. 2018 [PMC free article: PMC6052478] [PubMed: 29806171]
- 60.
- Daly M, Boyce C, Wood A. A social rank explanation of how money influences health. Heal Psychol. 2015. [PMC free article: PMC4507513] [PubMed: 25133843]
- 61.
- Althoff T, Sosič R, Hicks JL, King AC, Delp SL, Leskovec J. Large-scale physical activity data reveal worldwide activity inequality. Nature. 2017;547(7663):336–339. [PMC free article: PMC5774986] [PubMed: 28693034]
- 62.
- Bratanova B, Loughnan S, Klein O, Claassen A, Wood R. Poverty, inequality, and increased consumption of high calorie food: Experimental evidence for a causal link. Appetite. 2016;100:162–171. [PubMed: 26809142]
- 63.
- Coleman-Jensen A, Rabbitt MP, Gregory CA, Singh A. Household Food Security in the United States in 2016. 2017.
- 64.
- Hernandez DC, Reesor LM, Murillo R. Food insecurity and adult overweight/obesity: Gender and race/ethnic disparities. Appetite. 2017;117:373–378. [PubMed: 28739148]
- 65.
- Tait CA, L’Abbé MR, Smith PM, Rosella LC. The association between food insecurity and incident type 2 diabetes in Canada: A population-based cohort study. PLoS One. 2018 [PMC free article: PMC5965821] [PubMed: 29791453]
- 66.
- Dhurandhar EJ. The food-insecurity obesity paradox: A resource scarcity hypothesis. Physiol Behav. 2016 [PMC free article: PMC5394740] [PubMed: 27126969]
- 67.
- Cardel MI, Tong S, Pavela G, et al. Youth Subjective Social Status (SSS) is Associated with Parent SSS, Income, and Food Insecurity but not Weight Loss Among Low-Income Hispanic Youth. Obesity. 2018;26(12):1923–1930. [PMC free article: PMC6249075] [PubMed: 30421861]
- 68.
- Cornil Y, Chandon P. From Fan to Fat? Vicarious Losing Increases Unhealthy Eating, but Self-Affirmation Is an Effective Remedy. Psychol Sci. 2013;24(10):1936–1946. [PubMed: 23925307]
- 69.
- Cardel MI, Johnson SL, Beck J, et al. The effects of experimentally manipulated social status on acute eating behavior: A randomized, crossover pilot study. Physiol Behav. 2015;162:93–101. [PMC free article: PMC4899290] [PubMed: 27094920]
- 70.
- Cheon BK, Hong Y-Y. Mere experience of low subjective socioeconomic status stimulates appetite and food intake. Proc Natl Acad Sci. 2017 [PMC free article: PMC5224403] [PubMed: 27994148]
- 71.
- Frerichs L, Huang TTK, Chen DR. Associations of subjective social status with physical activity and body mass index across four asian countries. J Obes. 2014 [PMC free article: PMC4058138] [PubMed: 24971171]
- 72.
- Rajala K, Kankaanpää A, Laine K, Itkonen H, Goodman E, Tammelin T. Associations of subjective social status with accelerometer-based physical activity and sedentary time among adolescents. J Sports Sci. 2018;(June):1–8. [PubMed: 29889652]
- 73.
- Bernardo C de O, Bastos JL, González-Chica DA, Peres MA, Paradies YC. Interpersonal discrimination and markers of adiposity in longitudinal studies: a systematic review. Obes Rev. 2017;18(9):1040–1049. [PubMed: 28569010]
- 74.
- Hunte HER, Williams DR. The association between perceived discrimination and obesity in a population-based multiracial and multiethnic adult sample. Am J Public Health. 2009;99(7):1285–1292. [PMC free article: PMC2696650] [PubMed: 18923119]
- 75.
- Leroy JL, Gadsden P, Gonzalez de Cossio T, Gertler P. Cash and in-Kind Transfers Lead to Excess Weight Gain in a Population of Women with a High Prevalence of Overweight in Rural Mexico. J Nutr. 2013 [PubMed: 23343672]
- 76.
- American Diabetes Association AD. 1. Improving Care and Promoting Health in Populations: Standards of Medical Care in Diabetes-2019. Diabetes Care. 2019;42 Suppl 1:S7–S12. [PubMed: 30559227]
- 77.
- Bazemore AW, Cottrell EK, Gold R, et al. “Community vital signs” : incorporating geocoded social determinants into electronic records to promote patient and population health. J Am Med Informatics Assoc. 2016;23(2):407–412. [PubMed: 26174867]
- 78.
- Gold R, Bunce A, Cowburn S, et al. Adoption of Social Determinants of Health EHR Tools by Community Health Centers. Ann Fam Med. 2018;16(5):399–407. [PMC free article: PMC6131002] [PubMed: 30201636]
- 79.
- Gundersen C, Engelhard EE, Crumbaugh AS, Seligman HK. Brief assessment of food insecurity accurately identifies high-risk US adults. Public Health Nutr. 2017;20(8):1367–1371. [PMC free article: PMC10261547] [PubMed: 28215190]
- 80.
- Stenmark SH, Steiner JF, Marpadga S, Debor M, Underhill K, Seligman H. Lessons Learned from Implementation of the Food Insecurity Screening and Referral Program at Kaiser Permanente Colorado. Perm J. 2018;22:18–093. [PMC free article: PMC6175601] [PubMed: 30296400]
- 81.
- Diabetes Prevention Program (DPP) | NIDDK. National Institute of Diabetes and Digestive and Kidney Disease. https://www
.niddk.nih .gov/about-niddk/research-areas /diabetes /diabetes-prevention-program-dpp. Published 2018. Accessed May 6, 2019. - 82.
- Ely EK, Gruss SM, Luman ET, et al. A National Effort to Prevent Type 2 Diabetes: Participant-Level Evaluation of CDC’s National Diabetes Prevention Program. Diabetes Care. 2017;40(10):1331–1341. [PMC free article: PMC5606310] [PubMed: 28500215]
- 83.
- Nhim K, Gruss SM, Porterfield DS, et al. Using a RE-AIM framework to identify promising practices in National Diabetes Prevention Program implementation. Implement Sci. 2019;14(1):81. [PMC free article: PMC6694543] [PubMed: 31412894]
- Folic acid supplementation and malaria susceptibility and severity among people taking antifolate antimalarial drugs in endemic areas.[Cochrane Database Syst Rev. 2022]Folic acid supplementation and malaria susceptibility and severity among people taking antifolate antimalarial drugs in endemic areas.Crider K, Williams J, Qi YP, Gutman J, Yeung L, Mai C, Finkelstain J, Mehta S, Pons-Duran C, Menéndez C, et al. Cochrane Database Syst Rev. 2022 Feb 1; 2(2022). Epub 2022 Feb 1.
- Review Non-Exercise Activity Thermogenesis in Human Energy Homeostasis.[Endotext. 2000]Review Non-Exercise Activity Thermogenesis in Human Energy Homeostasis.von Loeffelholz C, Birkenfeld AL. Endotext. 2000
- Review Exercise Treatment of Obesity.[Endotext. 2000]Review Exercise Treatment of Obesity.Stone T, DiPietro L, Stachenfeld NS. Endotext. 2000
- Review The Control of Food Intake in Humans.[Endotext. 2000]Review The Control of Food Intake in Humans.Hopkins M, Beaulieu K, Gibbons C, Halford JCG, Blundell J, Stubbs J, Finlayson G. Endotext. 2000
- Review Body Weight Regulation.[Endotext. 2000]Review Body Weight Regulation.Woolf EK, Cabre HE, Niclou AN, Redman LM. Endotext. 2000
- Social and Environmental Factors Influencing Obesity - EndotextSocial and Environmental Factors Influencing Obesity - Endotext
Your browsing activity is empty.
Activity recording is turned off.
See more...