Introduction
Influenza resembles other acute viral respiratory infections with respect to its seasonality, clinical presentation and complications, but it differs from other respiratory viral conditions by being preventable by annual vaccination and ameliorated by antiviral drugs if given within 48 hours of symptom onset. The gold standard for influenza diagnosis is viral culture, which, although specific, had low sensitivity compared with real-time RT-PCR in our study and gave results long after hospital discharge or death (see
Chapters 5
and
7
). In contrast, we were able to correlate the results of PCR and serology (see
Chapter 5
), confirming the accuracy of RT-PCR, and we showed that it gave a diagnosis in a busy clinical setting within a median of 29 hours (IQR 13.5–31.6 hours) (see
Chapter 7
). This turnaround time might facilitate timely antiviral therapy but concerns have been raised that the demands of the test, requiring transportation of specimens to a laboratory with specialised expertise and equipment, and its turnaround time make it too slow for therapeutic or infection control purposes.168–170
Commercial POCTs were used to manage patients with ILI during the 2009 H1N1 pandemic.168,169,171,172 However, there have been mixed reports of the diagnostic accuracy of such tests, perhaps reflecting the test used, patient age, the method of sample collection and transport, the ‘gold standard’ used, and the type and subtype of influenza (i.e. whether seasonal or pandemic influenza, or influenza B). According to the manufacturer, the QuickVue Influenza A + B test detected all 24 influenza A viruses, subtypes H1–H15, which were isolated from birds and mammals, although performance characteristics were not established (see www.cliawaived.com/web/items/pdf/QDL-20183-Quidel_Influenza_Tests_Insert∼619file1.pdf).
We used the QuickVue (Quidel, USA) POCT in our study and found that it had a sensitivity of 33.3% and a specificity of 98.6% when compared with culture and 24.4% and 99.7%, respectively, when compared with RT-PCR (see
Chapter 5
). To compare our findings with other studies, we systematically reviewed published articles on the diagnostic accuracies of commercially available influenza POCTs. To assess the quality of the methodology and the completeness of the reporting of each manuscript, we ‘scored’ each publication using the QUADAS (quality assessment tool for diagnostic accuracy studies) tool and the Standards for Reporting of Diagnostic Accuracy (STARD) initiative.173–176
Methods
Literature searches
On-line searches were made on MEDLINE/PubMed on 28 April 2011 and on the Bioscience Information Service (BIOSIS) and The Cochrane library on 27 May 2011 for publications on influenza POCT diagnostic accuracy studies between 1991 and 2011 (inclusive) that met the following five criteria:
Articles written in English.
Commercially available test kits.
Testing done in human seasonal and pandemic influenza.
Sensitivity results with specific numerators and denominators.
We had authorised journal access.
Medical subject heading (MeSH) search phrases included:
“QuickVue test influenza”.
“Rapid influenza test”.
“Rapid antigen test influenza”.
“POCT influenza”.
“Immunochromatographic test influenza”.
“Bedside test influenza”.
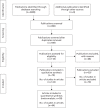
shows a flow diagram of the manuscript screening process, taken from the Preferred Reporting Items for Systematic Reviews and Meta-Analyses (PRISMA) guideline on systematic reviews.177
The manuscript screening process. a. Partial data from three publications.
Manuscript scoring
The QUADAS tool is an evidence-based scheme for the determination of the quality of both the methodology and the reporting of findings when doing systematic reviews. It consists of 14 questions called ‘items’ about the study patients, selection criteria, testing standards, results and clinical data that were answered with a ‘yes,’ ‘no’ or ‘unclear.’
The STARD initiative was another evidence-based tool used to assess the accuracy, completeness, and risk of bias in the systematic review of diagnostic accuracy studies. The STARD checklist consists of 25 questions pertaining to a study’s title, introduction, methodology, results and discussion sections; the more of the 25 items that are identified or described in the report, the more favourable the outcome.
Data analysis
For those studies that reported a full 2 × 2 table, i.e. numbers of true-positives, false-positives, false-negatives and true-negatives, or for which these could be calculated, pooled sensitivity and specificities were estimated using a bivariate mixed-effects meta-analysis model.178 As well as summarising the overall diagnostic measures a hierarchical summary ROC curve was also estimated using the derived logit estimates of sensitivity, specificity and their respective variances.179 Heterogeneity was assessed using the I
2 measure and explored using subgroup analyses using study-level covariates.180 A number of studies reported only estimates of sensitivity, and in order to explore whether there was a selection effect between those studies that reported both sensitivity and specificity, and those that reported only sensitivity, a sensitivity analysis was undertaken in which the sensitivities were pooled separately for the two groups of studies using a standard random-effects meta-analysis model on the logit scale, and the pooled estimates compared.
Results
More than 2000 publications were found using the MeSH terms and 490 of these were relevant. In total, 70 out of the 490 publications met all five criteria and were selected for the systematic review. Some of the 70 had more than one finding, which we called ‘studies’. There were 143 studies altogether. Twenty-eight of the 70 publications reported full 2 × 2 data and were used for meta-analysis. There were a total of 68 studies in the 28 publications but four studies from three publications were excluded.88,172,181 Thus 64 studies from 28 publications were included in the meta-analysis.
shows a flow diagram of the manuscript screening process, taken from the PRISMA guidance on systematic reviews.178
Appendix 6
summarises the publications that were screened and
summarises the sensitivities and specificities of the 64 POC studies that were included in the qualitative synthesis.
presents the QUADAS results and
the STARD results.
shows the percentage of studies satisfying each of the QUADAS items and
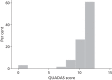
displays the distribution of the overall QUADAS score. As can be seen from
, 40 of the 64 (62.5%) studies that were included in the meta-analysis scored > 10 indicating that the studies were of a reasonably high quality overall.
Studies included in the meta-analysis of POCT for influenza using PCR as the gold standard
The QUADAS results for the 27 publications in the meta-analysis of POCTs for influenza (PCR as gold standard)
The STARD results for the 27 publications in the meta-analysis of POCTs for influenza (PCR as the gold standard)
Percentage of studies satisfying QUADAS items.
Distribution of QUADAS Score.
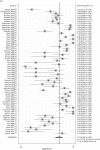
Of the 143 studies in Appendix 6 for which data could be extracted, 64 (45%) reported the full 2 × 2 table, and using a bivariate mixed-effects meta-analysis model produced an overall estimate of sensitivity of 0.73 (95% CI 0.66 to 0.80) and of specificity of 0.99 (95% CI 0.98 to 0.99). However, there was a high level of heterogeneity between the studies for both outcomes (sensitivity: Q = 777.5, p < 0.01, I
2 = 91.9%, 95% CI 90.5% to 93.3%; specificity: Q = 2128.9, p < 0.01, I
2 = 97.0%, 95% CI 96.7% to 97.4%), as can be seen from the Forest plots in
.
displays the summary receiver operating characteristic (SROC) curve derived using the estimated overall pooled sensitivity and specificity. Superimposed on the SROC curve are the results from 3WS using (1) PCR (sensitivity 24.4%, specificity 99.7%) and (2) viral culture (sensitivity 33.3%, specificity 98.6%) as the ‘Gold standard’ tests. As can be seen from
, the 3WS results, although being within the associated prediction region, are nevertheless considerably lower, in terms of sensitivity, than those estimates from other studies in the meta-analysis.
Forest plot of sensitivity and specificity for 64 studies reporting full 2 × 2 data table.
Summary receiver operating characteristic estimated using bivariate mixed-effects meta-analysis model with 3WS results using PCR (a) and viral culture (b) as ‘gold standard’ superimposed.
To explore the between-study heterogeneity observed, a number of subgroup-specific models were estimated using study-level covariates (age of participants, ‘gold standard’ used, geographical region in which study was conducted, type of influenza tested for, type of POCT, and study quality assessed using the QUADAS tool). Owing to the relatively small numbers of studies in some specific subgroups (i.e. < 4) it was not always possible to estimate the associated effects. It can seen from
that the pooled estimates of specificity across subgroups were consistently high with relatively little subgroup-to-subgroup variation; however, for sensitivity there was variation in the pooled estimates across subgroups with a mixed age distribution, use of PCR as a ‘gold standard’, and testing for influenza of swine origin all yielding lower estimates of sensitivity. There was also some variation in sensitivity depending on the geographical region in which the study was conducted, with Europe and Australasia yielding lower estimates; this was also seen for study quality, with ‘higher’-quality studies producing a lower pooled sensitivity than those of ‘lower’ quality.
Subgroup effects estimated using bivariate mixed-effects meta-analysis model
In terms of the subgroup specific estimates of pooled sensitivity, even the lower estimates were still higher than those found in 3WS – using PCR as the ‘gold standard’, a Quidel POCT produced a sensitivity of 24.4%, whereas using viral culture as the ‘gold standard’ it was 33.3%. Although the distribution of studies across the various study-level covariates (and their levels) makes it difficult to obtain an estimate of sensitivity that closely matches the characteristics of 3WS – it is possible to estimate a pooled effect for those studies (n = 5), which (1) included both adults and children (as opposed to only children) and (2) compared Quidel with PCR. These produced an overall pooled sensitivity of 34% (95% CI 14% to 62%) and specificity of 99% (95% CI 97% to 100%), which are much more similar to those obtained in 3WS.
As only 64 out of 143 studies (45%) reported sufficient data to permit a formal bivariate analysis to be undertaken, a sensitivity analysis only pooling sensitivities for the 64 and 79 studies separately was undertaken to assess whether there was in fact a selection effect. The 79 studies produced a pooled sensitivity of 60.2% (59.0% to 61.0%), whereas the 64 studies produced an estimate of 69.1% (67.5% to 70.6%) – the latter was slightly lower than that produced by the bivariate model (73%, 95% CI 66% to 80%). A formal test of heterogeneity between the two sets of studies was highly significant (p < 0.001) indicating that had the 79 studies reported both sensitivity and specificity the corresponding bivariate model would have produced an estimate of sensitivity lower than that observed.
Discussion
This systematic review concurs with other reviews of diagnostic studies in different disease areas in that there was considerable heterogeneity – both in terms of reporting of data and clinical and methodological characteristics, thus making formal synthesis of study results using appropriate bivariate meta-analysis methods challenging.203
Overall, the bivariate meta-analysis produced estimates of sensitivity that were considerably higher than that observed in 3WS. However, exploration of the considerable between-study heterogeneity using subgroup analyses showed that for some subgroup combinations the pooled estimate of sensitivity was considerably lower than that estimated for others. In fact, the subgroup combination most closely resembling the characteristics of 3WS (comparing Quidel POCT with PCR in a mixed-age population) produced an estimate of sensitivity in close agreement with 3WS.
Further sensitivity analysis comparing those studies that reported fully data for sensitivity and specificity with those that only reported sensitivity indicated the possibility of a selection effect that would further reduce the true estimate of sensitivity of POCT for testing for influenza.
Published evidence on the usefulness of diagnostic tests has been summarised in four systematic reviews including this review. Uyeki204 reviewed published evidence on clinically useful diagnostic tests and antiviral treatment for influenza virus infections in children, which were published in the English language from 1966 to September 2002. The topics covered were wide-ranging, including clinical diagnosis, IF and rapid influenza diagnostic tests, as well as antiviral treatment. Altogether 28 studies of rapid influenza tests were identified. This was a descriptive study with no formal assessment of study quality or meta-analysis of the findings, rather the author presented median sensitivity values for the tests in comparison with cell culture as the gold standard. Overall, the POCTs had sensitivities and specificities of 40.4% to 100% and 65.2% to 100%, respectively. The median sensitivity of the Zstat Flu test (Zyme Tx, Oklahoma City, OK, USA) was 68.8% (range 28.1–96%) and median specificity was 83% (range 62.7–92.4%). The median sensitivity of the Directigen Flu A test was 87.2% (range 39–100%), and the median specificity was 98.1% (range 84–100%).The median sensitivity of the FLU OIA test (Biostar, Boulder, CO, USA) was 71.8% (range 36.7–93%), and the median specificity was 82% (range 65.2–95.7%). In five studies of the QuickVue Influenza Test the median sensitivity was 79.2% (range 74–95%) and the median specificity was 91.9% (range 76–98%). The studies were evidently heterogeneous in terms of age and the author concluded that rapid influenza diagnostic tests were ‘moderately to reasonably’ accurate for detecting influenza virus infections, and that false-negative results appeared more common than false-positive results.
Petrozzino et al.
205 were supported by the Quidel Corporation, the manufacturer of the QuickVue Influenza A + B test, to undertake a systematic review and meta-analysis of studies reporting sensitivity, specificity, and effects of ‘rapid flu tests’ (RFTs) and clinical diagnosis on decision-making for patients with ILI. Search results were limited to literature published in English between 1984 and 2009. Results from included studies were stratified according to age categories with an approximate cut-off of 15 years of age. It was not possible to stratify results for older people aged > 60 years. No RCTs were found directly comparing RFTs against the clinical diagnostic skills of clinicians. All included studies used an independent gold standard test for confirmatory influenza diagnosis. Separately, these investigators evaluated the clinical diagnosis of influenza.
Among older subjects aged ≥ 15 years, data on the QuickVue test from five studies showed that this POCT had a sensitivity in a fixed-effects model of 57% (52–62%) and specificity of 96% (95–97%). In a random-effects model, the POCT had a sensitivity of 61% (36–81%) and specificity of 96% (94–98%). Data from 11 studies showed the sensitivity of clinical diagnosis in a fixed-effects model to be 64% (51–75%) and much lower specificity of 65% (63–66%). In the random-effects model, clinical diagnosis had a sensitivity of 64% (51–75%) and specificity of 68% (57–77%). Thus clinicians were as able to diagnose influenza clinically as POC testing but wrongly identified other individuals as having influenza, which could be problematic when isolation facilities for adults are scarce, although it is conceivable that these patients also posed an infection risk to others.
Among younger subjects aged < 15 years, data on the QuickVue test from 14 studies showed that this POCT had a sensitivity in a fixed-effects model of 63% (60–67%) and specificity of 94% (92–95%). In a random-effects model, the POCT had a sensitivity of 76% (65–85%) and specificity of 95% (92–98%). Data from five studies showed the sensitivity of clinical diagnosis in a fixed-effects model to be 70% (66–74%), and the specificity of 61% (59–63%) was again lower than that of the POCT. In the random-effects model, clinical diagnosis had a sensitivity of 69% (44–87%) and specificity of 63% (31–87%). For all age groups combined, the sensitivities of the POCT and clinical diagnosis in both the fixed and random-effects models were similar, with sensitivities of 61% (59–64%) and 62% (60–63%) respectively in the fixed-effects model, and 72% (62–81%) and 65% (55–74%) in the random-effects model. The respective sensitivities were 94% (93–95%) and 63% (62–64%) in the fixed model, and 96% (93–97%) and 67% (57–76%) in the random-effects model.
These authors examined 10 studies reporting outcomes relating to patient management associated with the use of POCT for influenza. This overview led the authors to conclude that in various clinical settings and across a wide age range, RFT use in patients presenting with ILI leads to reduced diagnostic testing, antibiotic use and emergency department length of stay, although increases antiviral prescribing.
Babin et al.
206 did a review and meta-analysis of published literature on the 2009 novel swine flu outbreak to assess the potential utility of POCTs for initiating infection treatment and control for this pathogen. Although these POCTs were not developed for swine-origin virus, their speed and ease of use (EoU) made them attractive for clinical and public health use. These authors identified 14 reports on sensitivity and/or specificity of seven different POC influenza tests for diagnosis of 2009 pandemic H1N1 virus on clinical specimens. The pooled sensitivity and specificity for all studies were 67.5% (95% CI 66.2% to 68.9%) and 80.7% (95% CI 80.0% to 81.4%). Pooled data were provided for three POCTs from different manufacturers: BinaxNOW Influenza A&B, with a pooled sensitivity of 31.4% (95% CI 26.3% to 36.7%) (no specificity data); Directigen EZ Flu A + B, with a pooled sensitivity of 52.8% (95% CI 45.9% to 59.6%)%) (no specificity data); and QuickVue A + B, with a pooled sensitivity of 73.6% (95% CI 72.1% to 75.0%), and specificity of 76.6% (95% CI 75.5% to 77.5%). In conclusion, the authors considered that the relatively poor performance of the POCTs affirmed recommendations by the US Centers for Disease Control and Prevention (CDCP) that caution should be applied in the interpretation of negative POCTs.
Our systematic review and meta-analysis confirms and extends the observations in the above reports. In our study, specificity across subgroups was consistently high but sensitivity was higher in studies involving children and adolescents than in ‘mixed’ populations (i.e. mixed age groups). We may speculate that this might reflect decreased virus shedding in adults than in young children (although virus shedding may be high in very elderly hospitalised patients)125 and the effects of vaccination and past infection. We also found that the test sensitivity was a function of the nature of the gold standard used, with PCR setting a higher target than virus culture. The caution issued by the CDCP regarding the sensitivity of POCTs for the detection of the 2009 pandemic ‘swine-origin’ H1N1 virus was affirmed in our analyses, which also showed better performance of POCTs in the detection of seasonal influenza type A virus than type B virus.