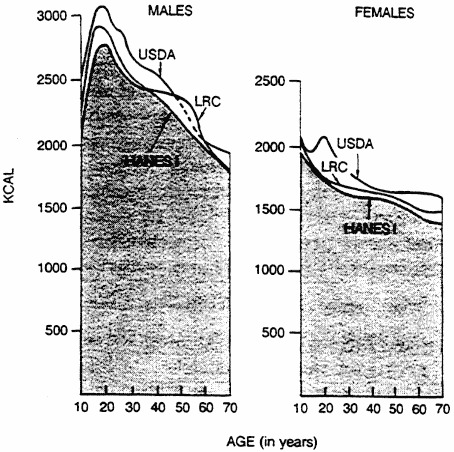
FIGURE 6-1. Relationship of caloric intake to age for males and females.

FIGURE 6-1

Relationship of caloric intake to age for males and females. Based on data from three studies—the Lipid Research Clinics Prevalence Study (LRC, 1980), the Nationwide Food Consumption Survey of the U.S. Department of Agriculture (USDA, 1980), and the Health and Nutrition Examination Survey (HANES I) of the National Center for Health Statistics (Carroll et al., 1983).

From: 6, Calories: Total Macronutrient Intake, Energy Expenditure, and Net Energy Stores
Cover of Diet and Health
Diet and Health: Implications for Reducing Chronic Disease Risk.
National Research Council (US) Committee on Diet and Health.
Washington (DC): National Academies Press (US); 1989.
Copyright © 1989 by the National Academy of Sciences.

NCBI Bookshelf. A service of the National Library of Medicine, National Institutes of Health.