From: 4, Homage to Linnaeus: How Many Parasites? How Many Hosts?

NCBI Bookshelf. A service of the National Library of Medicine, National Institutes of Health.

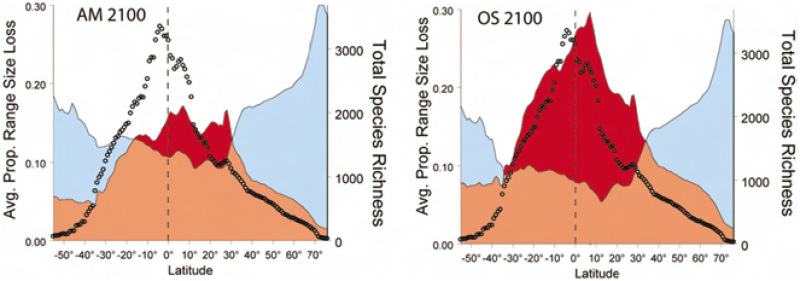
The relationship between geographic range size and percentage range transformations for all of the world’s 8,750 land birds under two MEA scenarios of future land-use change. (Left) “Adaptive mosaic” (which assumes a world with open political dialogue that deals proactively with environmental problems). (Right) “Order from strength” scenario (which assumes a more insular political world that only deals retroactively with environmental problems). Jetz et al. (2007) provide complete detail for how the analyses were developed. The dots illustrate number of avian species, lightest shading denotes range change due to climate change, and black illustrates land-use change due to agricultural expansion.
From: 4, Homage to Linnaeus: How Many Parasites? How Many Hosts?

NCBI Bookshelf. A service of the National Library of Medicine, National Institutes of Health.