From: Chapter 48, Glycomics

NCBI Bookshelf. A service of the National Library of Medicine, National Institutes of Health.

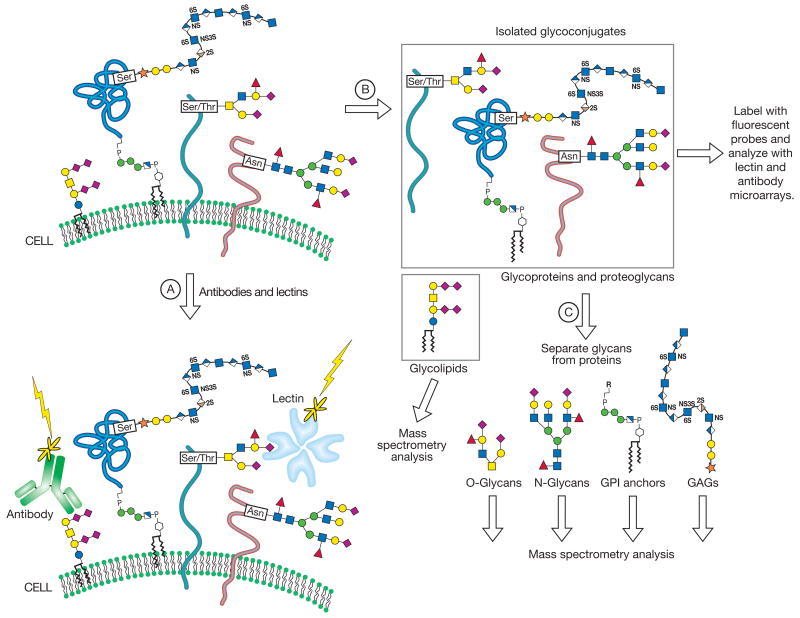
Multiple approaches for profiling a cell’s glycome at various hierarchical levels of complexity. (Step A) Cells can be directly probed for glycan expression using labeled lectins and glycan-specific antibodies. This top–down experiment provides a global view of the distribution of certain glycan epitopes on cells and tissues but does not afford detailed structural information. (Step B) Glycoproteins and glycolipids can be isolated from cell lysates and then analyzed using lectin and antibody microarrays and mass spectrometry methods. Glycolipids can be sequenced directly, whereas glycoproteins are often further deconstructed into separate glycans and proteins before structural analysis. (Step C) Isolated glycans are separated based on type (i.e., N-glycans, O-glycans, glycosaminoglycans, etc.) and their sequences determined by mass spectrometry. Alternatively, intact glycoproteins can be digested with trypsin and the glycopeptides characterized by mass spectrometry. This approach retains the glycan–peptide linkage and allows assignment of sites of protein glycosylation. Collectively, steps B and C comprise a bottom–up glycomic analysis.
Symbol Key:

Download Teaching Slide (PPT, 779K)
From: Chapter 48, Glycomics

NCBI Bookshelf. A service of the National Library of Medicine, National Institutes of Health.