

NCBI Bookshelf. A service of the National Library of Medicine, National Institutes of Health.
Probe Reports from the NIH Molecular Libraries Program [Internet]. Bethesda (MD): National Center for Biotechnology Information (US); 2010-.
A Small Molecule Inhibitor of Scavenger Receptor BI-mediated Lipid Uptake—Probe 1
Patrick W. Faloon, Chris Dockendorff, Willmen Youngsaye, Miao Yu, Partha Pratim Nag, Timothy A. Lewis, Melissa Bennion, Conor Paterson, Garrett Lam, Sivaraman Dandapani, Benito Munoz, Jose Perez, Michelle Palmer, Thomas J.F. Nieland, Monty Krieger, and Stuart L. Schreiber.
Author Information and Affiliations
Received: December 15, 2011; Last Update: September 18, 2014.
Scavenger receptor class B, type I (SR-BI) mediates selective uptake of cholesterol from high-density lipoprotein (HDL) particles, a poorly understood process that is distinct from endocytic uptake of lipoproteins, such as low-density lipoprotein (LDL). We set out to find small molecules that inhibit SR-BI function and could be used to characterize the mechanisms involved in HDL uptake. Using a cell-based DiI-HDL uptake assay, we performed a high-throughput screen (HTS) of the National Institutes of Health Molecular Libraries Probe Production Centers Network (NIH MLPCN) compound library. Of 319,533 compounds, 3,046 compounds (0.96%) were classified as inhibitors of DiI-HDL uptake. MLS001217863 (SID 49678600, CID 24761960) was identified in the primary HTS as an inhibitor. It had potent activity in the primary assay, a low hit rate in other MLPCN screens, and possessed structural properties suitable for analog synthesis. Structure activity relationship (SAR) studies were performed to improve potency and to minimize deleterious properties. These efforts generated a probe (CID 53377439/ML278), a low nanomolar inhibitor with improved potency and decreased toxicity liabilities. ML278 was tested for lipid efflux inhibition, modulation of HDL binding to SR-, and inhibition of endocytosis. ML278 functions by inhibiting both SR-BI-mediated lipid uptake and efflux of free cholesterol to HDL particles. As a tool compound, ML278 is superior to existing small-molecule inhibitors of SR-BI (e.g., BLT-1 and ITX-5061) and will be useful in elucidating how SR-BI mediates lipid transport. In addition, it could clarify the role of SR-BI in a number of biological processes where it plays a crucial role.
Assigned Assay Grant #: 2 R01 HL052212-11
Screening Center Name & PI: Broad Institute Probe Development Center, Stuart Schreiber
Chemistry Center Name & PI: Broad Institute Probe Development Center, Stuart Schreiber
Assay Submitter & Institution: Monty Krieger, Biology Department, Massachusetts Institute of Technology
PubChem Summary Bioassay Identifier (AID): 488952
Probe Structure and Characteristics

| CID/ML # | Target Name | IC50/EC50 (µM) [SID, AID] | Antitarget Name(s) | IC50/EC50 (μM) [SID, AID] | Fold Selective | Secondary Assay(s): IC50/EC50 (µM ) [SID, AID] |
|---|---|---|---|---|---|---|
| CID 53377439/ML278 | mSR-BI- mediated HDL uptake | IC50= 0.00093 [SID 125299400, AID 588828] | 24-hour cytotoxicity | >35 µM [SID 125299400, AID 588829] | >1000x | 1) 3 hour cytotoxicity >35 µM [SID 115950070, AID 588830] 2) [ldlA7] DiI-HDL uptake >35 µM [SID 125299400, AID 588825] |
Recommendations for Scientific Use of the Probe
The end goal of this project is to identify and to use small molecules to analyze the mechanisms of the HDL receptor, which is specifically referred to as the Scavenger receptor class B, type I (SR-BI)(1). SR-BI was the first high-density lipoprotein (HDL, ‘good’ cholesterol) receptor identified. SR-BI plays multiple roles in mammalian development, cellular physiology, and pathophysiology. It controls the structure and composition of plasma HDL, and levels and fates of HDL cholesterol, including delivery to the liver and steroidogenic tissues. SR-BI binds HDL and functions as a cell surface transporter to move cholesterol or its esters into or out of cells and as a signaling receptor to control cell function. SR-BI can also interact with and transport a plethora of other ligands. A new probe could be used to map important sites of interaction on SR-BI for these processes, to help identify possible intracellular binding partners, to verify whether SR-BI oligomerizes to mediate HDL interactions, or to improve our knowledge of other aspects of SR-BI biology.
We set out to identify probes with minimal cell cytotoxicity and fewer off-target effects compared with current SR-BI inhibitors. Blocker of lipid transport-1 (BLT-1) and several other inhibitors were identified in a pilot small-molecule screen as inhibitors of lipid uptake, with nanomolar potency in the case of BLT-1 (2). BLT-1 has been very useful in characterizing some aspects of the role of SR-BI in lipid uptake (3,4,5). Although BLT-1 has been shown to have nanomolar potency, it binds SR-BI irreversibly and is extremely toxic to cells, which has limited the use of the compound to short term in vitro assays.
The probe (ML278), which is described in this report, is a reversible binder without related cytotoxicity and has similar measured potency relative to BLT-1 (see Section 4.1), despite being a reversible inhibitor. Another molecule described in the literature, ITX-5061, disrupts HDL uptake but with lower potency than ML278 (see Section 4.1). In addition, ITX-5061 was originally developed to inhibit p38 MAP kinase activity (6). ML278 has shown an IC50 value of 0.93 nM compared with 254 nM for ITX-5061 in the primary assay (AID 588828). To date, we have not investigated ML278 against any kinases. Testing ML278 for off-target activities, including kinases, will be a part of early follow-up studies.
SR-BI has a wide variety of functions in physiology and pathophysiology.Lipoprotein metabolism impacts endothelial biology, platelet function, bile secretion, female fertility, steroidogenesis, and cholesterol homeostasis (7). SR-BI is considered to be a pattern-recognition receptor (PRR), a type of immune recognition receptor for microbial substances, such as lipopolysaccharide (LPS; 8). SR-BI has the ability to clear LPS and to suppress stimulation of NF-kB and cytokine stimulation via Toll-like receptors (TLRs; 9,10) A probe that blocks SR-BI in the context of immune cells could be useful in modulating the immune response, especially in the case of sepsis.
SR-BI serves as a co-receptor for Hepatitis C (HCV) viral entry, and interference with compound or blocking antibodies can reduce infection (11,12,13,14). It is possible that like ITX-5061, ML278 will block HCV infection. The presence of SR-BI also seems to enhance sporozite invasion efficiency of hepatocytes by the malaria parasite, Plasmodium falciparum (15,16). Blockade of SR-BI by small molecules, such as ML278 may help us to understand the precise mechanisms that viruses and pathogens use to enter human cells and cause disease.
1. Introduction
Scientific Rationale
Developing tools to analyze SR-BI function and mechanism of action, as well as the manipulation of the activity of SR-BI in vitro and in vivo, will have significant impact on our understanding in diverse areas of physiology and pathophysiology of considerable medical importance. Indeed, recent disappointments in attempts to develop HDL-focused pharmaceutical agents with other molecular targets highlight the importance of developing a deeper and broader understanding of all aspects of HDL metabolism including those mediated by SR-BI. Given the central role of SR-BI in lipid transfer and metabolism, inhibitors of SR-BI function will be useful tools to further probe the mechanisms of SR-BI, and may also have clinical utility, (such as in the inhibition of pathogen cell entry (e.g., HCV).
Several small-molecule inhibitors of SR-BI have been discovered (Figure 1). In 2002, Krieger and coworkers reported five compounds (BLTs 1-5) discovered via HTS that block lipid transport selectively via SR-BI, with nanomolar to micromolar potencies (6). Unfortunately, these probes exhibit an unacceptable level of cellular toxicity. The actions of four of these BLT compounds were confirmed to be on SR-BI itself, using assays with purified SR-BI reconstituted into liposomes (17). The diabetes drug glyburide, a potent inhibitor of the sulfonylurea receptors SUR1 and SUR2, was also found to have activity at SR-BI, though it was a relatively weak inhibitor of cholesterol efflux (3.) Researchers at Sankyo discovered that the protected piperazine R-138329 increased HDL-cholesterol in both mice and hamsters, presumably by inhibiting SR-BI-mediated uptake of HDL (18). Recently, a p38 MAP kinase inhibitor (ITX-5061), was reported to have similar in vivo effects and appears to be a moderate inhibitor of SR- BI-mediated cholesterol uptake (6). ITX-5061 is an inhibitor of HCV entry into cells, and is presently in Phase II trials as a HCV antiviral treatment. This compound was prepared in our laboratories and was profiled in our assays of interest. Finally, ITX-7650 has been described as an inhibitor of cholesterol uptake and HCV infection, but the structure remains undisclosed (12). See Section 4.1 for a further discussion of the prior art, as well as the search string table in Appendix G.
Figure 1
Reported Inhibitors of SR-BI.
A major goal of the proposed work is to identify a new SR-BI inhibitor that will provide a substantial improvement over the existing tool compounds under at least one of the following categories: 1) increased potency and reversibility; 2) reduced cellular toxicity; 3) new insights into mechanism; and 4) a unique activity profile (e.g., direct inhibition of ligand binding, differential influence on selective uptake and free cholesterol efflux).
2. Materials and Methods
See subsections for a detailed description of the materials and methods used for each assay.
Materials and Reagents
- DiI-HDL, custom purified HDL particles derived from human blood were prepared by the Assay Provider and labeled with 1,1′-dioctadecyl-3,3,3′,3′- tetramethylindocarbocyanine perchlorate (DiI; Catalog No. D-282; Invitrogen, Carlsbad, CA).
- Alexa 488 HDL, human HDL particles labeled with the Alexa Fluor® 488 Protein Labeling Kit (Catalog No. A-10235, Invitrogen; Carlsbad, CA) were purified and labeled by the Assay Provider.
- CellTiter-Glo® Luminescent Cell Viability Assay was purchased from Promega (Catalog No. G7573; Madison, WI).
- Radiolabeled cholesterol [1,2-3H(N)]-, 1 mCi (37 MBq) was obtained from PerkinElmer – NEN (Catalog No. NET139001MC; Waltham, MA).
- Alexa Fluor-594 conjugated human transferrin (Catalog No. T-13343) was obtained from Invitrogen.
Cell Lines
The following cell lines were used in this study:
- ldlA[mSR-BI] is a Chinese hamster ovary (CHO) cell line that overexpresses SR-BI and was obtained from the Assay Provider (Krieger Laboratory). This cell line was used for the primary assay and several secondary assays.
- [ldlA7] is the parental cell line to ldlA[mSR-BI] cells, and does not overexpress SR-BI, and can be used to rule out compound activity independent of SR-BI. This cell line was obtained from the Assay Provider.
2.1. Assays
A summary listing of completed assays and corresponding PubChem AID numbers is provided in Appendix A (Table A1). Refer to Appendix B for the detailed assay protocols.
2.1.1. DiI-HDL Uptake Assay (Primary Assay AIDs: AID 488896, AID 493194, AID 540354 AID 588392, AID 588553, AID 588548, AID 588754, AID 588828, AID 588833)
ldlA[mSR-BI] cells were plated into 384-well plates at 30 µl per well and incubated overnight. As a measurable surrogate for cholesterol uptake, human HDL particles were treated with the lipophilic fluorescent dye DiI and exposed to ldlA[mSR-BI] cells in lipoprotein-free media (Ham's F12/0.5% fatty acid-free Bovine Serum Albumin [BSA]/25 mM HEPES pH 7.4 plus 10 µg protein/ml DiI-HDL). Cells took up the Dil via the SR-BI receptor over 3 hours in the presence of compound. After significant uptake of the DiI, the cells became fluorescent. The level of fluorescence correlates with the amount of Dil uptake and can be measured with a standard plate reader. The uptake of lipid (represented by DiI) was inhibited by the compound BLT-1 or with an excess of HDL untreated with DiI.
The ldlA[mSR-BI] cells used in the assay were a CHO cell line lacking expression of the LDL receptors and overexpressing the Scavenger receptor (SR-BI). Inhibitors of SR-BI and HDL-mediated uptake lead to a reduction in fluorescence in this assay. Fluorescence was measured using a PerkinElmer EnVision plate reader. Primary HTS data were analyzed in Genedata Assay Analyzer, and were normalized against DMSO and 1 µM BLT-1 (positive control). For the HTS, the average of two replicates was used to rank order activity and to choose compounds for retests. For dose studies, the curves were generated with Genedata Condeseo and showed percent (%) activity for the individual doses.
2.1.2. Fluorescence Quencher Counterscreen (AID 588403, AID 540326)
The primary assay for this project measures a reduction in fluorescence by potential inhibitors. One possible explanation is that the compounds have inherent fluorescence-quenching properties and reduce signal in a dose-dependent manner without actually altering the uptake of the fluorescent substrate. We created an assay where compounds were pinned into assay buffer containing DiI-HDL without any cells. The compounds were incubated with DiI-HDL at 5 µg protein/ml in Ham's/25 mM HEPES/0.5% fatty acid-free BSA media for 30 minutes. Then, assay plates were measured with the identical settings for the primary assay. Compounds that quench DiI fluorescence lead to a dose-dependent loss of signal in this assay. Any compound that altered fluorescence or had an IC50 value of <30 µM was not considered for further studies.
2.1.3. Cell Cytotoxicity Assay (AID 540246, AID 588829, AID 588826, AID 588830, AID 588842, AID 602126)
It is possible that a compound will cause cells to decrease HDL-mediated Dil uptake due to nonspecific consequences of cellular toxicity. Therefore, lead compounds should not be toxic in the 3-hour time period used in the primary assay. The cells were treated with compounds for 3 hours or 24 hours, and then cell viability was measured using the CellTiter-Glo Assay (Promega), which is a luciferase-based reagent that measures cellular ATP levels. The compounds were tested at different doses to determine IC50 values. Compounds that were toxic after 3 hours with an IC50 value of less than 30 µM were excluded from additional studies. Compounds that were active in the primary assay but toxic below 30 µM at 24 hours (but nontoxic at 3 hours) were still considered but none of our preferred scaffolds showed cytotoxicity at either time point (see Figures 4C, 4D). Data were normalized against DMSO and BLT-1 (positive control) wells in Genedata Assay Analyzer. Curves were generated with Genedata Condeseo and showed percent (%) activity for the individual doses.

2.1.4. HDL Binding Assay (AID 588777, AID 588810)
HDL binding was assessed using Alexa Fluor 488-labeled HDL particles. For this assay, the Alexa 488 dye was covalently bound to apolipoprotein components of the HDL particle via primary amines; thus, no transfer of the fluorophore to cell membranes occurs. In this manner, direct binding of the HDL particles to SR-BI can be measured. As a positive control, BLT-1 was used at 1 µM, which is known to increase binding of HDL to SR-BI (2). It is possible that a compound can reduce binding of HDL to the receptor, and this would lead to a decrease in signal. This assay is used to characterize the mechanism of action of a particular compound; therefore, any outcome in the assay is acceptable. Data were normalized against DMSO and BLT-1 (positive control) wells in Genedata Assay Analyzer. Curves were generated with Genedata Condeseo and showed percent (%) activity for the individual doses.
2.1.5. Cholesterol Efflux Assay (AID 588818, AID 602152)
SR-BI also mediates bidirectional flux (e.g., efflux) of unesterified or ‘free’ cholesterol (FC) between cells and HDL or other acceptors. In vivo, the greatest SR-BI-mediated selective uptake occurs in the liver and steroidogenic organs. This assay is used to determine if the compounds alter the efflux of FC to HDL. Compounds that do and do not inhibit efflux in a dose-dependent manner will be of value.
On Day 0, 50,000 cells per well were plated in 24-well plates. On the following day, the media was removed and [3H]cholesterol in lipoprotein-deficient media was added. On Day 1, the medium was replaced with Ham's F12 medium supplemented with 10% bovine lipoprotein deficient serum with 1 µCi/ml [1,2-3H]cholesterol (40–60 Ci/mmol). On Day 3, the cells were washed to remove serum and incubated in Ham's F12 plus 1% fatty acid-free BSA. On Day 4, the cells were washed and pretreated with compounds for 1 hour. Subsequently, the cells were incubated for an additional 2 hours with the same concentrations of small molecules and with unlabeled HDL (final HDL concentration of 100 µg protein/ml). The media was collected to determine released cholesterol, and the cells were lysed. The amount of [3H]cholesterol in the media and cells was determined using liquid scintillation counting. Total cellular [3H]cholesterol was calculated as the sum of the radioactivity in the efflux medium plus the radioactivity in the cells and was used to calculate the [3H]cholesterol efflux (percent of total [3H]cholesterol released into the medium).
2.1.6. Mutant SR-BI Cholesterol Efflux Assay (AID 588843, AID 602138)
BLT-1 is known to interact at cysteine 384 of SR-BI (5). If the cysteine is mutated to serine, BLT-1 can no longer bind and shows no ability to inhibit cholesterol uptake. This assay is used to determine if the compounds work in a similar fashion to BLT-1 and require Cys384 to alter the efflux of free cholesterol to HDL. Compounds that do and do not inhibit efflux in a dose-dependent manner will be of value.
On Day 0, 50,000 C384S mutant cells per well were plated in 24-well plates. On the following day, the media was removed and [3H]cholesterol in lipoprotein-deficient media was added. On Day 1, the medium was replaced with Ham's F12 medium supplemented with 10% bovine lipoprotein deficient serum with 1 µCi/ml [1,2-3H]cholesterol (40–60 Ci/mmol). On Day 3, the cells were washed to remove serum and incubated in Ham's F12 plus 1% fatty acid-free BSA. On Day 4, the cells were washed and pretreated with compounds for 1 hour. Subsequently, the cells were incubated for an additional 2 hours with the same concentrations of small molecules and with unlabeled HDL (final HDL concentration of 100 µg protein/ml). The media was collected to determine released cholesterol, and the cells were lysed. The amount of [3H]cholesterol in the media and within cells was calculated using liquid scintillation counting. Total cellular [3H]cholesterol was determined as the sum of the radioactivity in the efflux medium plus the radioactivity in the cells and was used to calculate the [3H]cholesterol efflux (percent of total [3H]cholesterol released into the medium).
2.1.7. DiI-HDL Uptake Assay in the Absence of SR-BI (AID 588825)
In the primary assay, the cell line used to measure DiI-HDL uptake lacks the LDL receptor and overexpresses SR-BI. In this assay, the parental CHO cell line [ldlA7], which lacks the LDL receptor but does not overexpress SR-BI, was used to determine if inhibitors work via non-SR-BI-mediated mechanisms. As in the primary assay, 10 µg protein/ml of DiI-HDL was used to measure Dil uptake into the cells after 3 hours of incubation with different concentrations of compound. Little to no uptake of DiI-HDL was observed in these cells, and the only signal observed was minimal background staining.
2.1.8. Transferrin Endocytosis Assay (AID 602134)
This assay measures the endocytosis of an independent ligand, transferrin, which is not taken up via SR-BI but by clathrin-mediated endocytosis. This assay provides a measure of the selectivity of the inhibitors. Alexa-594-labeled transferrin is taken into the cell via endocytosis and localization of labeled transferrin was imaged in the various intracellular compartments. If a compound inhibits endocytosis, the labeled transferrin will not enter the cell leading to a decrease of fluorescent signal. Inhibitors of interest should act selectively at SR-BI and should have no activity in this assay.
Cells were pre-treated with compound for 3 hours and then treated with the Alexa-594 transferrin reagent for 30 minutes (Catalog No.T-13343; Invitrogen) in serum-free media. Plates of cells were then placed onto ice, washed with ice cold PBS, and then fixed with 4% paraformaldehyde. In addition, the nuclei were stained with 300 nM 4′,6-diamidino-2-phenylindole (DAPI) (Catalog No. 21490; Invitrogen). The cells were imaged with the Molecular Devices IXM microscope. Translocation measurements were performed using MetaExpress software computations and normalized for cell number.
2.1.9. DiI-HDL Uptake Assay with Washout (AID 588831)
This is a modification of the primary assay where cells are pretreated with compound but no compound is present during the DiI-HDL treatment period. ldlA[mSR-BI] cells were plated into 384-well plates at 30 µl per well and incubated overnight. As a measurable surrogate for cholesterol uptake, human HDL particles were treated with the lipophilic fluorescent dye DiI and exposed to ldlA[mSR-BI] cells in lipoprotein-free media (Ham's F12/0.5% fatty acid-free Bovine Serum Albumin [BSA]/25 mM HEPES pH 7.4 plus 10 µg protein/ml DiI-HDL). Cells were treated with compound for 3 hours prior to addition of DiI-HDL. Media were removed, cells were washed with PBS and fresh lipoprotein-free media was added with 10 µg protein/ml DiI-HDL. Cells took up the Dil via SR-BI over 3 hours in the absence of compound. After significant uptake of the DiI, the cells became fluorescent. The level of fluorescence correlates with the amount of Dil uptake and can be measured with a standard plate reader. The uptake of lipid (represented by DiI) was inhibited by the compound BLT-1.
The ldlA[mSR-BI] cells used in the assay were a CHO cell line lacking expression of the LDL receptors and overexpressing the Scavenger receptor (SR-BI). Inhibitors of SR-BI and HDL-mediated uptake lead to a reduction in fluorescence in this assay. Fluorescence was measured using a PerkinElmer EnVision plate reader. Primary HTS data was analyzed in Genedata Assay Analyzer, and were normalized against DMSO and 1 µM BLT-1 (positive control). For the HTS, the average of two replicates was used to rank order activity and to choose compounds for retests. For dose studies, the curves were generated with Genedata Condeseo and showed percent (%) activity for the individual doses.
2.1.10. DiI-HDL Uptake Assay with Extended Washout (AID 588831)
This is another modification of the primary assay where cells are pretreated but no compound is present during a 4-hour washout period and the 3-hour DiI-HDL treatment period. ldlA[mSR-BI] cells were plated into 384-well plates at 30 µl per well and incubated overnight. As a measurable surrogate for cholesterol uptake, human HDL particles were treated with the lipophilic fluorescent dye DiI and exposed to ldlA[mSR-BI] cells in lipoprotein-free media (Ham's F12/0.5% fatty acid-free Bovine Serum Albumin [BSA]/25 mM HEPES pH 7.4 plus 10 µg protein/ml DiI-HDL). Cells were treated with compound for 3 hours prior to addition of DiI-HDL. Cells were washed four times with PBS, washed once with lipoprotein-free media and returned to the incubator with lipoprotein-free media for 4 hours. Cells took up the Dil via SR-BI over an additional 3 hours in the absence of compound for a total of 7 hours. After significant uptake of the DiI, the cells became fluorescent. The level of fluorescence correlates with the amount of Dil uptake and can be measured with a standard plate reader. The uptake of lipid (represented by DiI) was inhibited by the compound BLT-1 or with an excess of HDL untreated with DiI.
The ldlA[mSR-BI] cells used in the assay were a CHO cell line lacking expression of the LDL receptors and overexpressing the Scavenger receptor (SR-BI). Inhibitors of SR-BI and HDL-mediated uptake lead to a reduction in fluorescence in this assay. Fluorescence was measured using a PerkinElmer EnVision plate reader. Primary HTS data was analyzed in Genedata Assay Analyzer, and were normalized against DMSO and 1 µM BLT-1 (positive control). For the HTS, the average of two replicates was used to rank order activity and to choose compounds for retests. For dose studies, the curves were generated with Genedata Condeseo and showed percent (%) activity for the individual doses.
2.1.11. Lipid Transport Assay in Liposomes (AID 602155)
This assay provides extra confirmation of activity via SR-BI by measuring the uptake of [3H]CE into liposomes loaded with purified SR-BI. For the purification of C-terminally epitope-tagged murine SR-BI (mSR-BI-t1) with uniform, truncated N-linked oligosaccharide chains, we overexpressed mSR-BI-t1 in HEK293S cells. The mSR-BI-t1 was expressed in an N-acetylglucosaminyltransferase I (GnTI)-defective HEK293S derivative, HEK293S GnTI(2), which generates a glycoprotein with uniform, truncated N-linked oligosaccharide chains under the control of a tetracycline-inducible promoter. It was immunoaffinity purified to virtual homogeneity, and the detergent-solubilized receptor was reconstituted into liposomes as described previously (4). Briefly, 20 µg of SR-BI (or an equivalent volume of protein-free buffer to generate control liposomes that are devoid of SR-BI) was reconstituted into liposomes by acetone precipitation. SR-BI liposomes were washed once by resuspension of the acetone precipitate in protein-free assay medium followed by a centrifugation step for 25 min and 48,000 g at 4 ºC. The pellet was first reconstituted in assay medium without protein, and then an equal volume of assay medium with 1% fatty acid -free BSA was added to yield liposomes at a nominal final concentration of 18 ng SR-BI/ml. In each reaction, 30 ml were preincubated together with 30 ml of assay medium containing 0.5% fatty Acid-free BSA, 1% DMSO, and the indicated compounds for 60 min at 37 ºC. Subsequently, 20 µl of [3H]CE-HDL (five replicates per sample) were added to a final concentration of 10 µg protein/ml. Incubation was continued for 4 hours at 37 ºC, and then SR-BI selective uptake of [3H]CE into liposomes was determined using the previously described filter binding assays (4). The 100% of control value represents receptor-specific activity in SR-BI-t1-containing liposomes in the presence of 0.5% DMSO without compounds, and the 0% of control value represents background selective uptake in control liposomes devoid of SR-BI-t1.
2.2. Probe Chemical Characterization
The probe (ML278) was prepared as described in Section 2.3, and was analyzed by UPLC, 1H and 13C NMR spectroscopy, and high-resolution mass spectrometry. The data obtained from NMR and mass spectrometry were consistent with the structure of the probe, and UPLC analysis showed purity of >95%. Characterization data (1H NMR spectra and UPLC chromatograms) of the probe are provided in Appendix E.
The solubility of ML278 was determined to be 0.57 µM in Phosphate buffered saline (PBS; pH 7.4, 23 °C) solution with 1% DMSO. The stability of the probe in PBS (1% DMSO) was measured over 48 hours. We noticed that the concentration of the probe fluctuated through the course of the assay (data not shown). We believe that this fluctuation is due to the low solubility of the probe. Thus, we decided to determine the amount of undissolved probe present in the well after it was treated with PBS for a given length of time, relative to the amount of undissolved probe at the start of the assay. The wells were centrifuged and the supernatant was removed after various time points, then acetonitrile was added to dissolve the remaining solid in the wells, and the amount of probe was quantified. From these results, the probe seems to be stable to PBS (Figure 2). The stability of the probe was confirmed by measuring stability in human plasma, with >99% remaining after a 5-hour incubation period. Plasma protein binding (PPB) studies showed that it was 93.5% bound in human plasma.
Figure 2
Recovery of Undissolved Probe (ML278) from PBS Buffer (pH 7.4, 23 °C). Percent (%) Recovered is relative to the undissolved solid recovered at T = 0 (100%), quantified by LC-MS.
Experimental procedures for the various analytical assays are provided in Appendix D. Table 1 summarizes known properties of the probe.
Table 1
Summary of Known Probe (ML278) Properties Computed from Structure.
2.3. Probe Preparation
The probe was prepared using the sequence outlined in Scheme 1, which was designed for flexibility in producing analogs with diverse indoline N-substituents. A streamlined route to the probe (or a specific analog) is anticipated by alternatively starting the synthesis by N-acylating indoline with the desired building block (e.g., methoxyacetyl chloride). Such a synthesis has been tested in the production of analogs with the indoline N-propionyl substitution pattern. In the sequence described in Scheme 1, indoline was protected with benzenesulfonyl chloride, and the resulting sulfonamide underwent efficient Friedel-Crafts acylation with chloroacetyl chloride. The sulfonamide was then hydrolyzed by heating with concentrated sulfuric acid, and then the crude chloroketone product was condensed with thiourea at elevated temperature to generate the desired 2-aminothiazole. Protection of the indoline nitrogen occurred with excellent selectivity using Boc2O, then the aminothiazole was acylated with 2,4-dimethoxybenzoyl chloride. The indoline was then deprotected and acylated with 2-methoxyacetyl chloride to generate the final probe. Full experimental details are provided in Appendix C.
Scheme 1
Synthesis of Probe (CID53377439/ML278).
3. Results
Probe attributes
- Has an IC50 value as low as 0.00093 µM in the DiI-HDL uptake assay.
- Shows no apparent cytotoxicity after 24 hours of treatment (IC50= >35 µM).
- Inhibits efflux of cholesterol.
- Does not inhibit endocytosis of transferrin.
- Is a reversible inhibitor.
To identify novel inhibitors, SR-BI-mediated lipid uptake was measured in a customized cell line that minimized potential uptake by other mechanisms, including via the LDL receptor (1). This primary cell-based assay was used in a pilot screen that identified BLTs 1 through 5 (2). The assay was slightly modified from the original protocol of Nieland et al. to increase throughput and to ease automation procedures.
Briefly, the plate reader was switched to a Perkin-Elmer EnVision, several washing steps were eliminated, and the cell number per well was reduced without impacting the robustness of the assay. The automated assay was first tested with a validation set of 2,240 compounds. These compounds were tested in duplicate with in-plate neutral (DMSO) and positive controls. Robustness, reproducibility, and variability parameters were analyzed before initiating the full HTS. The HTS was run over the course of several weeks. Data were normalized relative to controls, and plate patterns were corrected using a multiplicative algorithm in the Genedata Assay Analyzer. For each compound, the average of the two replicates was determined and used for subsequent analysis.
Determination of hits required several criteria: only assay plates with a Z' greater than 0.3 were accepted for analysis, compounds needed to reach 70% inhibition relative to 1 µM BLT-1, and score in fewer than 10% of HTS assays listed in PubChem. In total, 318,714 compounds were screened. Of these, 3,046 compounds were considered active (a hit rate of 0.96%), 613 were inconclusive, and 315,055 were inactive. Compounds were clustered based upon chemical structure using a customized script in Pipeline Pilot. Clusters were rated based upon structural liabilities and ranked accordingly. Substructures were analyzed and compared to inactive compounds to identify inactive analogs. Representatives from the more desirable clusters were selected for retest. In addition, a small number of inactive analogs were chosen to provide initial structure activity relationship (SAR) data during the dose retest studies. Of these, 573 compounds were retested over a range of concentrations to validate activity, and 186 compounds showed dose-dependent inhibition of DiI-HDL uptake.
Since active compounds produce a decrease in signal in the primary assay, confirmation was required that the reduction in fluorescence was not a result of quenching by the compound. Compounds were tested in the presence of DiI-HDL in a cell-free version of the primary assay. Of compounds that were active in the primary assay, 127 active compounds were found to quench the DiI signal and 59 active compounds showed no alteration of fluorescence in the quenching assay.
All available dry powder samples of the remaining, non-quenching compounds were procured from commercial sources and purities were determined. The compounds obtained were then retested in the primary assay and in cell cytotoxicity assays. We wanted to rule out any compounds that were cytotoxic, especially in the 3-hour time span of the primary DiI-HDL uptake assay. Therefore, compounds were tested in [ldlA]mSR-BI cells for cytotoxicity at 3 hours and 24 hours using the CellTiter-Glo assay (Promega) that measures cellular ATP as a surrogate marker of cell viability. Of these, 11 compounds showed an IC50 value of less than 35 µM and were excluded from further consideration. Approximately 44 compounds had an IC50 value below 10 µM in the DiI-HDL assay. Fifteen chemical scaffolds showed potencies below 1 µM, and three of these were prioritized for follow-up studies. Compounds were screened for inhibiting endocytosis using labeled transferrin, which is known to bind the transferrin receptor, enter cells by clathrin-mediated endocytosis, and move to endosomes before being recycled to the cell surface. The BLT compounds have been tested for potential interference with endocytosis and show no such activity (2).
The original hit described in this report, MLS001217863 (Figure 3, SID 49678600, CID 24761960), did not alter endocytosis of transferrin nor did ML278 (Figure 10B, AID 602134). The indoline-thiazole scaffold of CID 24761960 registered an IC50 value in the primary assay of 0.035 µM (Figure 4, AID 540354), and was prioritized for further development. Analogs were designed and synthesized, eventually leading to the more potent probe, ML278 (see Section 3.4)

Figure 3
The Indoline-thiazole Scaffold of MLS001217863.
3.1. Summary of Screening Results
Refer to subsections for a detailed description of the results.
In the primary HTS, compounds were active if they decreased DiI-HDL uptake as measured by fluorescence. The positive control, BLT-1 (1 µM), caused a decrease in uptake that led to over a 2.2-fold reduction in signal. Compounds with greater than 70% activity of the positive control were considered actives and chosen for confirmation studies (see Section 3.4 for details).
Figure 5 displays the critical path for probe development. To explore SAR, a number of analogs were synthesized and tested. Selected results are shown in Tables 2-7 in Section 3.4.
Figure 5
Critical Path for Probe Development.
Table 2
SAR Analysis of Probe 1 Western Amide: 5-Membered Heterocycles.
Table 7
SAR Analysis of Probe 1 Eastern N-substitutent: Select Analogs.
3.2. Dose Response Curves for Probe
.&p=BOOKS&id=133420_ml278f9.jpg "Click on image to zoom")
Figure 6Dose Response Curves for the Probe (ML278)
ML278 was used over a range of concentrations up to 35 μM in the primary DiI-HDL uptake assay, IC50=0.00093 µM (AID 588828) (A), Alexa-488 HDL binding assay, AC50 = 0.035 µM (AID 588810) (B), the DiI-HDL ldlA7 counterscreen, IC50 >35 µM (AID 588825) (C), and 24-h CellTiter-Glo cytotoxicity, IC50 > 35 µM (AID 588829) (D). Dose curves were generated with Genedata Condeseo and shows normalized percent activity for the individual doses. ○=replicate 1, △=replicate 2
3.3. Scaffold/Moiety Chemical Liabilities
Probe 1 (ML278) has no apparent chemical liabilities, which is also supported by its good plasma stability.
3.4. SAR Tables
The biological assay data of the probe and analogs are presented in Tables 2-7. Characterization data (1H NMR spectra and UPLC chromatograms) of these analogs are provided in Appendix H. Data on additional analogs is included in Appendix I.
The hit compound (Table 2, Entry 1) showed good potency (average IC50 for HDL-mediated lipid uptake = 0.057 μM). A large number of furan replacements were prepared, allowing the SAR at the western end of the molecule to be explored (Table 2). This was also a priority due to the possible metabolic and toxicity liability presented by the furan. The position of the furan oxygen is critical, as the 3-substituted analog (Table 2, Entry 2) was >150-fold less active. Disappointingly, the racemic tetrahydrofuran (Table 2, Entry 3) also had relatively weak activity, as did the 2-thiophene analog (Table 2, Entry 4). Introduction of a nitrogen heteroatom into the ring (Table 2, Entries 5-7) also decreased activity significantly. 3- and 4-pyridyl analogs (Table 3, Entries 2, 3, 7) showed moderate activity; the 2-pyridyl analog (Table 2, Entry 4) was insoluble in DMSO and could not be tested. The benzofuran analog (Table 3, Entry 5) showed a drop in activity relative to the hit furan (0.26 μM), though the 7-azabenzofuran showed reasonable potency (Table 3, Entry 6, IC50 = 0.14 μM). It should be noted that almost all of the compounds in this report showed no significant cytotoxicity at 24 hours.
Table 3
SAR Analysis of Probe 1 Western Amide: Other Heteroarenes.
Caution should be taken with SAR analysis in this series, as the compounds nearly all have measured solubility in PBS of <1 μM, and some compounds showed poor solubility even in DMSO. However, the top compounds in this report were sufficiently potent (down to low nanomolar IC50 values) that reproducible inhibition was observed despite low measured solubilities. A representative series of western aryl analogs of the hit compound is presented in Table 4 (other compounds are presented in Appendix I). A hydrogen bond acceptor at the 3-position of the benzamide appears to be critical for high potency as the 3-methoxybenzamide (Table 4, Entry 5) was the first analog we observed with activity (IC50 = 0.038 μM) equivalent or superior to the furan ). The 3-trifluoromethoxy analog (Table 4, Entry 6) also had decent activity (IC50 = 0.11 μM). Addition of a second methoxy group (Table 4, Entry 7) gave the most potent analog yet prepared (IC50 = 0.033 μM), though its potency advantage over other analogs is not as significant as we originally observed. Nonetheless, we fixed the 3,5-dimethoxybenzamide moiety in order to explore SARs at many other parts of the molecule. However, some of the analogs exploring SAR at other regions of the molecule were prepared before the discovery of the high potency of 3,5-dimethoxybenzamide and, hence, some of the entries in the subsequent SAR tables also have the furan substitutent at the western portion.
Table 4
SAR Analysis of Probe 1 Western Aamide: Selected Arene Analogs.
Analogs with modified benzamides moieties were prepared to explore the requirements for the amide functional group. Amide N-methylation (Table 5, Entry 1) reduced the potency >50-fold. Reductive amination of 3,5-dimethoxybenzaldehyde with the 5-substituted 2-aminothiazole (used to prepare all of the analogs thus described) gave a secondary amine (Table 5, Entry 2), which also had reduced activity. Using numerous multistep synthetic approaches, several replacements for the central thiazole ring were prepared. Oxazole (Table 5, Entry 3), imidizole (Table 5, Entry 4), and oxadiazole (Table 5, Entry 5) analogs of the furan hit all poorly inhibited HDL-mediated lipid uptake, indicating that the thiazole is critical for activity. The Boc-protected indoline of the oxadiazole is analogous to a thiazole compound with a Boc group in the same position (Table 7, Entry 6), which showed outstanding potency. Finally, a 5-methyl thiazole analog (Table 4, Entry 6) showed good potency (IC50 = 0.040 μM), suggesting that substituted central heterocycles are tolerated and could enable additional modifications in the future.
Table 5
SAR Analysis of Probe 1: Functional Group Modifications and Central Ring SAR.
Next, modifications to the indoline ring were explored (Table 6). Removal of the acyl group from the indoline (Table 5, Entry 1) maintained some activity (IC50 = 0.11 μM), but was approximately 3-fold less potent than the analogous propionamide (Table 3, Entry 7). The related N-unsubstituted indole (Table 6, Entry 2) also showed decreased activity relative to its propionamide derivative (Table 6, Entry 3, IC50 = 0.10 μM). Several aniline analogs were prepared (Table 6, Entries 4, 5), which correspond to removal of the bridging ethylene of the indoline system. The 3-methoxybenzamide (Table 6, Entry 5) showed good potency (IC50 = 0.066 μM) demonstrating that the indoline ring is not strictly required for activity. Preliminary results with substituted indolines are very promising, as several 3,3-dimethylindolines (Table 6, Entries 6 and 7) showed very good activity (IC50 = 0.008 μM for the 3,5-dimethoxybenzamide analog, Entry 6). Thus, modification of the indoline ring could facilitate attractive new compounds in future medicinal chemistry campaigns.
Table 6
SAR Analysis of Probe 1: Modifications to Indoline Ring.
Finally, the nature of the indoline N-substituent was explored in detail (Table 7). Removal of the amide oxygen caused the activity to drop off substantially (indole N-propyl analog, (Table 7, Entry 1). Replacement of the ethyl amide substituent with an isopropyl group gave a moderate drop in activity (Table 7, Entry 2), as did the replacement of the amide with a sulfonamide (Table 7, Entry 3). A variety of other functionalities could also be introduced which maintained or improved activity, including an acetamide (Table 7, Entry 4), carbamates (Table 7, Entries 5, 6), and a urea (Table 7, Entry 7). The Boc carbamate (Table 7, Entry 6) was extremely potent (IC50 = 0.9 nM), and is the most potent compound we have tested thus far. Several substituted amides (Table 7, Entries 8, 9) were additionally prepared in an attempt to improve the water solubility of this series (typically < 1 μM in PBS). The measured solubilities were surprisingly low, but the methoxy-substituted amide (Table 7, Entry 9) had acceptable solubility (0.57 μM) for a compound with outstanding potency (IC50 = 2 nM), and has been nominated here as the probe (ML278).
3.5. Cellular Activity
The primary assay and several of the secondary assays are cell-based experiments. The compound shows activity in cells and the effective IC50 value for the probe in the primary assay (averaging 0.002 µM over multiple assays and compound batches) is well below the measured PBS solubility (0.57 µM). This inhibition of uptake was confirmed with a nonfluorescent, radiolabeled version of the assay with an average IC50 value of 1 µM (AID 588836). Since SR-BI is a cell-surface receptor (and the compound is presumed to act on the extracellular surface), cell permeability is not an issue, though the probe is expected to have reasonable permeability. ML278 showed no cytotoxicity at 24 hours (Figure 6C, AID 540326). The precise mode of action for the probe is not known but several supplemental assays suggest a selective and direct interaction with SR-BI (see Mechanism of Action, Section 4.2). The probe shows no effect on the endocytosis of transferrin, at concentrations up to 35 µM (Figure 10B, AID 602134).
3.6. Profiling Assays
The probe will be sent to Ricerca for evaluation of off-target binding to a broad panel of receptors, ion channels and enzymes. Metabolic stability will also be evaluated.
4. Discussion
The HTS campaign described in Section 3.1 of a library of small molecules identified a hit that was modular and amenable to medicinal chemistry studies. We tested dozens of synthetic analogs and identified several key structure-activity relationships (SARs) (Figure 7). We subsequently designed and synthesized additional analogs, leading to the identification of the probe (ML278).
Figure 7
Summary of SAR Performed.
Currently, the probe is not listed in PubChem, but it was modified from the original HTS hit compound (MLS001217863). According to PubChem, MLS001217863 (CID 24761960) has been tested in 315 bioassays and was active in five primary assays excluding inhibition of SR-BI uptake (AID 1814, AID 2314, AID 485270, AID 492964, and AID 588497). No dose retest was reported for these projects as of the date of submission for this probe report. There is no obvious connection between SR-BI cholesterol metabolism and the other assays (alpha-Synuclein 5′ UTR binding activator, and Orexin-1 receptor antagonism). Another assay with reported activity is the Shiga toxin cycloheximide counterscreen, which is looking for protein synthesis inhibitors or stabilizers of luciferase but no activity concentration was reported in PubChem. Therefore, we expect the probe to have good selectivity over other biological targets, and selectivity will be confirmed by a Ricerca off-target binding screen. In summary, 62 analogs were prepared and screened, leading to a probe with slightly improved solubility and improved potency (>20-fold) over the original hit. The furan of the hit was also replaced, which is a potential toxicophore.
Table 8 presents a comparison of the activity and selectivity profile of the probe (ML278) with the probe criteria decided upon in the chemical probe development plan (CPDP).
Table 8
Comparison of the Probe to Project Criteria.
4.1. Comparison to Existing Art and How the New Probe is an Improvement
Several prior art compounds were compared to ML278, and the properties of the probe exceed the prior art (Figure 8, AID 588828). BLT-1 is a potent inhibitor of SR-BI-mediated lipid uptake and of free cholesterol efflux. It is a nonreversible, covalent modifier of SR-BI and is toxic to cells. ML278 does not have any structural motifs that suggest covalent modification. It is a reversible inhibitor of HDL uptake (AID 588831, AID 602154) and shows no cytotoxicity in ldlA[mSR-BI] cells (Figure 6, AID 588829). Another inhibitor of SR-BI is ITX-5061. It was originally identified as a p38 MAPK inhibitor that was found to elevate circulating levels of HDL-cholesterol in human patients (6). We synthesized ITX-5061 and tested it in multiple assays. In every experiment, ML278 outperformed ITX-5061, with an approximate 250-fold higher potency (Figure 8, AID 588828). As discussed in Section 1, ITX-5061 is also a known MAP kinase inhibitor, and it contains a ketoamide functionality that may be susceptible to covalent reaction with various targets.
Investigation into relevant prior art entailed searching the following databases: SciFinder, Web of Science, PubMed, and Patent Lens. The search terms applied and hit statistics for the prior art search are provided in Table A2 (Appendix G). Abstracts were obtained and were analyzed for relevance to the current project. The searches are current as of November 26, 2011.
4.2. Mechanism of Action Studies
ML278 and selected analogs were tested in several secondary assays that address possible mechanisms of action. In addition to binding of HDL particles and uptake of esterified cholesterol into the cell, SR-BI also plays a role in the efflux of free cholesterol (FC) from the cell to recipient HDL particles. Compounds were tested to determine if there was an impact on efflux from cells. Similar to BLT-1, ML278 reduces efflux of FC from cells by up to 50% during the course of the assay (Figure 9B, AID 602152). Unlike BLT-1, ML278 was shown to be a reversible inhibitor in the DiI uptake assay. In experiments where cells were treated with compounds for 3 hours prior to addition of DiI-HDL, ML278 showed no inhibition at the IC50 concentration (AID 588831) and had an IC50 value of 0.006 µM compared to 0.3 µM when compound tested under standard assay conditions (AID 588833 versus AID 588831). If cells were allowed to incubate for 4 hours after compound treatment and prior to DiI-HDL incubation, the IC50 value increases to 0.860 µM.

In comparison, BLT-1 registers an IC50 value of 600 pM after the 4-hour washout period (AID 602154), reflecting the progression of its covalent reaction with cysteine 384 of SR-BI (5). ML278 was tested for efflux in a cell line that only expresses a mutant form of the protein where Cys384 is converted to a serine residue. In this mutant background, BLT-1 does not significantly reduce uptake of HDL or efflux of cholesterol. Conversely, ML278 can reduce uptake and efflux in the mutant background suggesting that the compound might work at a different site of the receptor that does not involve Cys384 (Figure 9B). However, the comparison between ML278 and BLT-1 is complicated by the fact that ML278 is not a covalent inhibitor. Characterization of BLT-1 as a covalent inhibitor was not made until after the bulk of this project was completed (5). We assessed binding of HDL to the SR-BI receptor using an Alexa-488 labeled HDL. Similar to BLT-1, ML278 increases binding of HDL to the receptor (Figure 6D, AID 588810). Further studies need to be performed to determine the nature of this tertiary interaction (2).
Outside the scope of the CPDP, ML278 was tested with SR-BI in purified liposomes (Figure 9C, AID 602155). These data suggest a direct interaction between the probe and SR-BI. These data substantiate results in [ldlA7] cells where SR-BI is required for compound activity (Figure 9B, AID 588825).
4.3. Planned Future Studies
Extensive medicinal chemistry was performed to generate ML278, a highly potent SR-BI inhibitor. Some additional medicinal chemistry work is in progress to produce new analogs with improved solubility, though deadlines dictated that this work could not be described here. We will also examine the surface expression levels of the SR-BI protein. Much work remains to be done to elucidate the specific interactions between the probe and SR-BI. These studies will be performed by the Assay Provider. The liposome studies demonstrate that there is direct interaction between the receptor and ML278, but the specific site of interaction remains to be determined. Multiple mutant versions of the receptor are available and will help to identify what portion of SR-BI is needed for interaction. SR-BI has been shown to dimerize, and ML278 will be tested with various dimerization-incompetent forms of the receptor to determine if the compounds interfere with dimerization (19). In addition, future studies could investigate if the probe prevents interaction with other proteins that are known to interact with SR-BI (20). These studies depend upon knowledge of the site of interaction on SR-BI.
Our assays have been focused on SR-BI relative to cholesterol metabolism. SR-BI also has roles in immunity and acts as a co-receptor for malaria and hepatitis C virus infection. We plan to test ML278 for its ability to reduce or prevent infection of cells with these two pathogens. Compounds will be tested in collaboration with researchers at the National Institute of Allergy and Infectious Diseases (NIAID) and at the Broad Institute.
5. References
- 1.
- Acton S, Rigotti A, Landschulz KT, Xu S, Hobbs HH, Krieger M. Identification of scavenger receptor SR-BI as a high density lipoprotein receptor. Science. 1996 Jan 26;271(5248):518–20. [PubMed: 8560269]
- 2.
- Nieland TJ, Penman M, Dori L, Krieger M, Kirchhausen T. Discovery of chemical inhibitors of the selective transfer of lipids mediated by the HDL receptor SR-BI. Proc Natl Acad Sci U S A. 2002 Nov 26;99(24):15422–7. Epub 2002 Nov 18. [PMC free article: PMC137732] [PubMed: 12438696]
- 3.
- Nieland TJ, Chroni A, Fitzgerald ML, Maliga Z, Zannis VI, Kirchhausen T, Krieger M. Cross-inhibition of SR-BI- and ABCA1-mediated cholesterol transport by the small molecules BLT-4 and glyburide. J Lipid Res. 2004 Jul;45(7):1256–65. Epub 2004 Apr 21. [PubMed: 15102890]
- 4.
- Nieland TJ, Shaw JT, Jaipuri FA, Maliga Z, Duffner JL, Koehler AN, Krieger M. Influence of HDL-cholesterol-elevating drugs on the in vitro activity of the HDL receptor SR-BI. J Lipid Res. 2007 Aug;48(8):1832–45. Epub 2007 May 28. [PubMed: 17533223]
- 5.
- Yu M, Romer KA, Nieland TJ, Xu S, Saenz-Vash V, Penman M, Yesilaltay A, Carr SA, Krieger M. Exoplasmic cysteine Cys384 of the HDL receptor SR-BI is critical for its sensitivity to a small-molecule inhibitor and normal lipid transport activity. Proc Natl Acad Sci U S A. 2011 Jul 26;108(30):12243–8. Epub 2011 Jul 11. [PMC free article: PMC3145699] [PubMed: 21746906]
- 6.
- Masson D, Koseki M, Ishibashi M, Larson CJ, Miller SG, King BD, Tall AR. Increased HDL cholesterol and apoA-I in humans and mice treated with a novel SR-BI inhibitor. Arterioscler Thromb Vasc Biol. 2009 Dec;29(12):2054–60. Epub 2009 Oct 8. [PMC free article: PMC2783626] [PubMed: 19815817]
- 7.
- Rigotti A, Miettinen HE, Krieger M. The role of the high-density lipoprotein receptor SR-BI in the lipid metabolism of endocrine and other tissues. Endocr Rev. 2003 Jun;24(3):357–87. [PubMed: 12788804]
- 8.
- Fioravanti J, Medina-Echeverz J, Berraondo P. Scavenger receptor type B, class I: A promising immunotherapy target. Immunotherapy. 2011 Mar;3(3):395–406. [PubMed: 21395381]
- 9.
- Guo L, Song Z, Li M, Wu Q, Wang D, Feng H, Bernard P, Daugherty A, Huang B, Li XA. Scavenger receptor BI protects against septic death through its role in modulating inflammatory response. J Biol Chem. 2009 Jul 24;284(30):19826–34. Epub 2009 Jun 2. [PMC free article: PMC2740408] [PubMed: 19491399]
- 10.
- Zhu P, Liu X, Treml LS, Cancro MP, Freedman BD. Mechanism and regulatory function of CpG signaling via scavenger receptor B1 in primary B cells. J Biol Chem. 2009 Aug 21;284(34):22878–87. Epub 2009 Jun 19. [PMC free article: PMC2755695] [PubMed: 19542230]
- 11.
- Catanese MT, Graziani R, von Hahn T, Moreau M, Huby T, Paonessa G, Santini C, Luzzago A, Rice CM, Cortese R, Vitelli A, Nicosia A. High-avidity monoclonal antibodies against the human scavenger class B type I receptor efficiently block hepatitis C virus infection in the presence of high-density lipoprotein. J Virol. 2007 Aug;81(15):8063–71. Epub 2007 May 16. [PMC free article: PMC1951280] [PubMed: 17507483]
- 12.
- Catanese MT, Ansuini H, Graziani R, Huby T, Moreau M, Ball JK, Paonessa G, Rice CM, Cortese R, Vitelli A, Nicosia A. Role of scavenger receptor class B type I in hepatitis C virus entry: kinetics and molecular determinants. J Virol. 2010 Jan;84(1):34–43. [PMC free article: PMC2798406] [PubMed: 19828610]
- 13.
- Voisset C, Callens N, Blanchard E, Op De Beeck A, Dubuisson J, Vu-Dac N. High density lipoproteins facilitate hepatitis C virus entry through the scavenger receptor class B type I. J Biol Chem. 2005 Mar 4;280(9):7793–9. Epub 2005 Jan 4. [PubMed: 15632171]
- 14.
- Syder AJ, Lee H, Zeisel MB, Grove J, Soulier E, Macdonald J, Chow S, Chang J, Baumert TF, McKeating JA, McKelvy J, Wong-Staal F. Small molecule scavenger receptor BI antagonists are potent HCV entry inhibitors. J Hepatol. 2011 Jan;54(1):48–55. Epub 2010 Aug 21. [PubMed: 20932595]
- 15.
- Rodrigues CD, Hannus M, Prudêncio M, Martin C, Gonçalves LA, Portugal S, Epiphanio S, Akinc A, Hadwiger P, Jahn-Hofmann K, Röhl I, van Gemert GJ, Franetich JF, Luty AJ, Sauerwein R, Mazier D, Koteliansky V, Vornlocher HP, Echeverri CJ, Mota MM. Host scavenger receptor SR-BI plays a dual role in the establishment of malaria parasite liver infection. Cell Host Microbe. 2008 Sep 11;4(3):271–82. [PubMed: 18779053]
- 16.
- Yalaoui S, Huby T, Franetich JF, Gego A, Rametti A, Moreau M, Collet X, Siau A, van Gemert GJ, Sauerwein RW, Luty AJ, Vaillant JC, Hannoun L, Chapman J, Mazier D, Froissard P. Scavenger receptor BI boosts hepatocyte permissiveness to Plasmodium infection. Cell Host Microbe. 2008 Sep 11;4(3):283–92. [PubMed: 18779054]
- 17.
- Nieland TJ, Shaw JT, Jaipuri FA, Duffner JL, Koehler AN, Banakos S, Zannis VI, Kirchhausen T, Krieger M. Identification of the molecular target of small molecule inhibitors of HDL receptor SR-BI activity. Biochemistry. 2008 Jan 8;47(1):460–72. Epub 2007 Dec 8. [PMC free article: PMC2736594] [PubMed: 18067275]
- 18.
- Nishizawa T, Kitayama K, Wakabayashi K, Yamada M, Uchiyama M, Abe K, Ubukata N, Inaba T, Oda T, Amemiya Y. A novel compound, R-138329, increases plasma HDL cholesterol via inhibition of scavenger receptor BI- mediated selective lipid uptake. Atherosclerosis. 2007 Oct;194(2):300–8. Epub 2006 Dec 12. [PubMed: 17166497]
- 19.
- Gaidukov L, Nager AR, Xu S, Penman M, Krieger M. Glycine dimerization motif in the N-terminal transmembrane domain of the high density lipoprotein receptor SR-BI required for normal receptor oligomerization and lipid transport. J Biol Chem. 2011 May 27;286(21):18452–64. Epub 2011 Mar 25. [PMC free article: PMC3099662] [PubMed: 21454587]
- 20.
- Kocher O, Krieger M. Role of the adaptor protein PDZK1 in controlling the HDL dSR-BI. Curr Opin Lipidol. 2009 Jun;20(3):236–41. [PMC free article: PMC2849150] [PubMed: 19421056]
Appendix A. Assay Summary Table
Table A1Summary of Completed Assays and AIDs
| PubChem AID | Type | Target | Concentration Range (µM) | Samples Tested |
|---|---|---|---|---|
| 488952 | Summary | SR-BI Inhibitor Project | NA | NA |
| 488896 | Cell-based | SR-BI, DiI-HDL uptake | 7.5 µM | 319,533 |
| 493194 | Cell-based | SR-BI, DiI-HDL uptake | 0.015-35 µM | 472 |
| 540354 | Cell-based | SR-BI, DiI-HDL uptake | 0.046-35 µM | 11 |
| 588392 | Cell-based | SR-BI, DiI-HDL uptake | 0.000195-35 µM | 31 |
| 588553 | Cell-based | SR-BI, DiI-HDL uptake | 0.015-35 µM | 32 |
| 588548 | Cell-based | SR-BI, DiI-HDL uptake | 0.015-35 µM | 32 |
| 588754 | Cell-based | SR-BI, DiI-HDL uptake | 28.5 fM-35 µM | 35 |
| 588828 | Cell-based | SR-BI, DiI-HDL uptake | 28.5 fM-35 µM | 35 |
| 588833 | Cell-based | SR-BI, DiI-HDL uptake | 28.5 fM-35 µM | 3 |
| 540246 | Cell-based | 24h Cytotoxicity | 0.0135- 35 µM | 66 |
| 588777 | Cell-based | SR-BI Alexa 488 HDL binding assay | 0.0135- 35 µM | 66 |
| 588403 | Biochemical | Fluorescence quencher assay | 0.000195-35 µM | 31 |
| 540326 | Biochemical | Fluorescence quencher assay | 0.015-35 µM | 472 |
| 588810 | Cell-based | SR-BI Alexa 488 HDL binding assay | 28.5 fM-35 µM | 35 |
| 588830 | Cell-based | 3h Cytotoxicity assay | 0.0135- 35 µM | 66 |
| 588829 | Cell-based | 24h Cytotoxicity assay | 28.5 fM-35 µM | 17 |
| 588826 | Cell-based | 24h Cytotoxicity assay | 28.5 fM-35 µM | 37 |
| 588825 | Cell-based | [ldlA7] DiI-HDL Counterscreen | 28.5 fM-35 µM | 17 |
| 588818 | Cell-based | Cholesterol efflux, wild type | 1-25 µM | 4 |
| 602153 | Cell-based | Cholesterol efflux, wild type | 0.001- 25 µM | 5 |
| 588843 | Cell-based | Cholesterol efflux, C384S mutant | 1-25 µM | 4 |
| 602138 | Cell-based | Cholesterol efflux, C384S mutant | 0.001- 25 µM | 5 |
| 602134 | Cell-based | Transferrin Endocytosis | 28.5 fM-35 µM | 3 |
| 588836 | Cell-based | Radiolabeled HDL uptake in WT cells | 0.0001-10 µM | 4 |
| 588837 | Cell-based | Radiolabeled HDL uptake in C384S mutant cells | 0.0001-10 µM | 4 |
| 602126 | Cell-based | 24h Cytotoxicity assay | 28.5 fM-35 µM | 138 |
| 588831 | Cell-based | DiI-HDL Uptake Assay for Reversibility | 28.5 fM-35 µM | 3 |
| 602154 | Cell-based | DiI-HDL Uptake Assay for Reversibility with extended washout | 28.5 fM-35 µM | 3 |
| 602156 | Cell-based | Radiolabeled HDL uptake with SR-BI in purified liposomes | 0.1-1 µM | 4 |
NA= not applicable
Appendix B. Detailed Assay Protocols
DiI-HDL Uptake Primary Assay (2085-01)
DiI-HDL Labeling Mix
- 2200 ml of Ham's/0.5% BSA/25 mM HEPES pH 7.4
- DiI-HDL to 10 µg protein/ml final concentration (Stocks vary from 2.81-4 mg/ml)
Ham's/0.5% BSA/25 mM HEPES Assay Media (1 liter)
- 5 g BSA powder (Sigma fatty acid-free)
- 1 Liter Ham's F12 base media
- 25 ml 1 M HEPES pH 7.4
ldlA[mSR-BI] Chinese Hamster Ovary (CHO) cells were maintained in Ham's F12K (Cellgro Catalog No. 10-080-CV)/10% Fetal Calf Serum (Hyclone Catalog No. SH30071.03, Lot No. ATG32533)/ 1x Penicillin-streptomycin-L-Glutamine (Gibco Catalog No.10378-016)/200 µg/mL Geniticin (Gibco Catalog No.10131-027, Lot No.802967). Cells were fluid changed every 2 days and/or split upon reaching 80% confluency. For the primary HTS, cells were thawed at 6 million cells per Falcon T225 flask. After 2 days, the cells were passed to a Corning Hyperflask and plated after 3 days in the Hyperflask with a fluid change the day prior to plating.
On Day 0
- Plate 10,000 ldlA[mSR-BI] cells in 30 µl per well in Ham's F12K (Cellgro Catalog No. 10-080-CV)/5% Fetal Calf Serum (Hyclone Catalog No. SH30071.03, Lot No. ATG32533)/ 1x Penicillin-streptomycin-L-Glutamine (Gibco Catalog No. 10378-016) with a Thermo Combi Multi-drop fluid handler.
- Use Aurora black 384-well, square, clear-bottomed, image-quality plates (Aurora Catalog No. 1022-11330) for the assay.
On Day 1
- Remove media with aspirator (Bio-Tek ELX405 plate washer).
- Add 30 µl Ham's F12/0.5% Bovine Serum Albumin (fatty acid-free) /25 mM HEPES pH 7.4 (Invitrogen) + 10 µg protein/ml DiI-HDL with Thermo Combi fluid handler (slow speed setting).
- Pin transfer 100 nl compounds and positive control (1 µM BLT-1).
- Incubate 3 hours @ 37 °C in humidified cell culture incubator.
- Remove media with aspirator.
- Wash twice with 30 µl PBS (+Ca and Mg) using the Thermo Combi on slow speed setting.
- Analyze DiI-HDL uptake with Perkin-Elmer EnVision plate reader (Bodipy TMR mirror #405, Excitation filter is Photometric 550 (#312) and emission filter is Cy3 595 (#229) with bottom read.
Cytotoxicity Assay (2085-02)
On Day 0
- Plate 4,000 cells [ldlA]mSR-BI 30 µl/well in Ham's F-12/10% fetal bovine serum (Hyclone)/Penicillin-Streptomycin-L-Glutamine.
On Day 1
- Pin transfer 100 nl compounds and positive control (sentinel plate).
- Incubate 3 hours @ 37 °C.
- Add 20 µl Promega CellTiter-Glo per well.
- Shake plate for 15 seconds.
- Incubate 10 minutes.
- Read luminescence with Perkin-Elmer EnVision plate reader.
HDL Binding Assay (2085-03)
ldlA[mSR-BI] Chinese Hamster Ovary (CHO) cells were maintained in Ham's F12K (Cellgro Catalog No. 10-080-CV)/10% Fetal Calf Serum (Hyclone Catalog No. SH30071.03, Lot No. ATG32533)/ 1x Penicillin-streptomycin-L-Glutamine (Gibco 10378-016)/200 µg/ml Geniticin (Gibco Catalog No.10131-027, Lot No.802967). Cells were fluid changed every 2 days and/or split upon reaching 80% confluency.
On Day 0
- Plate 10,000 ldlA[mSR-BI] cells in 30 µl per well in Ham's F12K (Cellgro Catalog No. 10-080-CV)/5% Fetal Calf Serum (Hyclone Catalog No. SH30071.03, Lot No. ATG32533)/ 1x Penicillin-streptomycin-L-Glutamine (Gibco 10378-016).
- Use Aurora black, 384-well, square, clear-bottomed image-quality plates (Aurora Catalog No.1022-11330) for the assay.
On Day 1
- Remove media with aspirator (ELX405 plate washer).
- Add 30 µl Ham's F12/0.5% Bovine Serum Albumin (fatty acid-free) (Sigma Catalog No. A8806-5G) /25 mM HEPES pH 7.4 (Invitrogen) plus 10 µg/ml Alexa 488-HDL with Thermo Combi fluid handler (slow speed setting).
- Pin transfer 100 nl compounds and positive control (1 µM BLT-1).
- Incubate 3 hours @ 37 °C in a humidified cell culture incubator.
- Remove media with aspirator.
- Wash twice with 30 µl PBS (+Ca and Mg) using the Thermo Combi on slow speed setting.
- Analyze Alexa-488-HDL binding with Perkin-Elmer EnVision plate reader (FITC mirror #403) with bottom read
DiI-HDL Uptake Counter Assay (2085-07)
DiI-HDL Labeling Mix
- 2200 ml of Ham's/0.5% BSA/25 mM HEPES pH 7.4
- DiI-HDL to 10 µg/ml final concentration (Stocks vary from 2.81-4 mg/ml)
Ham's/0.5% BSA/25 mM HEPES Assay Media (1 liter)
- 5 g BSA powder (Sigma fatty acid-free)
- 1 Liter Ham's F12 base media
- 25 ml 1 M HEPES pH 7.4
[ldlA7] Chinese Hamster Ovary (CHO) cells were maintained in Ham's F12K (Cellgro Catalog No. 10-080-CV)/10% Fetal Calf Serum (Hyclone Catalog No. SH30071.03, Lot No. ATG32533)/ 1x Penicillin-streptomycin-L-Glutamine (Gibco Catalog No.10378-016). Cells were fluid changed every 2 days and/or split upon reaching 80% confluency. For the primary HTS, cells were thawed at 6 million cells per Falcon T225 flask. After 2 days, the cells were passed to a Corning Hyperflask and plated after 3 days in the Hyperflask with a fluid change the day prior to plating.
On Day 0
- Plate 10,000 [ldlA7] cells in 30 µl per well in Ham's F12K (Cellgro Catalog No. 10-080-CV)/5% Fetal Calf Serum (Hyclone Catalog No. SH30071.03, Lot No. ATG32533)/ 1x Penicillin-streptomycin-L-Glutamine (Gibco Catalog No. 10378-016).
- Use Aurora black 384-well, square, clear-bottomed, image-quality plates (Aurora Catalog No. 1022-11330) for the assay.
On Day 1
- Remove media with aspirator (ELX405 plate washer).
- Add 30 µl Ham's F12/0.5% Bovine Serum Albumin (fatty acid-free) /25 mM HEPES pH 7.4 (Invitrogen) + 10 µg protein/ml DiI-HDL with Thermo Combi fluid handler (slow speed setting).
- Pin transfer 100 nl compounds and positive control (1 µM BLT-1).
- Incubate 3 hours @ 37 °C in humidified cell culture incubator.
- Remove media with aspirator.
- Wash twice with 30 µl PBS (+Ca and Mg) using the Thermo Combi on slow speed setting.
- Analyze DiI-HDL uptake with Perkin-Elmer EnVision plate reader (Bodipy TMR mirror #405, Excitation filter is Photometric 550 (#312) and emission filter is Cy3 595 (#229) with bottom read.
Cholesterol Efflux Assay (wild type [2085-06]) and C384S Mutant SR-BI (2085-10)
On Day 0
- Seed cells onto 24-well tissue culture plates at a density of 50,000 cells per well in 1 ml Ham's F-12/10% fetal bovine serum (Hyclone)/Penicillin-Streptomycin-L-Glutamine medium with G418/Geniticin at 250 µg/ml.
On Day 1
- Replace the medium with Ham's F12 medium supplemented with 10% bovine lipoprotein deficient serum, 1 µCi/ml [1,2-3H]cholesterol (40–60 Ci/mmol; Product number: NET139001MC Perkin Elmer - NEN Life Science), 2 mM L-glutamine, 50 U/ml penicillin, 50 mg/ml streptomycin, and, for ldlA[mSR-BI] cells only, 0.25 mg/ml G418.
On Day 3
- Washthe cells twice in 1 ml Ham's F12 medium without any supplements.
- Culture for another 24 h in 1 ml tissue culture medium in which fetal bovine serum was replaced with 1% fatty acid-free (FAF) BSA (Sigma Catalog No. A6003).
On Day 4
- Wash cells twice with Ham's F12 without supplements.
- Pre-incubate for 1 h at 37 degrees Celsius with compounds at several concentrations in 1 ml assay medium (Ham's F12 + P/S + Gln + 0.5% DMSO + 25 mM HEPES, pH 7.4+ 0.5% FAF BSA).
- Incubatethe cells for an additional 2 hours with the same concentrations of small molecules and with the indicated concentrations unlabeled HDL → 55 µl of assay medium containing 2 mg/ml HDL added to each well (final HDL concentration of 100 µg/ml).
- After 2hours of incubation at 37 °C, determine the [3H]cholesterol contents of the cells and the media as follows.
- Collect 120 ul efflux media and clarify by centrifugation for 1 min with a desktop microcentrifuge,
- Determine the radioactivity in 100 µl of each supernatant by liquid scintillation counting (LSC).
- Solubilize cells with 400 µl of lysis buffer (1% Triton X-100 in PBS) for 30 min at room temperature,
- Determine the amount of [3H]cholesterol in 100 µl of each lysate by LSC.
- Calculate the total cellular [3H]cholesterol as the sum of the radioactivity in the efflux medium plus the radioactivity in the cells. Use total cellular [3H]cholesterol to calculate the [3H]cholesterol efflux (percent of total [3H]cholesterol released into the medium).
DiI-HDL Uptake Reversibility Assay (2085-14)
DiI-HDL Labeling Mix
- 2200 ml of Ham's/0.5% BSA/25 mM HEPES
- DiI-HDL to 10 µg protein/ml final concentration (Stocks vary from 2.81-4 mg/ml)
Ham's/0.5% BSA/25 mM HEPES Assay Media (1 liter)
- 5 g BSA powder (Sigma fatty acid-free)
- 1 Liter Ham's F12 base media
- 25 ml 1 M HEPES pH 7.4
[ldlA7][mSR-BI] Chinese Hamster Ovary (CHO) cells were maintained in Ham's F12K (Cellgro Catalog No. 10-080-CV)/10% Fetal Calf Serum (Hyclone Catalog No. SH30071.03, Lot No. ATG32533)/ 1x Penicillin-streptomycin-L-Glutamine (Gibco Catalog No.10378-016)/ Geniticin 200 µg/ml. Cells were fluid changed every 2 days and/or split upon reaching 80% confluency.
On Day 0
- Plate 10,000 [ldlA]mSR-BI cells in 30 µl per well in Ham's F12K (Cellgro Catalog No. 10-080-CV)/5% Fetal Calf Serum (Hyclone Catalog No. SH30071.03, Lot No. ATG32533)/ 1x Penicillin-streptomycin-L-Glutamine (Gibco Catalog No. 10378-016).
- Use Aurora black 384-well, square, clear-bottomed, image-quality plates (Aurora Catalog No. 1022-11330) for the assay.
On Day 1
- Remove media with aspirator (ELX405 plate washer).
- Add 30 µl Ham's F12/0.5% Bovine Serum Albumin (fatty acid-free) /25 mM HEPES pH 7.4 (Invitrogen) with Thermo Combi fluid handler (slow speed setting).
- Pin transfer 100 nl compounds and positive control (1 µM BLT-1).
- Incubate 2 hours @ 37 °C in humidified cell culture incubator.
- Remove media with aspirator.
- Wash four times with 30 µl PBS (+Ca and Mg) using the Thermo Combi on slow speed setting.
- Add 30 µl Ham's F12/0.5% Bovine Serum Albumin (fatty acid-free) /25 mM HEPES pH 7.4 (Invitrogen) + 10 µg protein/ml DiI-HDL with Thermo Combi fluid handler (slow speed setting).
- Analyze DiI-HDL uptake with Perkin-Elmer EnVision plate reader (Bodipy TMR mirror #405, Excitation filter is Photometric 550 (#312) and emission filter is Cy3 595 (#229) with bottom read.
DiI-HDL Uptake Extended Reversibility Assay (2085-15)
DiI-HDL Labeling Mix
- 2200 ml of Ham's/0.5% BSA/25 mM HEPES
- DiI-HDL to 10 µg protein/ml final concentration (Stocks vary from 2.81-4 mg/ml)
Ham's/0.5% BSA/25 mM HEPES Assay Media (1 liter)
- 5 g BSA powder (Sigma fatty acid-free)
- 1 Liter Ham's F12 base media
- 25 ml 1 M HEPES
[ldlA7]]mSR-BI Chinese Hamster Ovary (CHO) cells were maintained in Ham's F12K (Cellgro Catalog No. 10-080-CV)/10% Fetal Calf Serum (Hyclone Catalog No. SH30071.03, Lot No. ATG32533)/ 1x Penicillin-streptomycin-L-Glutamine (Gibco Catalog No.10378-016)/200 µg/ml. Cells were fluid changed every 2 days and/or split upon reaching 80% confluency.
On Day 0
- Plate 10,000 [ldlA7] cells in 30 µl per well in Ham's F12K (Cellgro Catalog No. 10-080-CV)/5% Fetal Calf Serum (Hyclone Catalog No. SH30071.03, Lot No. ATG32533)/ 1x Penicillin-streptomycin-L-Glutamine (Gibco Catalog No. 10378-016).
- Use Aurora black 384-well, square, clear-bottomed, image-quality plates (Aurora Catalog No. 1022-11330) for the assay.
On Day 1
- Remove media with aspirator (ELX405 plate washer).
- Add 30 µl Ham's F12/0.5% Bovine Serum Albumin (fatty acid-free) /25 mM HEPES pH 7.4 (Invitrogen) with Thermo Combi fluid handler (slow speed setting).
- Pin transfer 100 nl compounds and positive control (1 µM BLT-1).
- Incubate 2 hours @ 37 °C in humidified cell culture incubator.
- Remove media with aspirator.
- Wash four times with 30 µl PBS (+Ca and Mg) using the Thermo Combi on slow speed setting.
- Add 30 µl Ham's F12/0.5% Bovine Serum Albumin (fatty acid-free) /25 mM HEPES pH 7.4 (Invitrogen) + 10 µg protein/ml DiI-HDL with Thermo Combi fluid handler (slow speed setting).
- Analyze DiI-HDL uptake with Perkin-Elmer EnVision plate reader (Bodipy TMR mirror #405, Excitation filter is Photometric 550 (#312) and emission filter is Cy3 595 (#229) with bottom read.
Transferrin Endocytosis Assay (2085-04)
On Day 0
- Plate 5,000 ldlA[mSR-BI] cells in 30 µl per well of a 384 well plate in DMEM/5% FCS/Pen-Strep.
On Day 1
- Wash 2x with 30 µl DMEM/1% BSA/(no phenol red).
- Dispense 30 µl per well of DMEM/1%BSA/no phenol red.
- Add compounds, incubate 60 min @ 37 °C.
- Dissolve 5 mg Transferrin-Alexa 594 (Invitrogen T-13343) in 1 ml water.
- Dilute 5 mg/ml stock 1:10 to become 5 µg/µl stock, add 1.8 µl per well for 30 µl volume (need approx. 750 µL per 384-well plate).
- Incubate for 30 min @ 37 °C.
- Place plate on ice to stop reaction.
- Wash wells with 45 µl ice cold PBS/1 mM MgCl2/0.1 mM CaCl2.
- Fix for 45 min on ice with ice cold 4% PFA in PBS/1 mM MgCl2/0.1mM CaCl2 in the presence of DAPI (1:1000 from a 10 mg/ml stock; Invitrogen No.H3570).
- Analyze with high content imaging.
Liposome Uptake Assay (2085-16)
Liposome prep
Set up:
- 10 mg phosphatidyl Choline (PC) (purchased at 10mg/ml, so add 1 ml)
- 1 mg choline (C) (dissolve in 10 µl CH3Cl chloroform to make it 10 mg/ml)
- Add into a glass scintillation vial.
- Dry with liquid N2 and rotate the vial to dry the lipids.
- Reconstitute in 5 ml 50 mM Tris pH 6.0 buffer:
- Add 2 ml first, vortex, and shake on a platform for 5 min, transfer to a new vial.
- Add another 2 ml to the original vial and repeat the same step.
- Add 1 ml to clean the vial and transfer all lipids into the new vial.
Liposome can be stored at 4 ºC for 1 week, or 7-12 days.
Proteoliposome prep
Make fresh proteoliposome prep for each experiment, and also make one without SR-BI.
SR-BI protein sample
- Thaw and put on ice.
- Spin 15 min @ 14,000 RPM in cold room.
- Take the supernatant.
Label Oak Ridge centrifuge tubes and place on ice.
For each tube
- Add 2.4 ml buffer (50 mM Tris-Cl, pH 6.0, 150 mM NaCl, 2 mM CaCl2).
- Add 20 µg SR-BI or buffer. Vortex.
- Add PC-C liposome: 0.5 mL. Vortex.
- Add acetone (0.6x volume, ice cold). Vortex.
- Centrifuge (ultracentrifuge, red rotor, Ti 70.1) @ 16,000 RPM, 30 min, 4 ºC.
- Aspirate supernatant, dry upside down for 5 min.
- Add 375 µl cold Ham's F12 + 25 mM HEPES. Vortex.
- Sit on ice for 5 min.
- Add another 750 µl of Ham's F12 + 25 mM HEPES.
- Transfer into microcentrifuge tubes.
- 1125 µl per tube(30 µl proteoliposome is used per sample, so each prep is OK for maximum of 37 samples).
Uptake/binding Assay
Final assay condition in Ham's F12 + 25 mM HEPES + 0.5% DMSO + 0.5% FAFA
In 96-well plate,
- Add:
- -
30 µl liposome in F12 + 25 mM HEPES.
- -
30 µl BLT-1 or other compounds or cold HDL in Ham's F12 + 25 mM HEPES + 1% DMSO + 1% FAFA (prepared 2.67X concentrated).
- -
20 μl ‘radiolabeled HDL in Ham's F12 + 25 mM HEPES + 0.5% DMSO + 0.5% FAFA (prepared 4X concentrated).
- Mix by pipetting up and down 2-3 times.
- After 1 hour incubation at 37 ºC, add radiolabeled HDL for 4 hours.
- To stop the reaction, put the plate on ice for 10 min – keep the plate on ice through filter assay.
- Proceed to Filtration.
Filter Assay
- Prewash/block filters for > 60 min @ RT in wash buffer (20 mM Tris-Cl pH 8.0, 50 mM NaCl, 20 µM CaCl2, 1 mg/mL BSA).
- Mount membrane in filtration bucket.
- Add 200 µl washing buffer to the plates: 12 samples at a time.Apply samples (∼ 300 µl) to filter while vacuum is ON.
- Add/wash wells with another 200 µl washing buffer.Apply samples to filter while vacuum is ON.
- Vacuum OFF, add 6 ml wash buffer to filter → vacuum ON to suck.
- Dry filters as much as possible, and remove the filter.
- For 3H, add 4 ml scintillation liquid and wait until the filters are dissolved and count. For 125I: make sure membrane is crammed within tip of tube.
Data Analysis
For the primary screen and other assays, negative-control (NC) wells and positive-control (PC) wells were included on every plate. The raw signals of the plate wells were normalized using the ‘Stimulators Minus Neutral Controls’ method in Genedata Assay Analyzer (v7.0.3). The median raw signal of the intra-plate NC wells was set to a normalized activity value of 0, while the median raw signal of the intra-plate PC wells was set to a normalized activity value of 100. Experimental wells were scaled to this range, resulting in an activity score representing the percent change in signal relative to the intra-plate controls. The mean of the replicate percent activities were presented as the final ‘Pubchem Activity Score’.
The ‘Pubchem Activity Outcome’ class was assigned as described below, based on an activity threshold of 70%:
- Activity_Outcome = 1 (inactive), less than half of the replicates fell outside the threshold.
- Activity_Outcome = 2 (active), all of the replicates fell outside the threshold, OR at least half of the replicates fell outside the threshold AND the ‘Pubchem Activity Score’ fell outside the threshold.
- Activity_Outcome = 3 (inconclusive), at least half of the replicates fell outside the threshold AND the ‘Pubchem Activity Score did not fall outside the threshold.
Appendix C. Experimental Procedures for the Synthesis of the Probe(s)
General Details. All reagents and solvents were purchased from commercial vendors and used as received. NMR spectra were recorded on a Bruker 300 MHz or Varian UNITY INOVA 500 MHz spectrometer as indicated. Proton and carbon chemical shifts are reported in parts per million (ppm;δ) relative to tetramethylsilane, CDCl3 solvent, or d6-DMSO (1H δ 0, 13C δ 77.16, or 13C δ 39.5, respectively). NMR data are reported as follows: chemical shifts, multiplicity (obs. = obscured, app = apparent, br = broad, s = singlet, d = doublet, t = triplet, m = multiplet, comp = complex overlapping signals); coupling constant(s) in Hz; integration. Unless otherwise indicated, NMR data were collected at 25 °C. Flash chromatography was performed using 40-60 µm Silica Gel (60 Å mesh) on a Teledyne Isco Combiflash Rf system. Tandem liquid chromatography/mass spectrometry (LCMS) was performed on a Waters 2795 separations module and Waters 3100 mass detector. Analytical thin layer chromatography (TLC) was performed on EM Reagent 0.25 mm silica gel 60-F plates. Visualization was accomplished with UV light and aqueous potassium permanganate (KMnO4) stain followed by heating. High-resolution mass spectra were obtained at the MIT Mass Spectrometry Facility with a Bruker Daltonics APEXIV 4.7 Tesla Fourier Transform Ion Cyclotron Resonance mass spectrometer. Compound purity and identity were determined by UPLC-MS (Waters, Milford, MA). Purity was measured by UV absorbance at 210 nm. Identity was determined on a SQ mass spectrometer by positive electrospray ionization. Mobile Phase A consisted of either 0.1% ammonium hydroxide or 0.1% trifluoroacetic acid in water, while mobile Phase B consisted of the same additives in acetonitrile. The gradient ran from 5% to 95% mobile Phase B over 0.8 minutes at 0.45 ml/min. An Acquity BEH C18, 1.7 µm, 1.0 × 50 mm column was used with column temperature maintained at 65 °C. Compounds were dissolved in DMSO at a nominal concentration of 1 mg/ml, and 0.25 µl of this solution was injected.

1-(Phenylsulfonyl)indoline: Indoline (1.4 ml, 12.6 mmol) was placed in a round-bottom flask equipped with a magnetic stirbar and dissolved in dichloromethane (42.0 ml). After cooling to 0 °C, triethylamine (3.5 ml, 25.2 mmol) was added to the solution, followed by benzenesulfonyl chloride (1.7 ml, 13.3 mmol). The reaction was stirred for 30 minutes while warming to room temperature. Saturated sodium bicarbonate solution (aqueous, 30 ml) was added to quench the reaction. The layers were separated, and the aqueous layer was extracted with dichloromethane (3 × 25 ml). The combined organics were washed with brine (25 ml), then shaken over magnesium sulfate, filtered, and concentrated under reduced pressure to give a light tan solid. The crude material was purified by column chromatography over silica gel (hexanes/ethyl acetate: 100/0 to 80/20) to give the title compound as a light pink solid (3.00 g, 92 %). 1H NMR (300 MHz, CDCl3): δ 7.82 – 7.77 (m, 2H), 7.66 (d, J = 8.0 Hz, 1H), 7.55 (t, J = 7.4 Hz, 1H), 7.44 (t, J = 7.9 Hz, 2H), 7.20 (t, J = 7.8 Hz, 1H), 7.08 (d, J = 7.4 Hz, 1H), 6.98 (t, J = 7.4 Hz, 1H), 3.93 (t, J = 8.4 Hz, 2H), 2.89 (t, J = 8.4 Hz, 2H); MS (ESI+): 260 (M+H).

2-Chloro-1-(1-(phenylsulfonyl)indolin-5-yl)ethanone: A round-bottom flask was charged with a magnetic stirbar and anhydrous aluminum chloride (1.70 g, 12.7 mmol) then placed under nitrogen atmosphere. Anhydrous 1,2-dichloroethane (28 ml) was added to produce a pale yellow suspension. Chloroacetyl chloride (1.0 ml, 12.7 mmol) was added slowly by syringe. The mixture was stirred at room temperature for 30 minutes. A solution of 1-(phenylsulfonyl)indoline (3.00 g, 11.6 mmol) in anhydrous 1,2-dichloroethane (8.0 ml) was slowly added to the reaction by syringe. The syringe was rinsed twice with anhydrous 1,2-dichloroethane (3.0 ml), and the rinses were added to the reaction. The reaction, now a dark green mixture, was heated to 50 °C and stirred for 4 hours. Additional portions of aluminum chloride (1.30 g, 9.7 mmol) and chloroacetyl chloride (0.75 ml, 9.5 mmol) were dissolved in anhydrous 1,2-dichloroethane (10 ml) and added to the reaction. After stirring 2 more hours at 50 °C, 5 ml of anhydrous 1,2-dichloroethane containing another 0.8 g (6.0 mmol) of aluminum chloride and 0.5 ml (6.4 mmol) of chloroacetyl chloride was added. Stirring at 50 °C was continued for another hour to complete the reaction. The dark red mixture was slowly poured into ice water (approx.250 ml) and further diluted with dichloromethane (200 ml). The resulting cloudy, orange mixture was stirred while warming to room temperature, after which the layers were separated and the aqueous phase was extracted with dichloromethane (3 × 100 ml). The combined organic layers were washed with water (100 ml) and brine (100 ml), then shaken over magnesium sulfate, filtered, and concentrated under reduced pressure to give a brown solid (3.91 g). The crude material was purified by column chromatography over silica gel (hexanes/ethyl acetate: 100/0 to 0/100) to give the title compound as a tan solid (3.41 g, 88 %). 1H NMR (300 MHz, CDCl3): δ 7.87 – 7.81 (m, 3H), 7.75 – 7.69 (m, 2H), 7.65 – 7.57 (m, 1H), 7.54 – 7.47 (m, 2H), 4.63 (s, 2H), 4.01 (t, J = 8.6 Hz, 2H), 3.05 (t, J = 8.6 Hz, 2H); MS (ESI+): 336 (M+H).
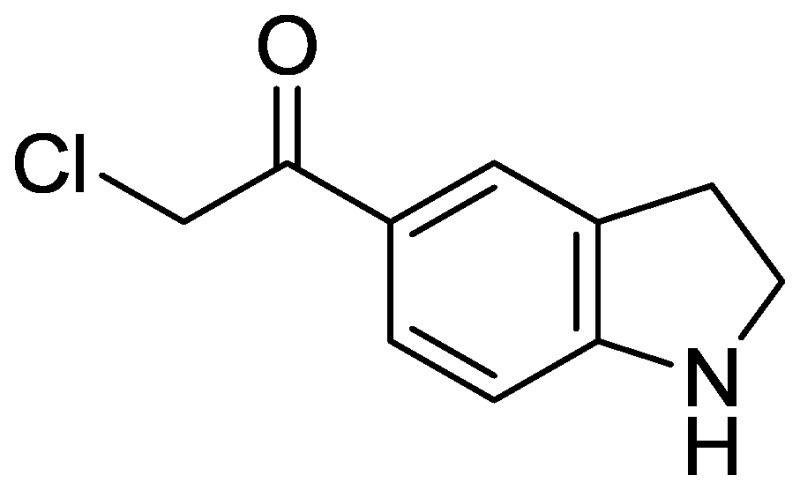
2-Chloro-1-(indolin-5-yl)ethanone: A microwave tube was charged with a magnetic stirbar and 2-chloro-1-(1-(phenylsulfonyl)indolin-5-yl)ethanone (3.26 g, 9.54 mmol). Concentrated sulfuric acid (9.0 ml) was added, and the resulting suspension was microwaved for 10 minutes at 100 °C. The reaction was carefully poured into ice water (500 ml). The dark mixture was stirred while warming to room temperature then treated with 10% (w/v) aqueous sodium hydroxide (approximately 200 ml) until the pH >10. This mixture was then extracted with dichloromethane (3 × 250 ml). The combined extracts were washed with brine (200 ml), then shaken over magnesium sulfate, filtered, and concentrated under reduced pressure to give a brown solid (1.52 g). This material was used immediately without further purification. 1H NMR (300 MHz, CDCl3): δ 7.72 (d, J = 1.2 Hz, 1H), 7.69 (dd, J = 8.3, 1.6 Hz, 1H), 6.54 (d, J = 8.2 Hz, 1H), 4.60 (s, 2H), 3.70 (t, J = 8.6 Hz, 2H), 3.09 (t, J = 8.6 Hz, 2H); MS (ESI+): 196 (M+H).

tert-Butyl 5-(2-aminothiazol-4-yl)indoline-1-carboxylate: 2-Chloro-1-(indolin-5-yl)ethanone (1.52 g, 7.75 mmol) was placed in a microwave vial and dissolved in anhydrous ethanol (30.0 mL) to give an opaque, black solution. Thiourea (0.66 g, 8.67 mmol) was added and the resulting mixture was microwaved for 30 minutes at 120 °C. 4-(N,N-Dimethylamino)pyridine (95.0 mg, 0.78 mmol) and N,N-diisopropylethylamine (1.5 ml, 9.3 mmol) were added to the reaction mixture. Neat di-tert-butyl dicarbonate (2.0 mL, 8.52 mmol) was added last, and the reaction was stirred at room temperature for 1 hour. The opaque, red-brown mixture was concentrated under reduced pressure to give a red-brown solid. This material was partitioned between water (50 ml) and ethyl acetate (75 ml) and stirred at room temperature until everything dissolved. The layers were separated and the aqueous phase was extracted with ethyl acetate (3 × 50 ml). The combined organic extracts were shaken over magnesium sulfate, filtered, and concentrated under reduced pressure to give an orange-brown solid. The crude material was purified by column chromatography over silica gel (hexanes/ethyl acetate: 100/0 to 40/60) to give the title compound as an orange solid (1.72 g, 56 % over three steps). 1H NMR (300 MHz, d6-DMSO): δ 7.61 (s, 1H), 7.60 (d, J = 8.1 Hz, 1H), 6.99 (s, 1H), 6.85 (s, 1H), 3.92 (t, J = 8.7 Hz, 2H), 3.07 (t, J = 8.7 Hz, 2H), 1.51 (s, 9H); MS (ESI+): 318 (M+H).

tert-Butyl 5-(2-(3,5-dimethoxybenzamido)thiazol-4-yl)indoline-1-carboxylate: In a round-bottom flask equipped with a magnetic stirbar, tert-butyl 5-(2-aminothiazol-4-yl)indoline-1-carboxylate (0.500 g, 1.58 mmol) was combined with 4-(N,N-dimethylamino)pyridine (19.0 mg, 0.16 mmol). Dichloromethane (4.0 ml) was added to produce an orange suspension that was cooled to 0 °C. N,N-Diisopropylethylamine (0.33 ml, 1.89 mmol) was added followed by a solution of 3,5-dimethoxybenzoyl chloride (0.35 g, 1.73 mmol) in dichloromethane (1.00 ml). The bright orange mixture was stirred for 1 hour while warming to room temperature. The resulting clear, red-brown solution was diluted with saturated sodium bicarbonate solution (aqueous, 10 ml) and dichloromethane (10 ml). The layers were separated, and the aqueous phase was extracted with dichloromethane (3 × 10 ml). The combined organics were washed with brine (10 ml) then shaken over magnesium sulfate, filtered, and concentrated under reduced pressure to give a thick, orange-brown oil. This material was purified by column chromatography over silica gel (hexanes/ethyl acetate: 100/0 to 70/30) to give the title compounds as a light yellow solid (0.51 g, 67%). 1H NMR (300 MHz, CDCl3): δ 9.84 (s, 1H), 7.60 (d, J = 12.2 Hz, 1H), 7.58 (s, 1H), 7.07 (s, 1H), 7.04 (s, 1H), 7.03 (s, 1H), 6.64 (t, J = 2.2 Hz, 1H), 4.01 (t, J = 8.7 Hz, 2H), 3.84 (s, 6H), 3.12 (t, J = 8.7 Hz, 2H), 1.58 (s, 9H); MS (ESI+): 482 (M+H).

N-(4-(Indolin-5-yl)thiazol-2-yl)-3,5-dimethoxybenzamide, trifluoroacetic acid salt: tert-Butyl 5-(2-(3,5-dimethoxybenzamido)thiazol-4-yl)indoline-1-carboxylate (0.38 g, 0.79 mmol) was placed in a round-bottom flask with a magnetic stirbar and dissolved in dichloromethane (5.3 mL) to give a clear, yellow solution. Triethylsilane (1.3 mL, 7.93 mmol) was added followed by 2,2,2-trifluoroacetic acid (1.2 mL, 15.9 mmol), and the reaction quickly turned light orange and produced a gas. The reaction was stirred at room temperature for 1 hour. The light pink reaction was concentrated under reduced pressure to give a rose-colored solid. The crude material was suspended in diethyl ether (10 ml) and filtered. The collected solids were washed with additional diethyl ether and air dried on the filter to give the title compound as light purple solid (0.36 g, 93 %). 1H NMR (300 MHz, CD3OD): δ 8.05 (s, 1H), 7.99 (d, J = 10.0 Hz, 1H), 7.51 (s, 1H), 7.39 (d, J = 8.3 Hz, 1H), 7.20 (s, 1H), 7.20 (s, 1H), 6.74 (s, 1H), 3.87 (s, 6H), 3.85 (t, J = 7.8 Hz, 2H), 3.35 (t, J = 7.7 Hz, 2H); MS (ESI+): 382 (M+H).

3,5-Dimethoxy-N-(4-(1-(2-methoxyacetyl)indolin-5-yl)thiazol-2-yl)benzamide (PROBE): A round-bottom flask equipped with a magnetic stirbar was charged with 5-(2-(3,5-dimethoxybenzamido)thiazol-4-yl)indolinium 2,2,2-trifluoroacetate (75.0 mg, 0.15 mmol). Dichloromethane (1.5 ml) was added to produce a purple suspension that was cooled to 0 °C. 4-(N,N-Dimethylamino)pyridine (1.8 mg, 0.015 mmol) was added, followed by N,N-diisopropylethylamine (79 µl, 0.45 mmol) to give a clear, dark solution. 2-Methoxyacetyl chloride (15 µl, 0.17 mmol) was added last. The reaction was warmed to room temperature and stirred for 1 hour. The cloudy, tan mixture was diluted with dichloromethane (2 ml) and quenched with saturated sodium bicarbonate (aqueous, 2 ml). The layers were separated, and the aqueous portion was extracted with additional hot ethyl acetate (5 × 3 ml). The combined organic layers were shaken over magnesium sulfate, filtered, and concentrated under reduced pressure to give a light tan solid. The crude material was purified by column chromatography over silica gel (dichloromethane/methanol: 100/0 to 97/3) to give the title compound as an off-white solid (54.3 mg, 79 %).1H NMR (500 MHz, CDCl3): δ 10.14 (s, 1H), 8.23 (d, J = 8.3 Hz, 1H), 7.63 (d, J = 8.4 Hz, 1H), 7.60 (s, 1H), 7.11 (s, 1H), 7.01 (d, J = 1.9 Hz, 3H), 6.61 (t, J = 2.0 Hz, 1H), 4.18 (s, 2H), 4.07 (t, J = 8.3 Hz, 2H), 3.81 (s, 8H), 3.53 (s, 4H), 3.22 (t, J = 8.2 Hz, 2H). 13C NMR (126 MHz, CDCl3): δ 167.2, 164.6, 161.1, 158.2, 150.0, 142.7, 133.9, 131.4, 130.3, 125.7, 122.2, 117.1, 107.3, 105.2, 105.0, 72.3, 59.4, 55.6, 46.8, 28.2. HRMS (ESI+): calculated for C23H24N3O5S [M+H] 454.1437, found 454.1420.
Appendix D. Experimental Procedure for Additional Analytical Assays
Solubility. Solubility was determined in phosphate buffered saline (PBS) pH 7.4 with 1% DMSO. Each compound was prepared in duplicate at 100 µM in both 100% DMSO and PBS with 1% DMSO. Compounds were allowed to equilibrate at room temperature with a 250 rpm orbital shake for 24 hours. After equilibration, samples were analyzed by UPLC-MS (Waters, Milford, MA) with compounds detected by SIR detection on a single quadrupole mass spectrometer. The DMSO samples were used to create a two-point calibration curve to which the response in PBS was fit.
PBS Stability. Stability was determined in the presence of PBS pH 7.4 with 0.1% DMSO. Each compound was prepared in duplicate on six separate plates and allowed to equilibrate at room temperature with a 250-rpm orbital shake for 48 hours. One plate was removed at each time point (0, 2, 4, 8, 24, and 48 hours). An aliquot was removed from each well and analyzed by UPLC-MS (Waters, Milford, MA) with compounds detected by SIR detection on a single quadrupole mass spectrometer. Additionally, to the remaining material at each time point, acetonitrile was added to force dissolution of compound (to test for recovery of compound). An aliquot of this was also analyzed by UPLC-MS.
GSH Stability. Stability was determined in the presence of PBS pH 7.4 µM and 50 µM glutathione with 0.1% DMSO. Each compound was prepared in duplicate on six separate plates and allowed to equilibrate at room temperature with a 250-rpm orbital shake for 48 hours. One plate was removed at each time point (0, 2, 4, 8, 24, and 48 hours). An aliquot was removed from each well and analyzed by UPLC-MS (Waters, Milford, MA) with compounds detected by SIR detection on a single quadrupole mass spectrometer. Additionally, to the remaining material at each time point, acetonitrile was added to force dissolution of compound (to test for recovery of compound). An aliquot of this was also analyzed by UPLC-MS.
Plasma Protein Binding. Plasma protein binding was determined by equilibrium dialysis using the Rapid Equilibrium Dialysis (RED) device (Pierce Biotechnology, Rockford, IL) for both human and mouse plasma. Each compound was prepared in duplicate at 5 µM in plasma (0.95% acetonitrile, 0.05% DMSO) and added to one side of the membrane (200 µl) with PBS pH 7.4 added to the other side (350 µl). Compounds were incubated at 37 ºC for 5 hours with a 250-rpm orbital shake. After incubation, samples were analyzed by UPLC-MS (Waters, Milford, MA) with compounds detected by SIR detection on a single quadrupole mass spectrometer.
Plasma Stability. Plasma stability was determined at 37 ºC at 5 hours in both human and mouse plasma. Each compound was prepared in duplicate at 5 µM in plasma diluted 50/50 (v/v) with PBS pH 7.4 (0.95% acetonitrile, 0.05% DMSO). Compounds were incubated at 37 ºC for 5 hours with a 250-rpm orbital shake with time points taken at 0 hours and 5 hours. Samples were analyzed by UPLC-MS (Waters, Milford, MA) with compounds detected by SIR detection on a single quadrupole mass spectrometer.
Appendix E. Chemical Characterization Data for Probe 1
%20of%20Probe%201%20(ML278).&p=BOOKS&id=133420_ml278f20.jpg "Click on image to zoom")
1H NMR Spectrum (300 MHz, CDCl3) of Probe 1 (ML278)
%20of%20Probe%201%20(ML278).&p=BOOKS&id=133420_ml278f21.jpg "Click on image to zoom")
13C NMR Spectrum (125 MHz, CDCl3) of Probe 1 (ML278)
.&p=BOOKS&id=133420_ml278f22.jpg "Click on image to zoom")
UPLC-MS Chromatogram of Probe 1 FW = 453.51 (ML278)
Appendix F. Prior Art Search
Table A2Search Strings and Databases Employed in the Prior Art Search
| Search String | Database | Hits Found |
|---|---|---|
| SR-BI inhibitor | SciFinder | 6 |
| SR-BI inhibitor (topic) | Web of Science | 184 |
| SR-BI inhibitor (all fields) | PubMed | 342 |
| SR-BI inhibitor (full text) | Patent Lens | 36 (>50% score) |
Appendix G. Compounds Provided to Evotec
Table A3Probe and Analog Information
| BRD | SID | CID | P/A | MLSID | ML |
|---|---|---|---|---|---|
| BRD-K83634925-001 | 126700837 | 53377439 | P | MLS003875060 | ML278 |
| BRD-K55587176-019 | 126922007 | 53377450 | A | MLS003875069 | NA |
| BRD-A49856563-001 | 126922001 | 53347982 | A | MLS003875063 | NA |
| BRD-K62979870-001 | 126922008 | 53393834 | A | MLS003875064 | NA |
| BRD-K07787731-001 | 126922005 | 53393838 | A | MLS003875062 | NA |
| BRD-K47808164-001 | 126922006 | 53393841 | A | MLS003875065 | NA |
A = analog; NA= not applicable; P = probe
Appendix H. Additional Analogs
Table A4SAR Analysis of Additional Analogs
| Entry No. | CID | * | Structure | Potency (µM) | Fold Selectivity | ||||
|---|---|---|---|---|---|---|---|---|---|
| SID | SR-BI-mediated lipid uptake | 24-hour Cytotoxicity | |||||||
| Broad ID | n | IC50 | n | IC50 | |||||
| 1 | 53347996 | S |
 | 2 | 0.97 | 2 | >35 | >36 | |
| 125082022 | |||||||||
| K69876511-001 | |||||||||
| 2 | 53262915 | S |
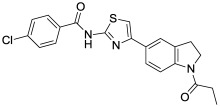 | 2 | 0.77 | 2 | >35 | >46 | |
| 124404424 | |||||||||
| K63473206-001 | |||||||||
| 3 | 53347991 | S |
 | 2 | 0.22 | 2 | NT | ||
| 125081999 | |||||||||
| K48446066-001 | |||||||||
| 4 | 53347984 | S |
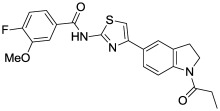 | 6 | 0.027 | 2 | >35 | >1,296 | |
| 125082043 | |||||||||
| K20254972-001 | |||||||||
| 5 | 1458944 | S |
 | 2 | 0.003 | 2 | >35 | >11,667 | |
| 125299410 | |||||||||
| K14625494-001 | |||||||||
| 6 | 53347997 | S |
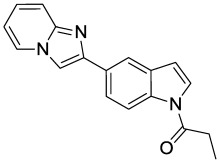 | 2 | 9.5 | 2 | 16 | 1.7 | |
| 125082018 | |||||||||
| K96691852-001 | |||||||||
| 7 | 53262911 | S |
 | 2 | 16.5 | 1 | NT | ||
| 124404420 | |||||||||
| K69616769-001 | |||||||||
| 8 | 53347993 | S |
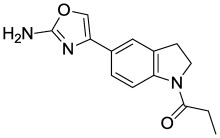 | 2 | 20 | 2 | >35 | 1.75 | |
| 125082044 | |||||||||
| K40579149-001 | |||||||||
| 9 | 53347972 | S |
 | 2 | 1.7 | 2 | >35 | >21 | |
| 125082033 | |||||||||
| K44839491-001 | |||||||||
| 10 | 896768 | S |
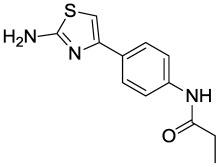 | 2 | 8.8 | 2 | >35 | >4 | |
| 125299399 | |||||||||
| K91899274-003 | |||||||||
| 11 | 53347962 | S |
 | 6 | 0.033 | 2 | >35 | >1060 | |
| 125082034 | |||||||||
| K07456992-001 | |||||||||
| 12 | 53347944 | S |
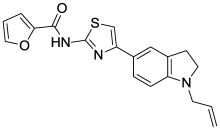 | 2 | 4.1 | >35 | >8.5 | ||
| 125082021 | |||||||||
| K50896000-001 | |||||||||
| 13 | 53262917 | S |
 | 2 | 0.44 | NT | |||
| 124404422 | |||||||||
| K99478179-001 | |||||||||
| 14 | 44754606 | S |
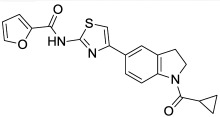 | 2 | 0.19 | 2 | >35 | >184 | |
| 125082030 | |||||||||
| K63080565-001 | |||||||||
| 15 | 53347960 | S |
 | 2 | 6.8 | 2 | >35 | >5 | |
| 125082029 | |||||||||
| K43566795-001 | |||||||||
NT=not tested
NT=not tested; S= synthesized
Appendix I. Chemical Characterization Data for All Analogs
%20of%20Analog%20CID%2024761960%20(EtOAc%20trapped%20in%20solid%20matrix%20could%20not%20be%20completely%20removed).&p=BOOKS&id=133420_ml278f23.jpg "Click on image to zoom")
1H NMR Spectrum (300 MHz, CDCl3) of Analog CID 24761960
(EtOAc trapped in solid matrix could not be completely removed)

UPLC-MS Chromatogram of Analog CID 24761960
FW = 367.42
%20of%20Analog%20CID%2053262914%20(Solubility%20was%20too%20low%20to%20obtain%20a%20reasonable%20spectrum).&p=BOOKS&id=133420_ml278f25.jpg "Click on image to zoom")
1H NMR Spectrum (300 MHz, DMSO-d6) of Analog CID 53262914
(Solubility was too low to obtain a reasonable spectrum)

UPLC-MS Chromatogram of Analog CID 53262914
FW = 367.42
%20of%20Analog%20CID%2053347982.&p=BOOKS&id=133420_ml278f27.jpg "Click on image to zoom")
1H NMR Spectrum (300 MHz, CDCl3) of Analog CID 53347982

UPLC-MS Chromatogram of Analog CID 53347982
FW = 371.45
%20of%20Analog%20CID%2053348009.&p=BOOKS&id=133420_ml278f29.jpg "Click on image to zoom")
1H NMR Spectrum (300 MHz, DMSO-d6) of Analog CID 53348009

UPLC-MS Chromatogram of Analog CID 53348009
FW = 383.49
%20of%20Analog%20CID%2053262916.&p=BOOKS&id=133420_ml278f31.jpg "Click on image to zoom")
1H NMR Spectrum (300 MHz, DMSO-d6) of Analog CID 53262916

UPLC-MS Chromatogram of Analog CID 53262916 FW = 368.41
%20of%20Analog%20CID%2053347968.&p=BOOKS&id=133420_ml278f33.jpg "Click on image to zoom")
1H NMR Spectrum (300 MHz, DMSO-d6) of Analog CID 53347968

UPLC-MS Chromatogram of Analog CID 53347968
FW = 368.41
%20of%20Analog%20CID%2053347974.&p=BOOKS&id=133420_ml278f35.jpg "Click on image to zoom")
1H NMR Spectrum (300 MHz, DMSO-d6) of Analog CID 53347974

UPLC-MS Chromatogram of Analog CID 53347974
FW = 368.41
%20of%20Analog%20CID%2053262919.&p=BOOKS&id=133420_ml278f37.jpg "Click on image to zoom")
1H NMR Spectrum (300 MHz, DMSO-d6) of Analog CID 53262919

UPLC-MS Chromatogram of Analog CID 53262919
FW = 378.45
%20of%20Analog%20CID%2053262921.&p=BOOKS&id=133420_ml278f39.jpg "Click on image to zoom")
1H NMR Spectrum (300 MHz, DMSO-d6) of Analog CID 53262921

UPLC-MS Chromatogram of Analog CID 53262921
FW = 378.45
%20of%20Analog%20CID%2053393838.&p=BOOKS&id=133420_ml278f41.jpg "Click on image to zoom")
1H NMR Spectrum (300 MHz, DMSO-d6) of Analog CID 53393838

UPLC-MS Chromatogram of Analog CID 53393838
FW = 417.48
%20of%20Analog%20CID%2053377424.&p=BOOKS&id=133420_ml278f43.jpg "Click on image to zoom")
1H NMR Spectrum (300 MHz, DMSO) of Analog CID 53377424

UPLC-MS Chromatogram of Analog CID 53377424
FW = 418.47
%20of%20Analog%20CID%2053347952.&p=BOOKS&id=133420_ml278f45.jpg "Click on image to zoom")
1H NMR Spectrum (300 MHz, DMSO-d6) of Analog CID 53347952

UPLC-MS Chromatogram of Analog CID 53347952
FW = 408.47
%20of%20Analog%20CID%2053262918.&p=BOOKS&id=133420_ml278f47.jpg "Click on image to zoom")
1H NMR Spectrum (300 MHz, DMSO-d6) of Analog CID 53262918

UPLC-MS Chromatogram of Analog CID 53262918
FW = 377.46
%20of%20Analog%20CID%201458888.&p=BOOKS&id=133420_ml278f49.jpg "Click on image to zoom")
1H NMR Spectrum (300 MHz, DMSO-d6) of Analog CID 1458888

UPLC-MS Chromatogram of Analog CID 1458888
FW = 395.45
%20of%20Analog%20CID%2053347958.&p=BOOKS&id=133420_ml278f51.jpg "Click on image to zoom")
1H NMR Spectrum (300 MHz, DMSO-d6) of Analog CID 53347958

UPLC-MS Chromatogram of Analog CID 53347958
FW = 402.47
%20of%20Analog%20CID%2053262913%20(Solubility%20was%20too%20low%20to%20obtain%20a%20reasonable%20spectrum).&p=BOOKS&id=133420_ml278f53.jpg "Click on image to zoom")
1H NMR Spectrum (300 MHz, DMSO-d6) of Analog CID 53262913
(Solubility was too low to obtain a reasonable spectrum)

UPLC-MS Chromatogram of Analog CID 53262913
FW = 407.49
%20of%20Analog%20CID%201458885.&p=BOOKS&id=133420_ml278f55.jpg "Click on image to zoom")
1H NMR Spectrum (300 MHz, DMSO-d6) of Analog CID 1458885

UPLC-MS Chromatogram of Analog CID 1458885
FW = 407.49
%20of%20Analog%20CID%2053347940.&p=BOOKS&id=133420_ml278f57.jpg "Click on image to zoom")
1H NMR Spectrum (300 MHz, DMSO-d6) of Analog CID 53347940

UPLC-MS Chromatogram of Analog CID 53347940
FW = 461.46
%20of%20Analog%20CID%2053347941.&p=BOOKS&id=133420_ml278f59.jpg "Click on image to zoom")
1H NMR Spectrum (300 MHz, DMSO-d6) of Analog CID 53347941

UPLC-MS Chromatogram of Analog CID 53347941
FW = 437.51
%20of%20Analog%20CID%2053347941.&p=BOOKS&id=133420_ml278f61.jpg "Click on image to zoom")
1H NMR Spectrum (300 MHz, DMSO-d6) of Analog CID 53347941

UPLC-MS Chromatogram of Analog CID 53347941
FW = 437.51
%20of%20Analog%20CID%2053377425.&p=BOOKS&id=133420_ml278f63.jpg "Click on image to zoom")
1H NMR (300 MHz, CDCl3) of Analog CID 53377425

UPLC-MS Chromatogram of Analog CID 53377425
FW = 451.54
%20of%20Analog%20CID%2053393842.&p=BOOKS&id=133420_ml278f65.jpg "Click on image to zoom")
1H NMR Spectrum (300 MHz, DMSO-d6) of Analog CID 53393842

UPLC-MS Chromatogram of Analog CID 53393842
FW = 423.53
%20of%20Analog%20CID%2053347969.&p=BOOKS&id=133420_ml278f67.jpg "Click on image to zoom")
1H NMR Spectrum (300 MHz, CDCl3) of Analog CID 53347969

LC-MS Chromatogram of Analog CID 53347969
FW = 351.36
%20of%20Analog%20CID%2053347964.&p=BOOKS&id=133420_ml278f69.jpg "Click on image to zoom")
1H NMR Spectrum (300 MHz, CDCl3) of Analog CID 53347964

UPLC-MS Chromatogram of Analog CID 53347964
FW = 350.37
%20of%20Analog%20CID%2053377423.&p=BOOKS&id=133420_ml278f71.jpg "Click on image to zoom")
1H NMR Spectrum (300 MHz, CDCl3) of Analog CID 53377423

UPLC-MS Chromatogram of Analog CID 53377423
FW = 396.40
%20of%20Analog%20CID%2053393834.&p=BOOKS&id=133420_ml278f73.jpg "Click on image to zoom")
1H NMR Spectrum (300 MHz, DMSO-d6) of Analog CID 53393834

UPLC-MS Chromatogram of Analog CID 53393834
FW = XXX.XX
%20of%20Analog%20CID%2053377450.&p=BOOKS&id=133420_ml278f75.jpg "Click on image to zoom")
1H NMR Spectrum (300 MHz, CDCl3) of Analog CID 53377450

UPLC-MS Chromatogram of Analog CID 53377450
FW = 382.46
Free amine
%20of%20Analog%20CID%2053377427.&p=BOOKS&id=133420_ml278f77.jpg "Click on image to zoom")
1H NMR Spectrum (300 MHz, CDCl3) of Analog CID 53377427

UPLC-MS Chromatogram of Analog CID 53377427
FW = 379.43
%20of%20CID%2053393833.&p=BOOKS&id=133420_ml278f79.jpg "Click on image to zoom")
1H NMR Spectrum (300 MHz, CDCl3) of CID 53393833

UPLC-MS Chromatogram of Analog CID 53393833
FW = 435.50
%20of%20Analog%20CID%2053377433.&p=BOOKS&id=133420_ml278f81.jpg "Click on image to zoom")
1H NMR (300 MHz, DMSO-d6) of Analog CID 53377433

UPLC-MS Chromatogram of Analog CID 53377433
FW = 341.38
%20of%20Analog%20CID%2053377426.&p=BOOKS&id=133420_ml278f83.jpg "Click on image to zoom")
1H NMR (300 MHz, DMSO-d6) of Analog CID 53377426

UPLC-MS Chromatogram of Analog CID 53377426
FW = 381.48
%20of%20Analog%20CID%2053393841.&p=BOOKS&id=133420_ml278f85.jpg "Click on image to zoom")
1H NMR Spectrum (300 MHz, CDCl3) of Analog CID 53393841

UPLC-MS Chromatogram of Analog Analog CID 53393841
FW =465.56
%20of%20Analog%20CID%2053393840.&p=BOOKS&id=133420_ml278f87.jpg "Click on image to zoom")
1H NMR Spectrum (300 MHz, CDCl3) of Analog CID 53393840

UPLC-MS Chromatogram of Analog CID 53393840
FW = 395.47
%20of%20Analog%20CID%2053347949.&p=BOOKS&id=133420_ml278f89.jpg "Click on image to zoom")
1H NMR Spectrum (300 MHz, CDCl3) of Analog CID 53347949

UPLC-MS Chromatogram of Analog BRD CID 53347949
FW = 351.42
%20of%20Analog%20CID%2053348001.&p=BOOKS&id=133420_ml278f91.jpg "Click on image to zoom")
1H NMR Spectrum (300 MHz, CDCl3) of Analog CID 53348001

UPLC-MS Chromatogram of Analog CID 53348001
FW = 381.45
%20of%20Analog%20CID%2043816465.&p=BOOKS&id=133420_ml278f93.jpg "Click on image to zoom")
1H NMR Spectrum (300 MHz, CDCl3) of Analog CID 43816465

UPLC-MS Chromatogram of Analog CID 43816465
FW = 389.45
%20of%20Analog%20CID%2053377441.&p=BOOKS&id=133420_ml278f95.jpg "Click on image to zoom")
1H NMR Spectrum (300 MHz, CDCl3) of Analog CID 53377441

UPLC-MS Chromatogram of Analog CID 53377441
FW = 423.48
%20of%20Analog%20CID%2053377444.&p=BOOKS&id=133420_ml278f97.jpg "Click on image to zoom")
1H NMR Spectrum (300 MHz, CDCl3) of Analog CID 53377444

UPLC-MS Chromatogram of Analog CID 53377444
FW = 439.48
%20of%20Analog%20CID%2053377409.&p=BOOKS&id=133420_ml278f99.jpg "Click on image to zoom")
1H NMR Spectrum (300 MHz, CDCl3) of Analog CID 53377409

UPLC-MS Chromatogram of Analog CID 53377409
FW = 481.56
%20of%20CID%2053377428.&p=BOOKS&id=133420_ml278f101.jpg "Click on image to zoom")
1H NMR Spectrum (300 MHz, CDCl3) of CID 53377428

UPLC-MS Chromatogram of Analog CID 53377428
FW = 452.53
- Probe Structure and Characteristics
- Recommendations for Scientific Use of the Probe
- Introduction
- Materials and Methods
- Results
- Discussion
- References
- Assay Summary Table
- Detailed Assay Protocols
- Experimental Procedures for the Synthesis of the Probe(s)
- Experimental Procedure for Additional Analytical Assays
- Chemical Characterization Data for Probe 1
- Prior Art Search
- Compounds Provided to Evotec
- Additional Analogs
- Chemical Characterization Data for All Analogs
- PMCPubMed Central citations
- PubChem BioAssay for Chemical ProbePubChem BioAssay records reporting screening data for the development of the chemical probe(s) described in this book chapter
- PubChem SubstanceRelated PubChem Substances
- PubMedLinks to PubMed
- Review A Small Molecule Inhibitor of Scavenger Receptor BI-mediated Lipid Uptake—Probe 2.[Probe Reports from the NIH Mol...]Review A Small Molecule Inhibitor of Scavenger Receptor BI-mediated Lipid Uptake—Probe 2.Faloon PW, Dockendorff C, Germain A, Yu M, Nag PP, Youngsaye W, Bennion M, Lam G, Paterson C, Dandapani S, et al. Probe Reports from the NIH Molecular Libraries Program. 2010
- Review A Small Molecule Inhibitor of Scavenger Receptor BI-mediated Lipid Uptake - Probe 3.[Probe Reports from the NIH Mol...]Review A Small Molecule Inhibitor of Scavenger Receptor BI-mediated Lipid Uptake - Probe 3.Faloon PW, Dockendorff C, Yu M, Bennion M, Johnston S, Negri J, Dandapani S, Munoz B, Perez JR, Palmer M, et al. Probe Reports from the NIH Molecular Libraries Program. 2010
- Indolinyl-Thiazole Based Inhibitors of Scavenger Receptor-BI (SR-BI)-Mediated Lipid Transport.[ACS Med Chem Lett. 2015]Indolinyl-Thiazole Based Inhibitors of Scavenger Receptor-BI (SR-BI)-Mediated Lipid Transport.Dockendorff C, Faloon PW, Yu M, Youngsaye W, Penman M, Nieland TJ, Nag PP, Lewis TA, Pu J, Bennion M, et al. ACS Med Chem Lett. 2015 Apr 9; 6(4):375-380. Epub 2015 Feb 2.
- Discovery of bisamide-heterocycles as inhibitors of scavenger receptor BI (SR-BI)-mediated lipid uptake.[Bioorg Med Chem Lett. 2015]Discovery of bisamide-heterocycles as inhibitors of scavenger receptor BI (SR-BI)-mediated lipid uptake.Dockendorff C, Faloon PW, Germain A, Yu M, Youngsaye W, Nag PP, Bennion M, Penman M, Nieland TJ, Dandapani S, et al. Bioorg Med Chem Lett. 2015 Jun 15; 25(12):2594-8. Epub 2015 Apr 11.
- Discovery of chemical inhibitors of the selective transfer of lipids mediated by the HDL receptor SR-BI.[Proc Natl Acad Sci U S A. 2002]Discovery of chemical inhibitors of the selective transfer of lipids mediated by the HDL receptor SR-BI.Nieland TJ, Penman M, Dori L, Krieger M, Kirchhausen T. Proc Natl Acad Sci U S A. 2002 Nov 26; 99(24):15422-7. Epub 2002 Nov 18.
- A Small Molecule Inhibitor of Scavenger Receptor BI-mediated Lipid Uptake—Probe ...A Small Molecule Inhibitor of Scavenger Receptor BI-mediated Lipid Uptake—Probe 1 - Probe Reports from the NIH Molecular Libraries Program
- JGI_XZG41013.rev NIH_XGC_tropGas7 Xenopus tropicalis cDNA clone IMAGE:7556072 3'...JGI_XZG41013.rev NIH_XGC_tropGas7 Xenopus tropicalis cDNA clone IMAGE:7556072 3', mRNA sequencegi|57427709|gnl|dbEST|27125670|gb|C 09.1|Nucleotide
Your browsing activity is empty.
Activity recording is turned off.
See more...