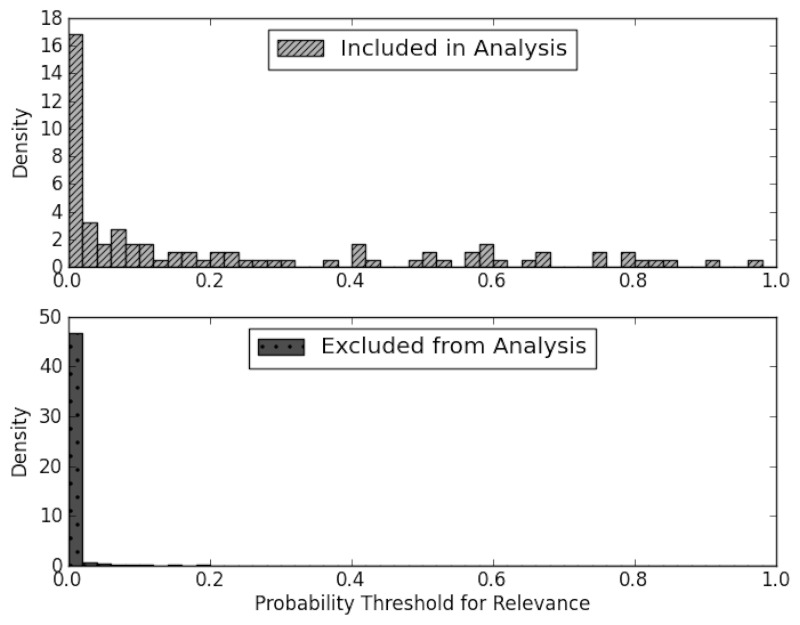
Figure 10 includes 2 histograms that graphically show predictive performance for the GLMnet model as applied to the LBD review data for the AE analysis. Prediction probabilities for the update are divided according to whether the article met final inclusion criteria. Each histogram shows the densities of articles classified in each probability bin, which range from 0.0 to 1.0 in steps of 0.02. The bottom histogram shows predictions probabilities in those articles excluded from the AE analysis; excluded articles were predominantly given probabilities very close to zero with the only large spike between probability thresholds of 0.0 and 0.02. The top histogram displays the distribution of articles considered for the AE analysis; included articles were assigned probabilities within the range of 0.0 to 0.86. By contrast to Figures 4,6 and 8, there were numerous included articles assigned probabilities less than 0.02, with that bar (probability between 0.0 and 0.02) being the largest single bar on the entire histogram. In fact, 11.6% of AE-relevant articles were assigned probabilities <0.005.

Figure 10Histogram LBD AE analysis: distribution of predictions

From: Results

Cover of A Pilot Study Using Machine Learning and Domain Knowledge To Facilitate Comparative Effectiveness Review Updating
A Pilot Study Using Machine Learning and Domain Knowledge To Facilitate Comparative Effectiveness Review Updating [Internet].
Dalal SR, Shekelle PG, Hempel S, et al.

NCBI Bookshelf. A service of the National Library of Medicine, National Institutes of Health.