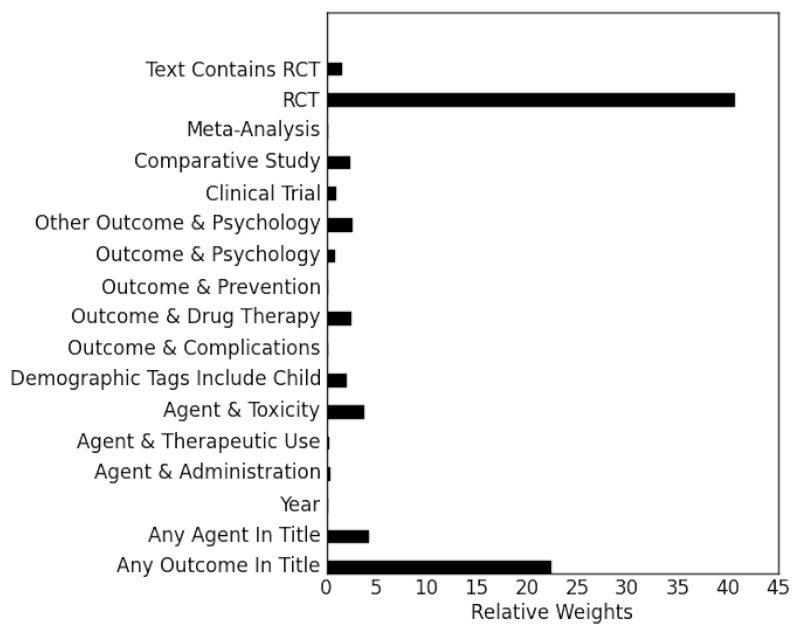
Figure 7 is a horizontal bar graph that shows the relative weights of selected variables generated using the GBM algorithm, as applied to the original data from the AAP review for the AE analysis. Variables with larger relative weights account for large fractions of the total explanatory power, and are represented with longer bars on this graph. Weights range from <1 percent (“Agent & Therapeutic Use”, “Meta-Analysis”, “Outcome & Complications”, and others) to >40 percent (“RCT”). The latter result is in accord the differences in frequency distributions between included and excluded studies. The variable “Any Outcome In Title” is also important here, with >20 percent of explanatory power. Additional variables with 1–5 percent of explanatory power include “Other Outcome & Psychology”, “Outcome & Drug Therapy”, ‘Demographic Tags Include Child”, “Any Agent In Title”, and “Agent & Toxicity”.

Figure 7Relative weights for variables in AAP AE analysis

From: Results

Cover of A Pilot Study Using Machine Learning and Domain Knowledge To Facilitate Comparative Effectiveness Review Updating
A Pilot Study Using Machine Learning and Domain Knowledge To Facilitate Comparative Effectiveness Review Updating [Internet].
Dalal SR, Shekelle PG, Hempel S, et al.

NCBI Bookshelf. A service of the National Library of Medicine, National Institutes of Health.